| Param | Original file | Final file |
|---|---|---|
| Filename | modeM0/AS1A04_010T01_9000002046_13884cztM0_level2.evt | modeM0/AS1A04_010T01_9000002046_13884cztM0_level2_quad_clean.evt |
| Size (bytes) | 531,046,080 | 90,253,440 |
| Size | 506.4 MB | 86.1 MB |
| Events in quadrant A | 3,721,575 | 559,306 |
| Events in quadrant B | 3,740,280 | 564,026 |
| Events in quadrant C | 3,615,482 | 559,422 |
| Events in quadrant D | 4,504,730 | 536,809 |
| Mode M9 | |||
|---|---|---|---|
| Quadrant | BADHDUFLAG | Total packets | Discarded packets |
| A | 0 | 14 | 0 |
| B | 0 | 14 | 0 |
| C | 0 | 14 | 0 |
| D | 0 | 14 | 0 |
| Mode SS | |||
|---|---|---|---|
| Quadrant | BADHDUFLAG | Total packets | Discarded packets |
| A | 0 | 152 | 0 |
| B | 0 | 152 | 0 |
| C | 0 | 152 | 0 |
| D | 0 | 152 | 0 |
| Mode M0 | |||
|---|---|---|---|
| Quadrant | BADHDUFLAG | Total packets | Discarded packets |
| A | 0 | 15861 | 3 |
| B | 0 | 15860 | 2 |
| C | 0 | 15369 | 2 |
| D | 0 | 18387 | 2 |
| Quadrant | Total seconds | Saturated seconds | Saturation percentage |
|---|---|---|---|
| A | 7377 | 81 | 1.098007% |
| B | 7377 | 132 | 1.789345% |
| C | 7377 | 42 | 0.569337% |
| D | 7377 | 82 | 1.111563% |
Noise dominated data is calculated using 1-second bins in cleaned event files. If a bin has >2000 counts, and if more than 50% of those come from <1% of pixels, then it is considered to be noise-dominated and hence unusable.
| Quadrant | # 1 sec bins | Bins with >0 counts | Bins with >2000 counts | High rate bins dominated by noise | Noise dominated (total time) | Noise dominated (detector-on time) | Marked lightcurve |
|---|---|---|---|---|---|---|---|
| A | 8783 | 7379 | 13 | 13 | 0.15% | 0.18% | 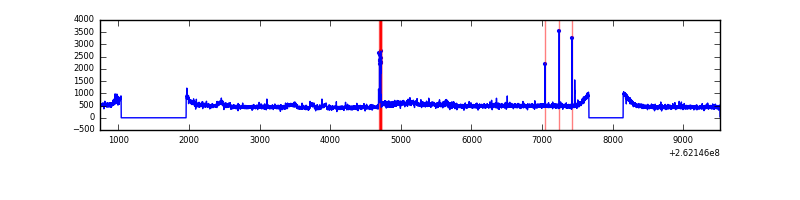 |
| B | 8783 | 7379 | 22 | 22 | 0.25% | 0.30% | 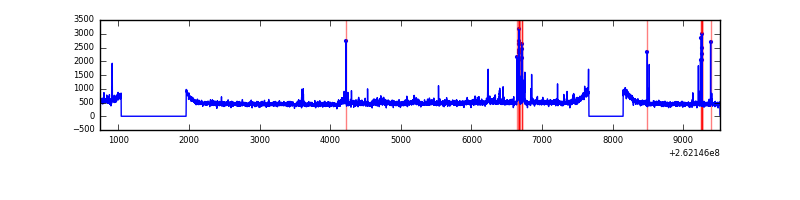 |
| C | 8783 | 7380 | 0 | 0 | 0.00% | 0.00% | 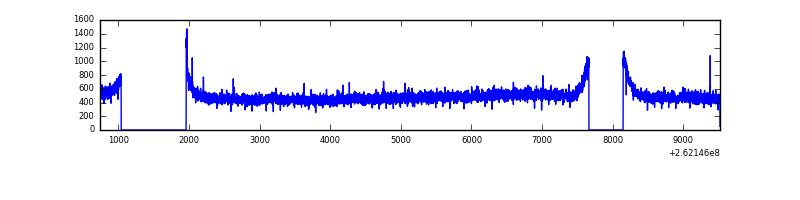 |
| D | 8783 | 7378 | 29 | 29 | 0.33% | 0.39% | 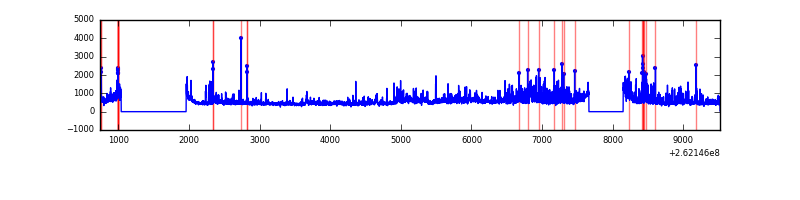 |
Top three noisy pixels from each quadrant. If the there are fewer than three noisy pixels in the level2.evt file, extra rows are filled as -1
| Pixel properties | Quadrant properties | ||||||
|---|---|---|---|---|---|---|---|
| Quadrant | DetID | PixID | Counts | Sigma | Mean | Median | Sigma |
| A | 0 | 23 | 198709 | 1087.52 | 894 | 872 | 181.9 |
| A | 8 | 15 | 25401 | 134.84 | 894 | 872 | 181.9 |
| A | 4 | 2 | 20874 | 109.95 | 894 | 872 | 181.9 |
| B | 0 | 219 | 88818 | 507.49 | 892 | 867 | 173.3 |
| B | 0 | 214 | 66088 | 376.33 | 892 | 867 | 173.3 |
| B | 4 | 80 | 40229 | 227.12 | 892 | 867 | 173.3 |
| C | 3 | 233 | 211424 | 1026.57 | 872 | 877 | 205.1 |
| C | 12 | 4 | 7472 | 32.16 | 872 | 877 | 205.1 |
| C | 13 | 61 | 6303 | 26.46 | 872 | 877 | 205.1 |
| D | 1 | 52 | 571085 | 2775.13 | 860 | 839 | 205.5 |
| D | 5 | 222 | 216830 | 1051.13 | 860 | 839 | 205.5 |
| D | 12 | 110 | 136006 | 657.8 | 860 | 839 | 205.5 |
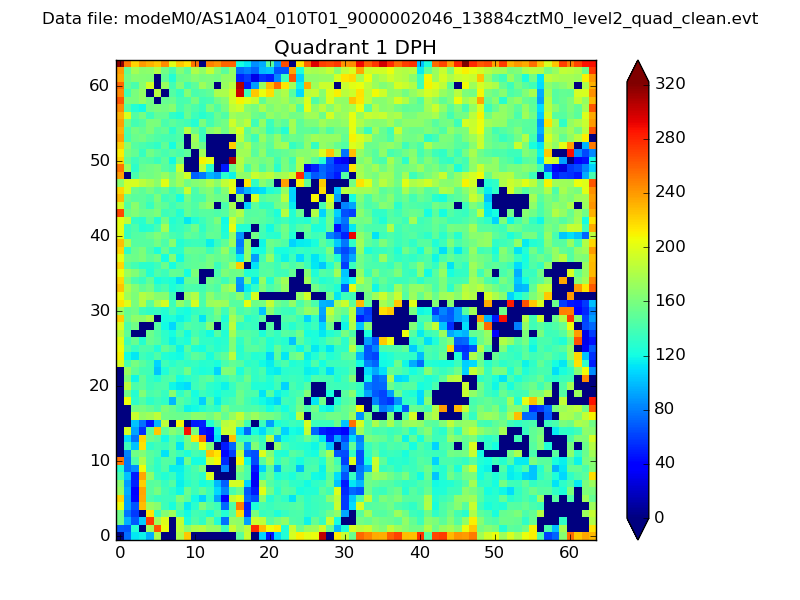
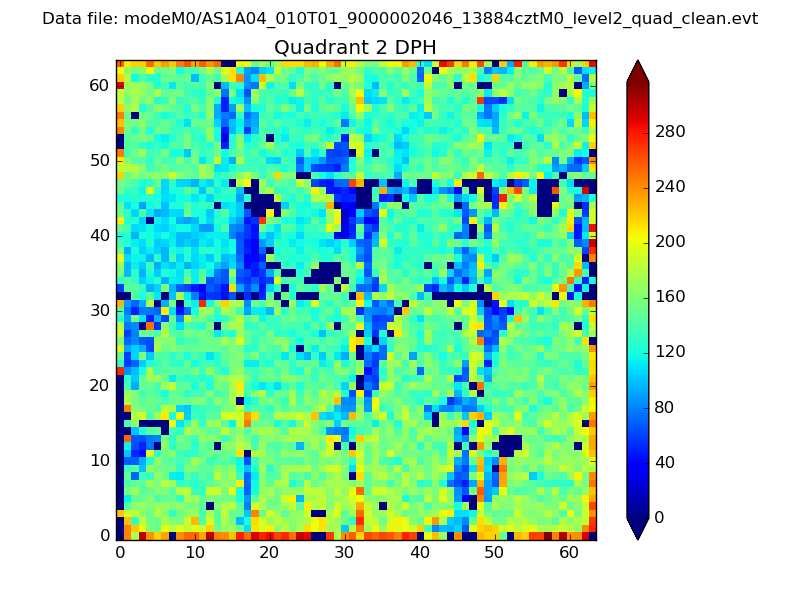
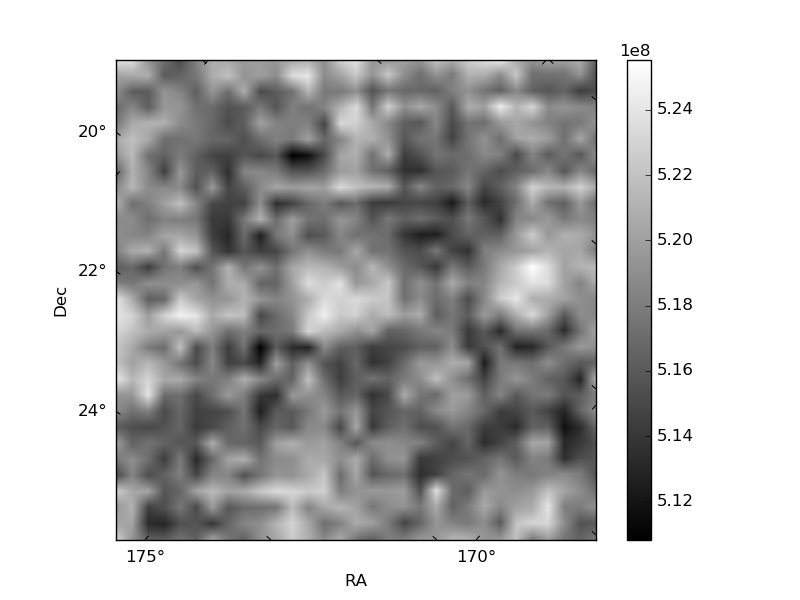
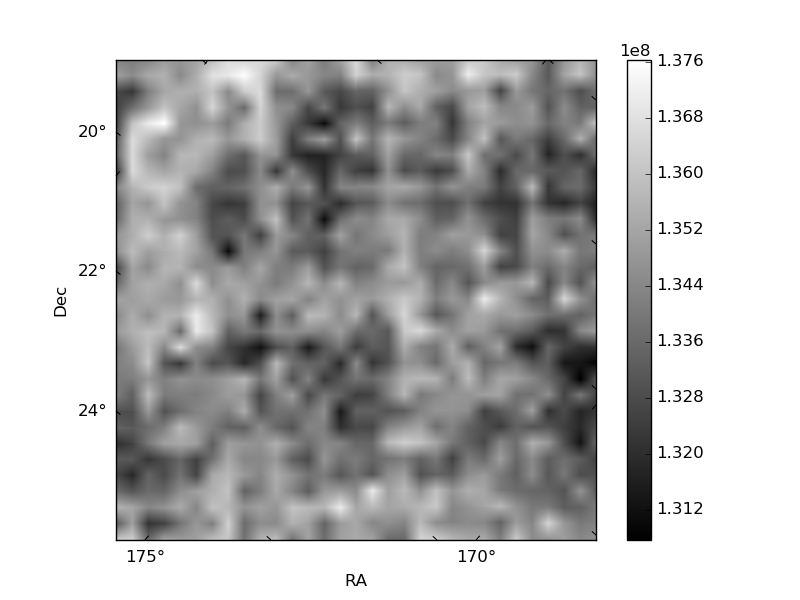
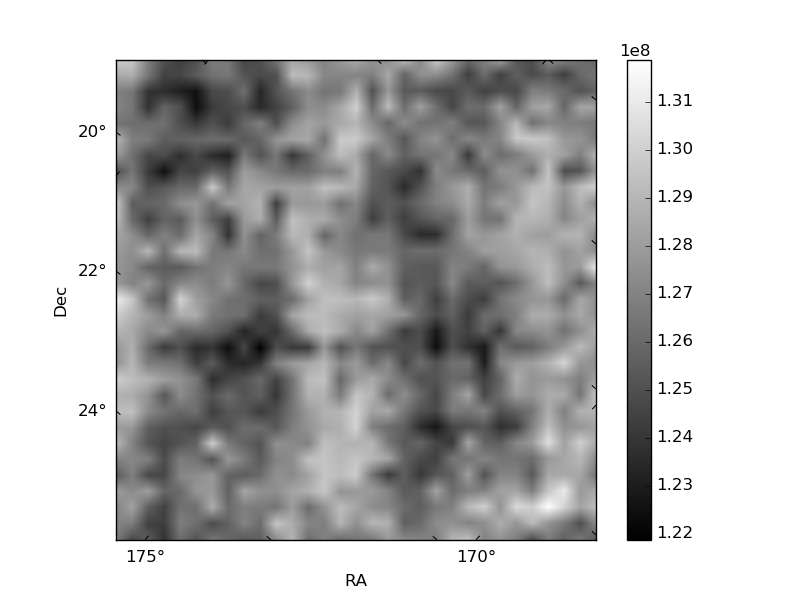
Histogram calculated using DETX and DETY for each event in the final _common_clean file
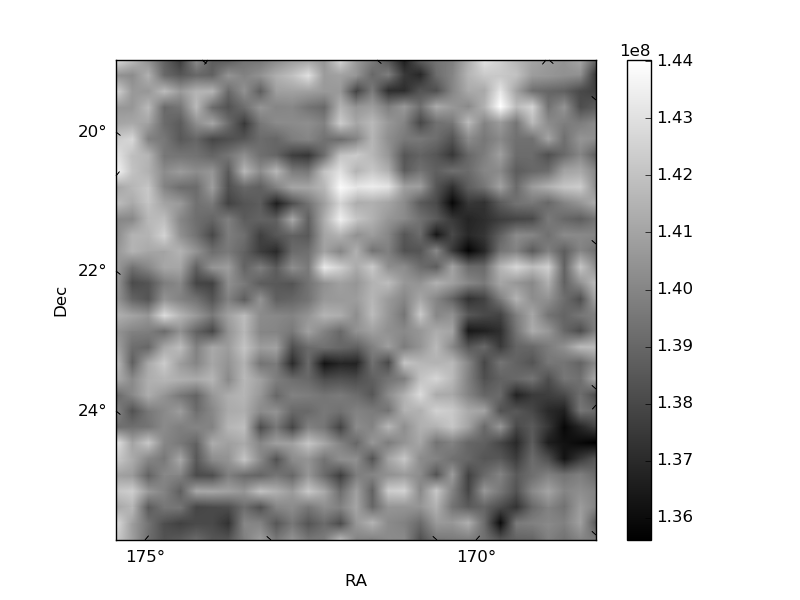
| Quadrant A | 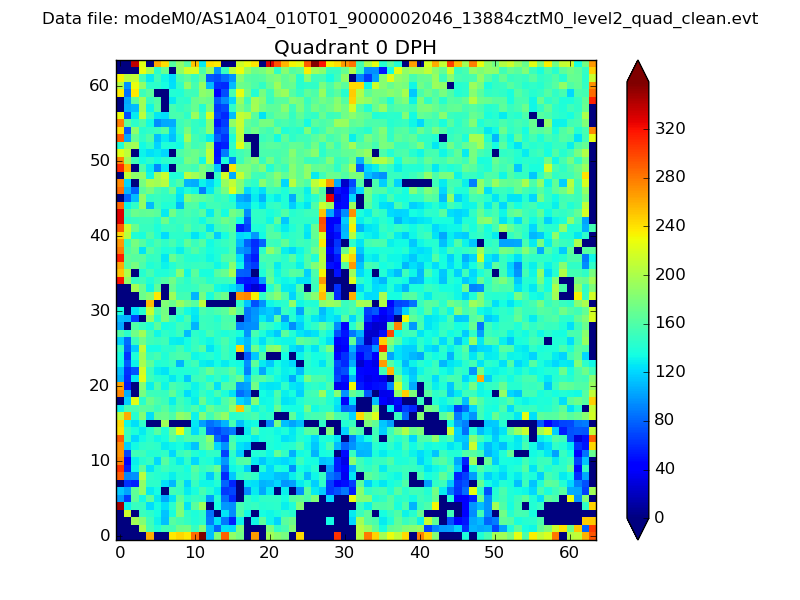 |
 |
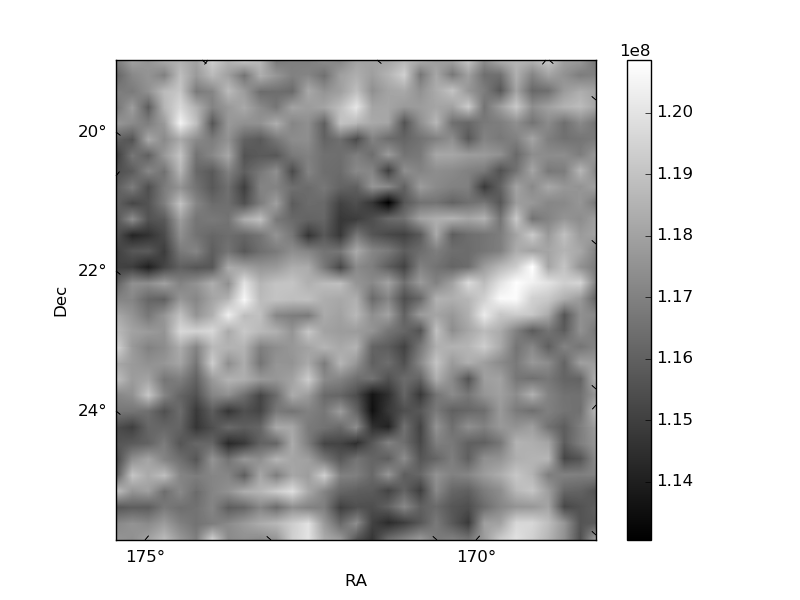
Quadrant B |
|---|---|---|---|
| Quadrant D |  |
 |
Quadrant C |
| Plot type | Count rate plots | Images |
|---|---|---|
| Comparison with Poisson distribution Blue bars denote a histogram of data divided into 1 sec bins. Red curve is a Poisson curve with rate = median count rate of data. |
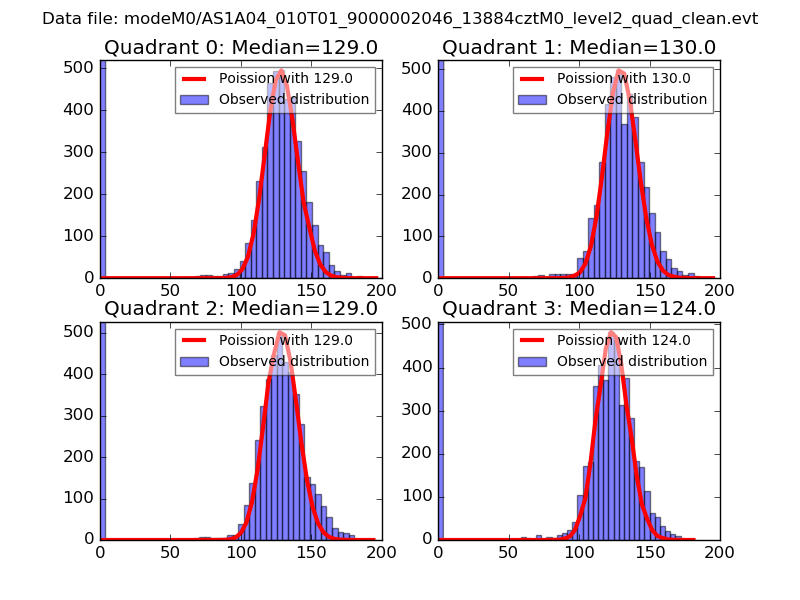 |
 |
| Quadrant-wise count rates Data is divided into 100 sec bins |
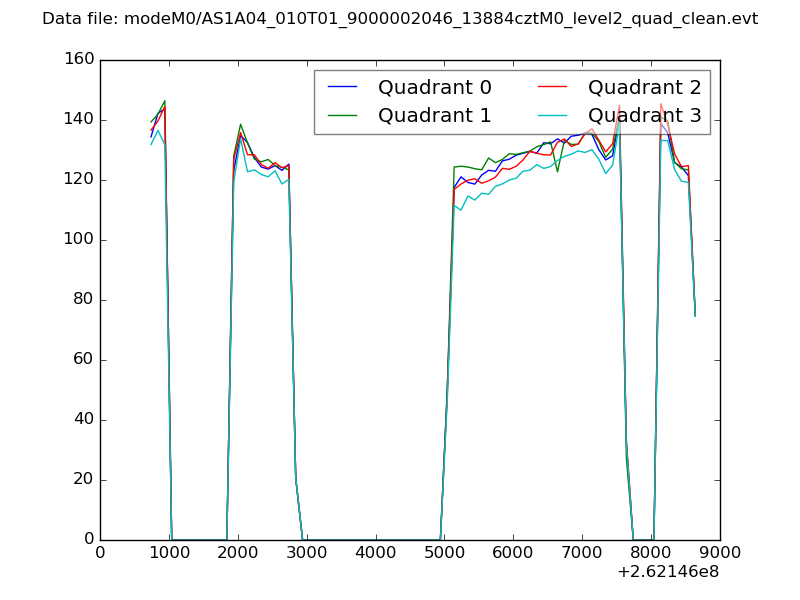 |
|
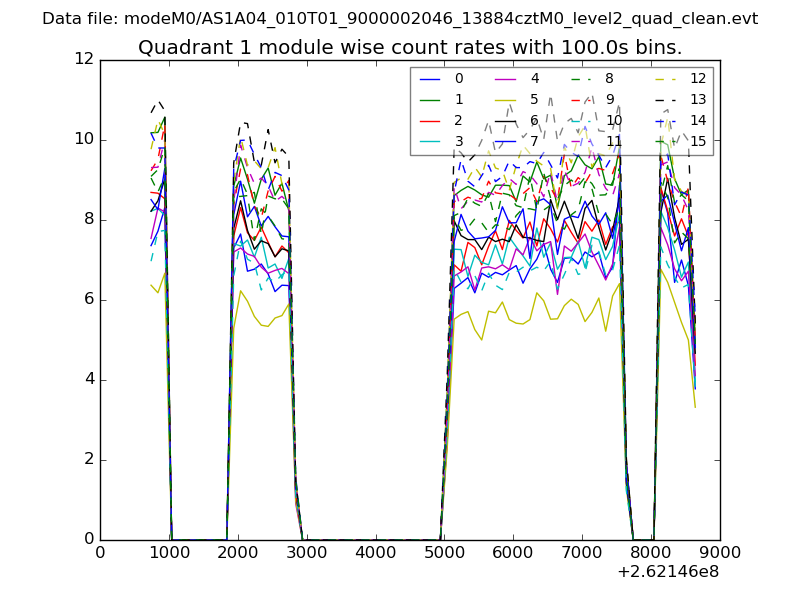
| Module-wise count rates for Quadrant A Data is divided into 100 sec bins |
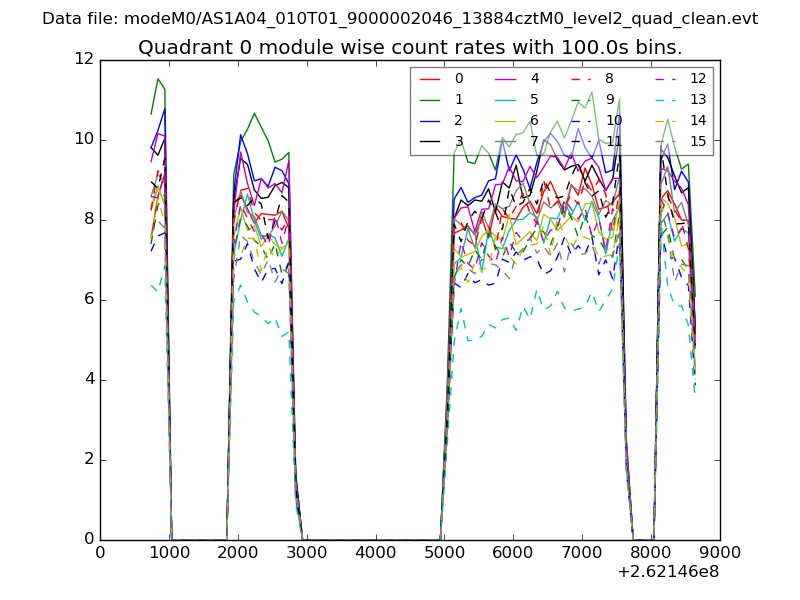 |
 |
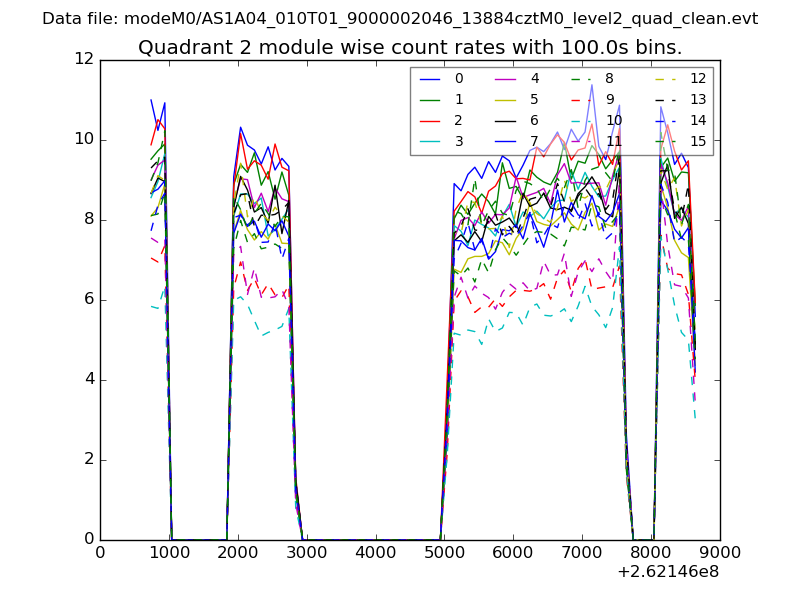
| Module-wise count rates for Quadrant B Data is divided into 100 sec bins |
 |
 |
| Module-wise count rates for Quadrant C Data is divided into 100 sec bins |
 |
 |
| Module-wise count rates for Quadrant D Data is divided into 100 sec bins |
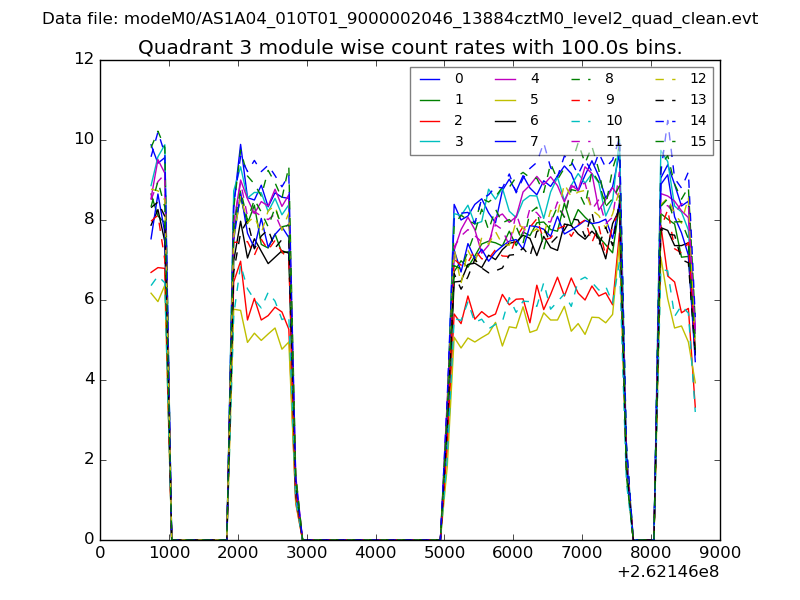 |
 |
| Parameter | Plot |
|---|---|
| CZT HV Monitor | 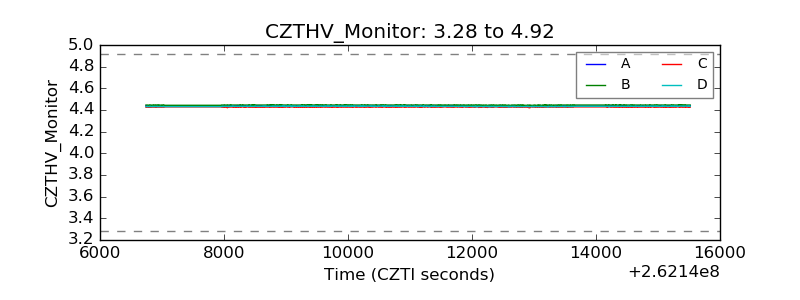 |
| D_VDD | 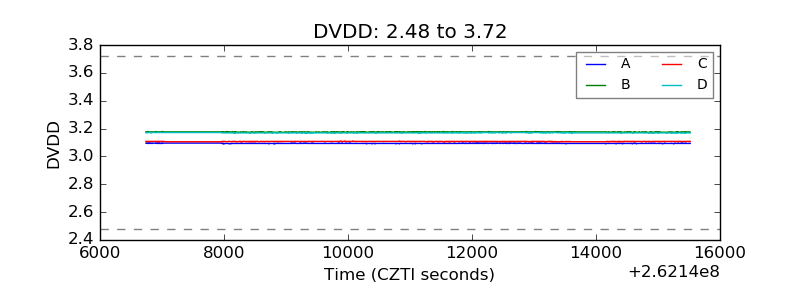 |
| Temperature 1 |  |
| Veto HV Monitor |  |
| Veto LLD | 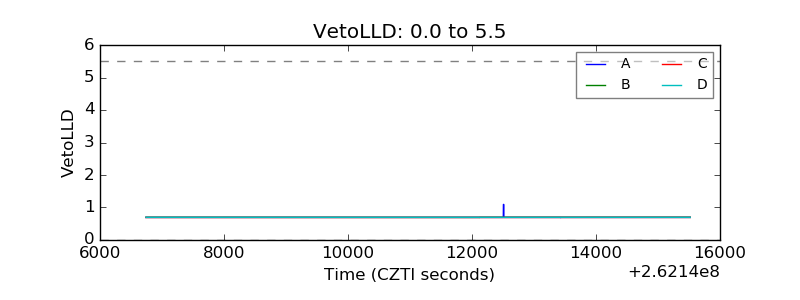 |
| Alpha Counter | 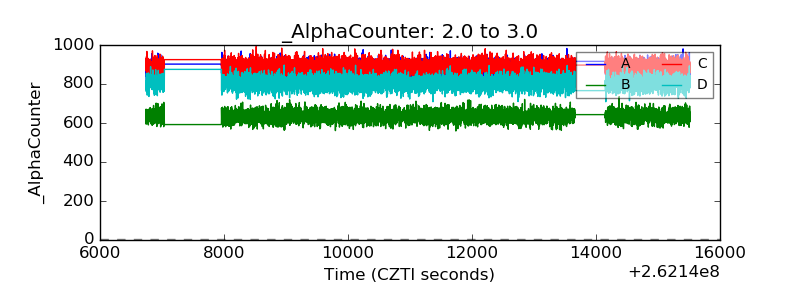 |
| _CPM_Rate |  |
| CZT Counter | 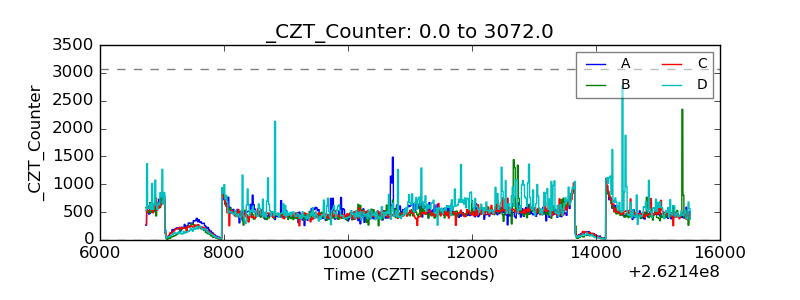 |
| +2.5 Volts monitor | 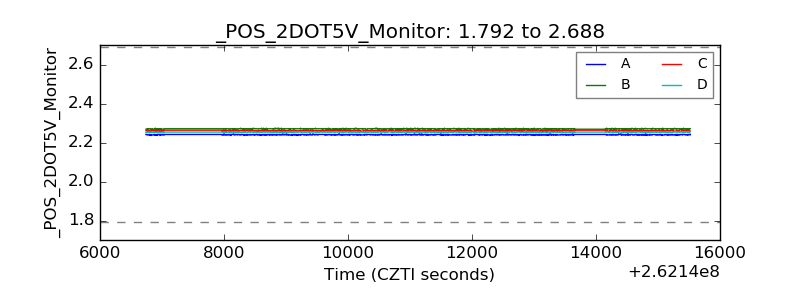 |
| +5 Volts monitor | 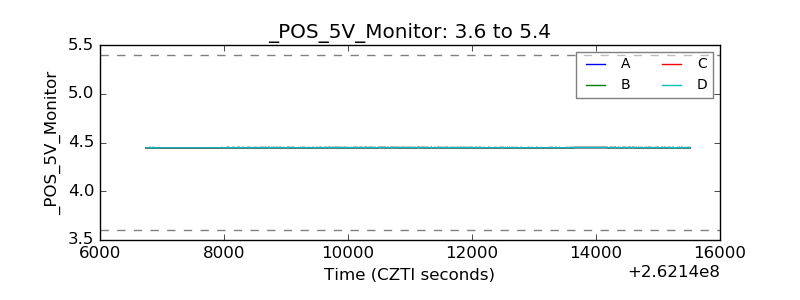 |
| _ROLL_ROT | 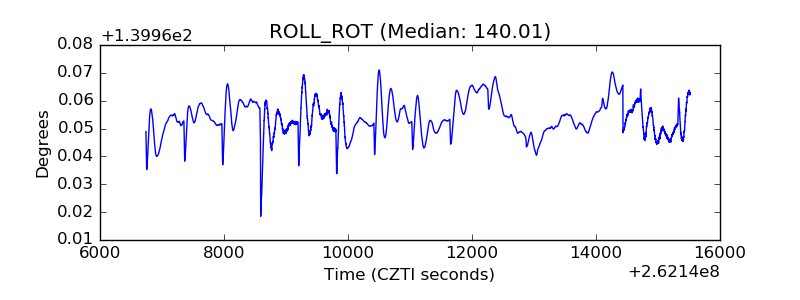 |
| _Roll_DEC | 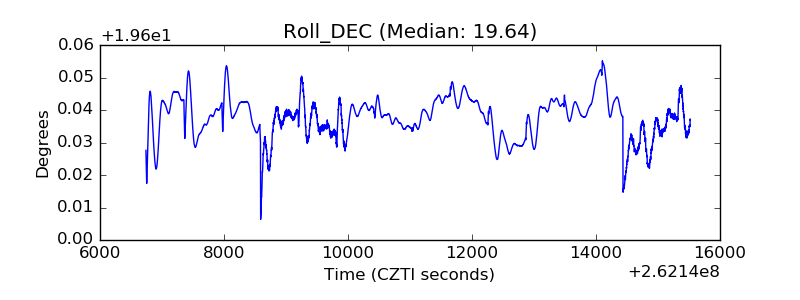 |
| _Roll_RA | 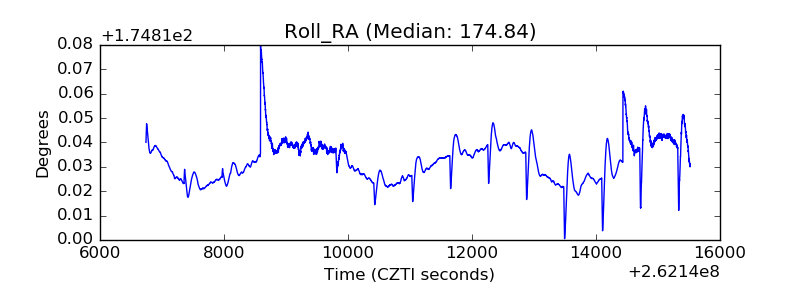 |
| Veto Counter | 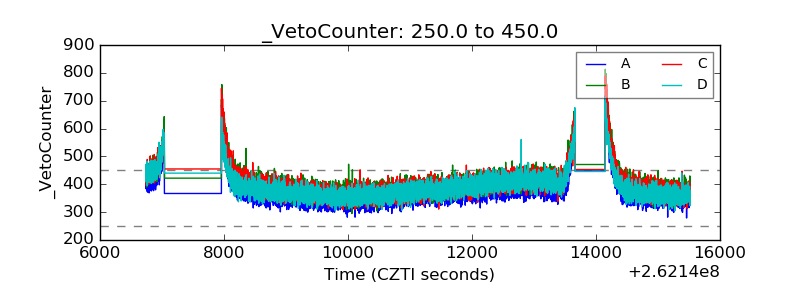 |