| Param | Original file | Final file |
|---|---|---|
| Filename | modeM0/AS1A04_010T01_9000002046_13885cztM0_level2.evt | modeM0/AS1A04_010T01_9000002046_13885cztM0_level2_quad_clean.evt |
| Size (bytes) | 655,597,440 | 101,934,720 |
| Size | 625.2 MB | 97.2 MB |
| Events in quadrant A | 4,550,487 | 624,298 |
| Events in quadrant B | 4,317,397 | 635,949 |
| Events in quadrant C | 4,316,071 | 638,505 |
| Events in quadrant D | 6,093,578 | 596,061 |
| Mode M9 | |||
|---|---|---|---|
| Quadrant | BADHDUFLAG | Total packets | Discarded packets |
| A | 0 | 6 | 0 |
| B | 0 | 6 | 0 |
| C | 0 | 6 | 0 |
| D | 0 | 6 | 0 |
| Mode SS | |||
|---|---|---|---|
| Quadrant | BADHDUFLAG | Total packets | Discarded packets |
| A | 0 | 174 | 0 |
| B | 0 | 174 | 0 |
| C | 0 | 174 | 0 |
| D | 0 | 174 | 0 |
| Mode M0 | |||
|---|---|---|---|
| Quadrant | BADHDUFLAG | Total packets | Discarded packets |
| A | 0 | 19245 | 3 |
| B | 0 | 18423 | 2 |
| C | 0 | 18087 | 2 |
| D | 0 | 23775 | 2 |
| Quadrant | Total seconds | Saturated seconds | Saturation percentage |
|---|---|---|---|
| A | 8520 | 453 | 5.316901% |
| B | 8520 | 383 | 4.495305% |
| C | 8520 | 199 | 2.335681% |
| D | 8520 | 419 | 4.917840% |
Noise dominated data is calculated using 1-second bins in cleaned event files. If a bin has >2000 counts, and if more than 50% of those come from <1% of pixels, then it is considered to be noise-dominated and hence unusable.
| Quadrant | # 1 sec bins | Bins with >0 counts | Bins with >2000 counts | High rate bins dominated by noise | Noise dominated (total time) | Noise dominated (detector-on time) | Marked lightcurve |
|---|---|---|---|---|---|---|---|
| A | 9116 | 8522 | 155 | 155 | 1.70% | 1.82% | 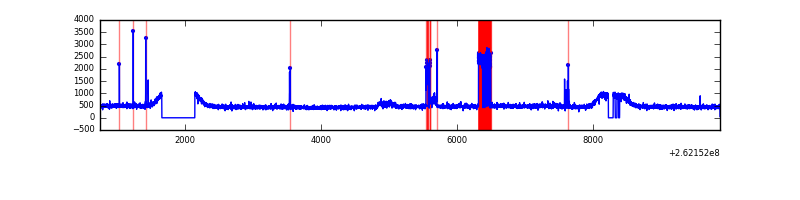 |
| B | 9116 | 8521 | 44 | 44 | 0.48% | 0.52% | 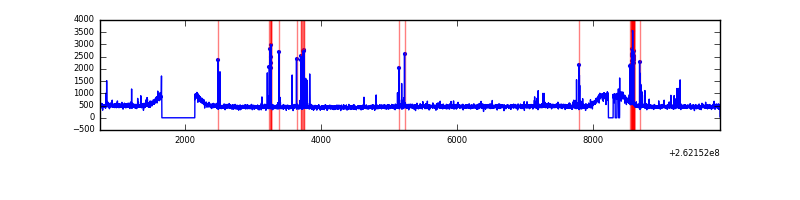 |
| C | 9116 | 8522 | 0 | 0 | 0.00% | 0.00% | 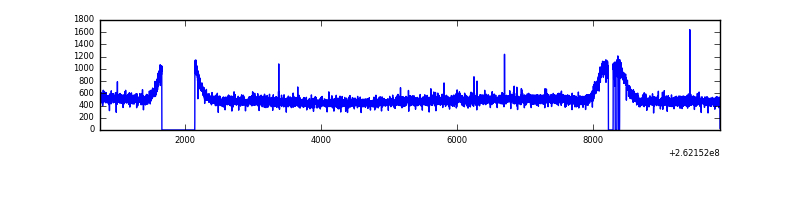 |
| D | 9116 | 8521 | 161 | 161 | 1.77% | 1.89% | 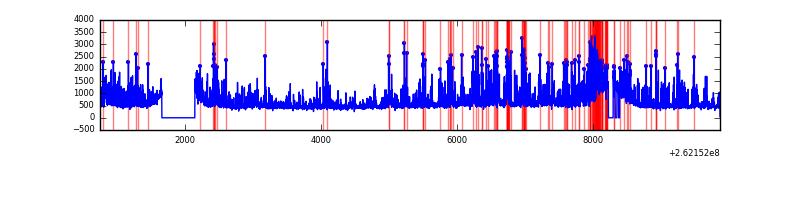 |
Top three noisy pixels from each quadrant. If the there are fewer than three noisy pixels in the level2.evt file, extra rows are filled as -1
| Pixel properties | Quadrant properties | ||||||
|---|---|---|---|---|---|---|---|
| Quadrant | DetID | PixID | Counts | Sigma | Mean | Median | Sigma |
| A | 0 | 23 | 431176 | 1995.81 | 1053 | 1025 | 215.5 |
| A | 0 | 226 | 36610 | 165.1 | 1053 | 1025 | 215.5 |
| A | 4 | 2 | 34049 | 153.22 | 1053 | 1025 | 215.5 |
| B | 4 | 80 | 165736 | 797.58 | 1050 | 1020 | 206.5 |
| B | 12 | 111 | 25431 | 118.2 | 1050 | 1020 | 206.5 |
| B | 11 | 111 | 21413 | 98.75 | 1050 | 1020 | 206.5 |
| C | 3 | 233 | 271575 | 1108.29 | 1037 | 1041 | 244.1 |
| C | 13 | 61 | 7538 | 26.62 | 1037 | 1041 | 244.1 |
| C | 14 | 234 | 3285 | 9.19 | 1037 | 1041 | 244.1 |
| D | 1 | 52 | 1398513 | 5754.68 | 1007 | 981 | 242.9 |
| D | 8 | 195 | 289465 | 1187.9 | 1007 | 981 | 242.9 |
| D | 13 | 122 | 234130 | 960.05 | 1007 | 981 | 242.9 |
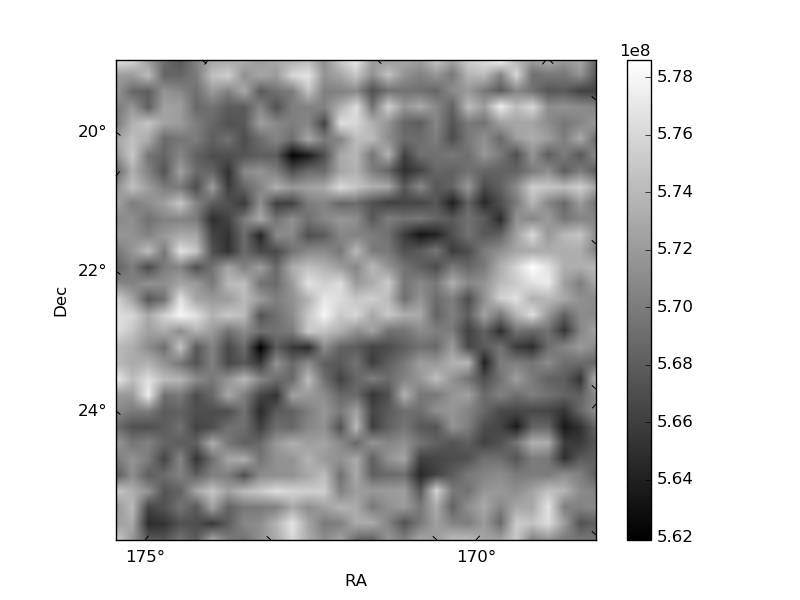
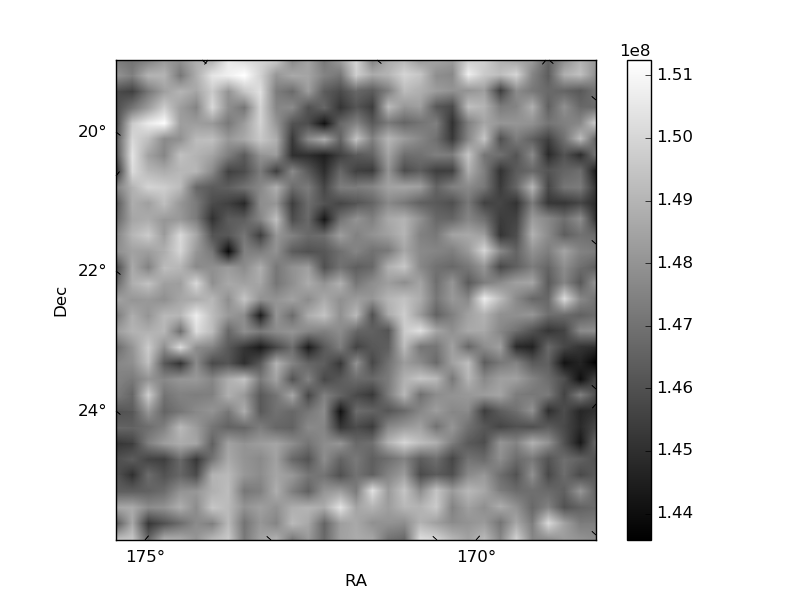
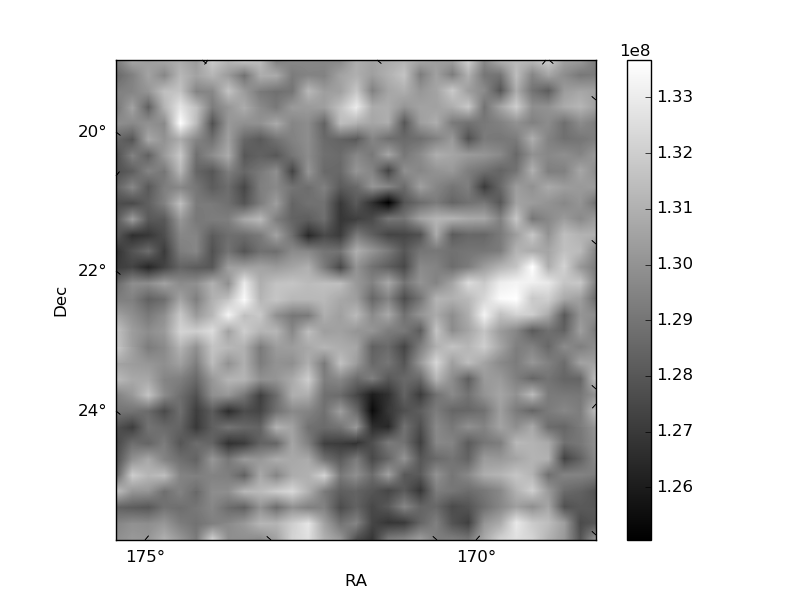
Histogram calculated using DETX and DETY for each event in the final _common_clean file
| Quadrant A | 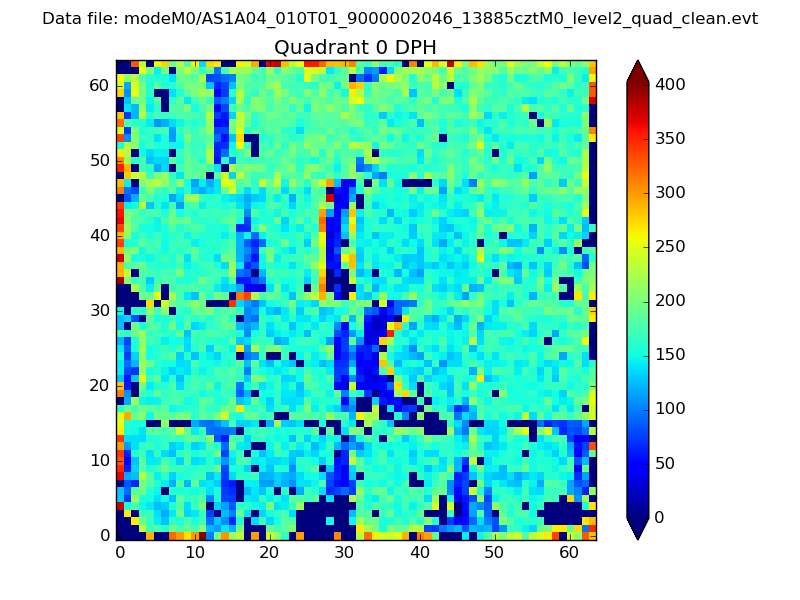 |
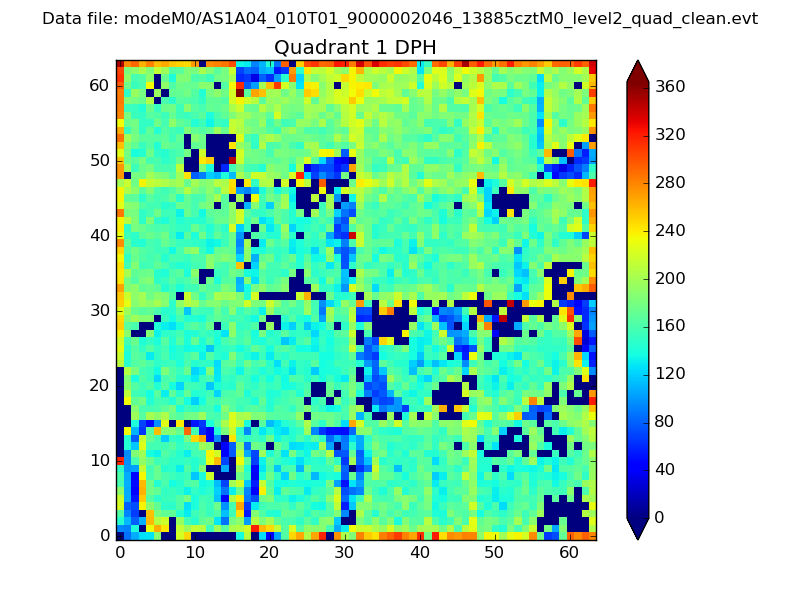 |
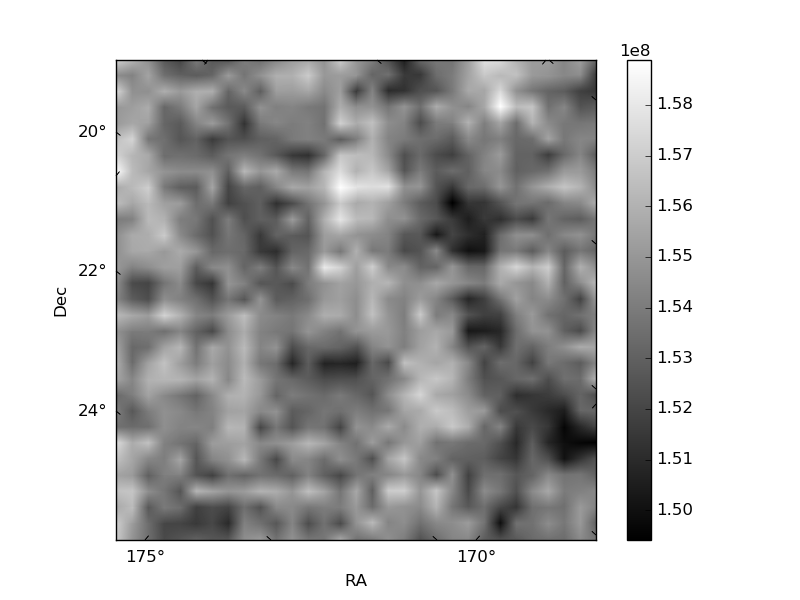
Quadrant B |
|---|---|---|---|
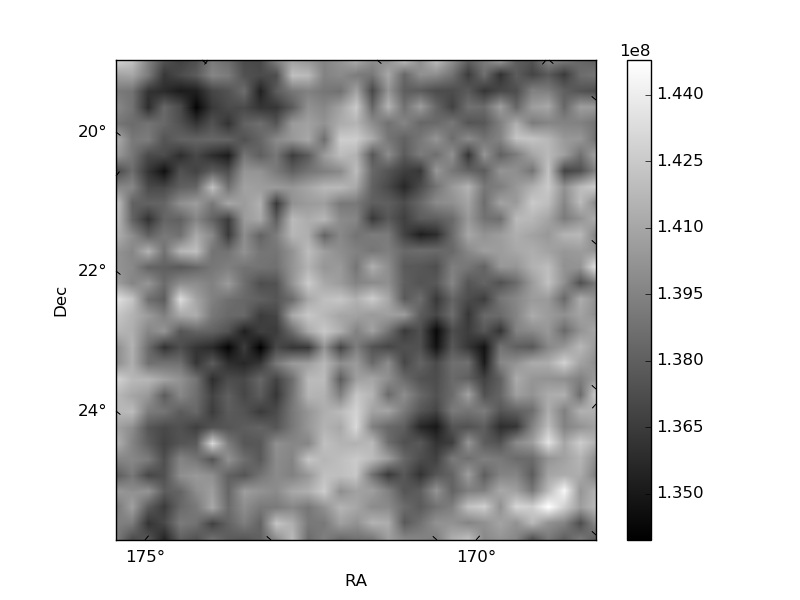
| Quadrant D | 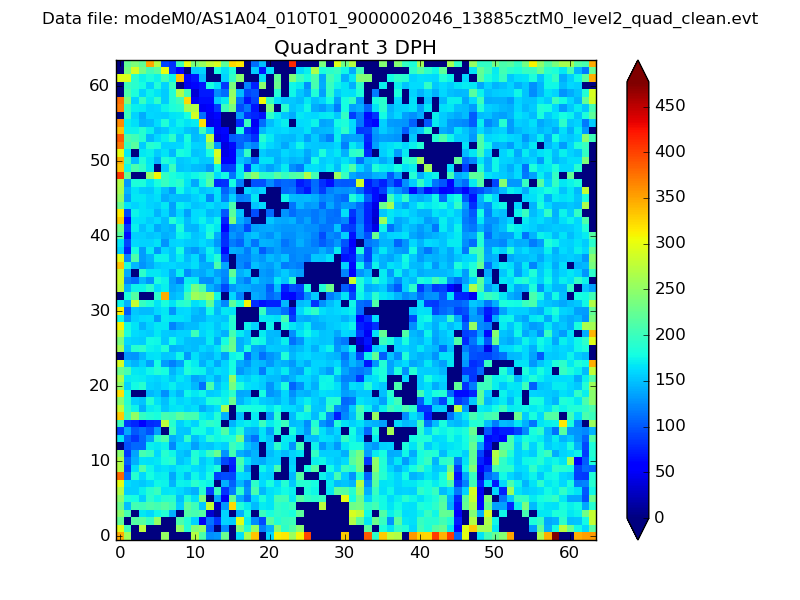 |
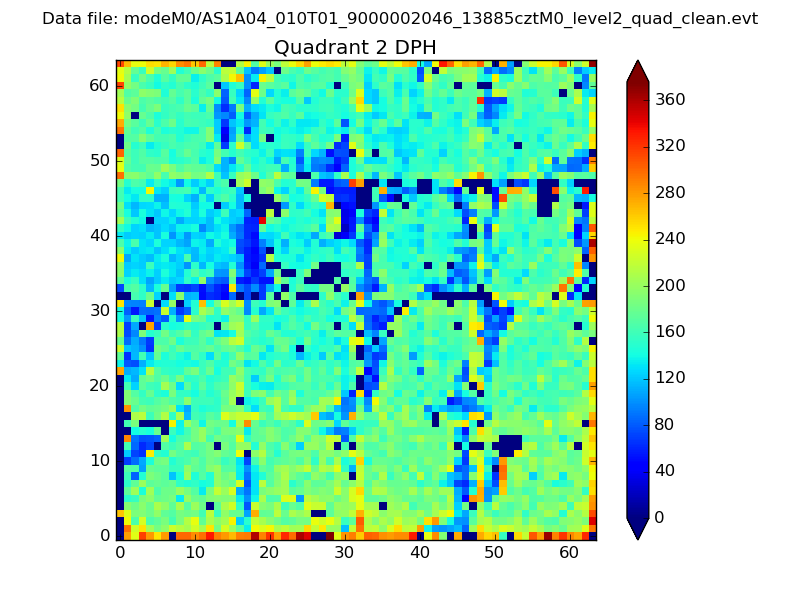 |
Quadrant C |
| Plot type | Count rate plots | Images |
|---|---|---|
| Comparison with Poisson distribution Blue bars denote a histogram of data divided into 1 sec bins. Red curve is a Poisson curve with rate = median count rate of data. |
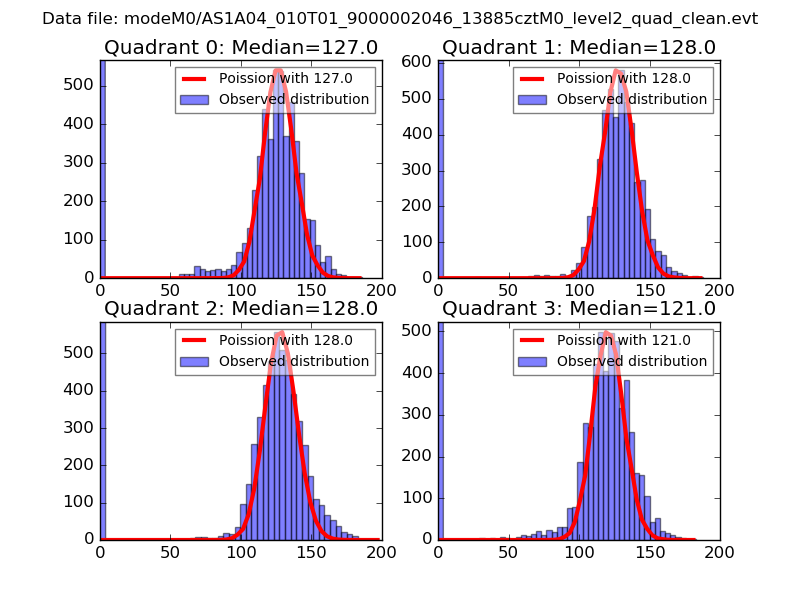 |
 |
| Quadrant-wise count rates Data is divided into 100 sec bins |
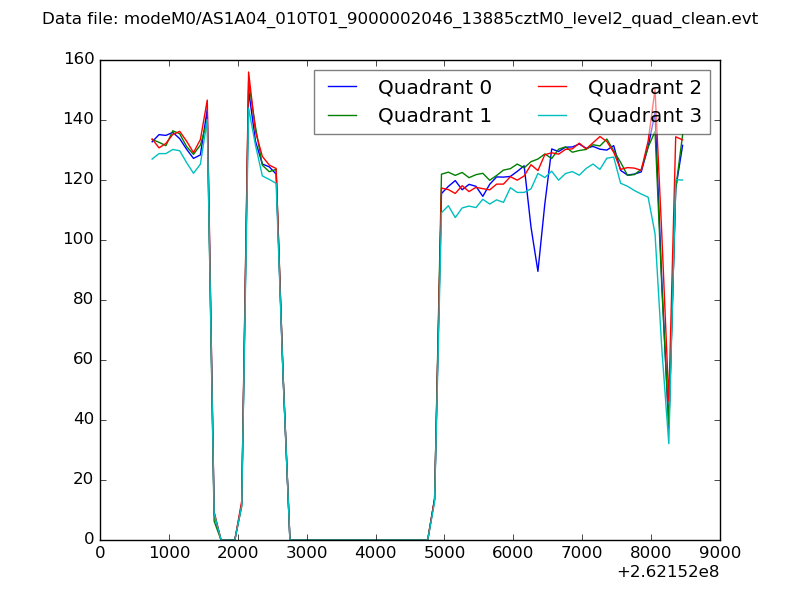 |
|
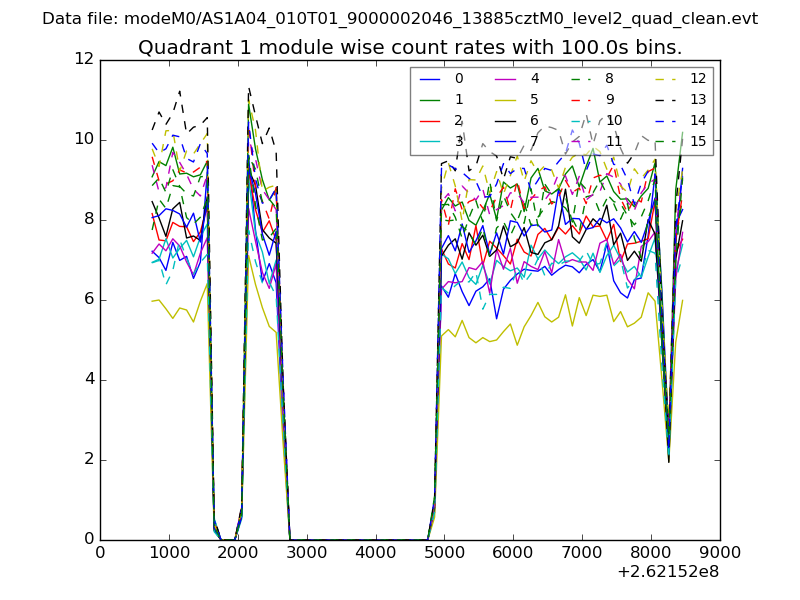
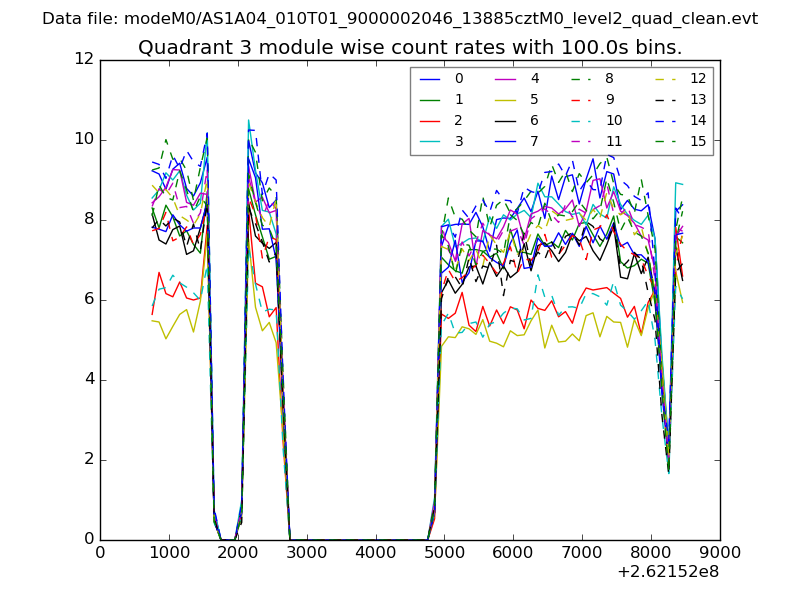
| Module-wise count rates for Quadrant A Data is divided into 100 sec bins |
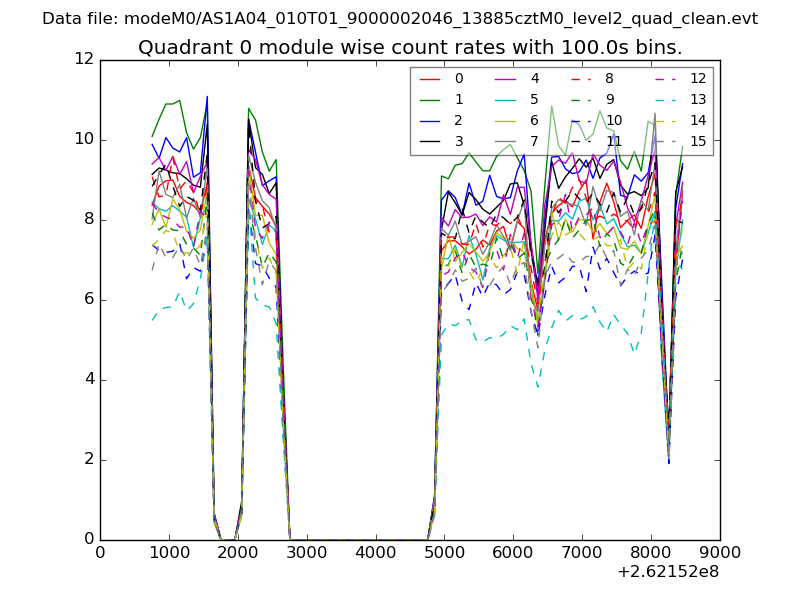 |
 |
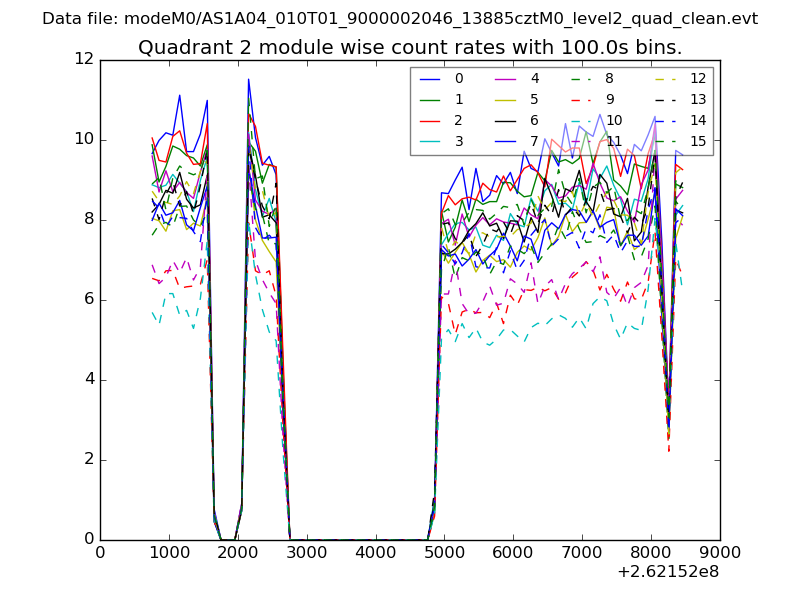
| Module-wise count rates for Quadrant B Data is divided into 100 sec bins |
 |
 |
| Module-wise count rates for Quadrant C Data is divided into 100 sec bins |
 |
 |
| Module-wise count rates for Quadrant D Data is divided into 100 sec bins |
 |
 |
| Parameter | Plot |
|---|---|
| CZT HV Monitor | 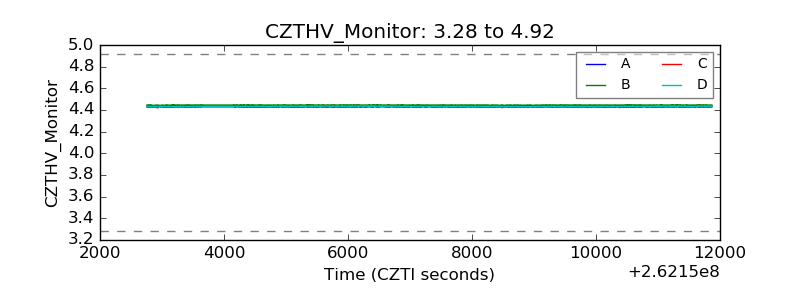 |
| D_VDD | 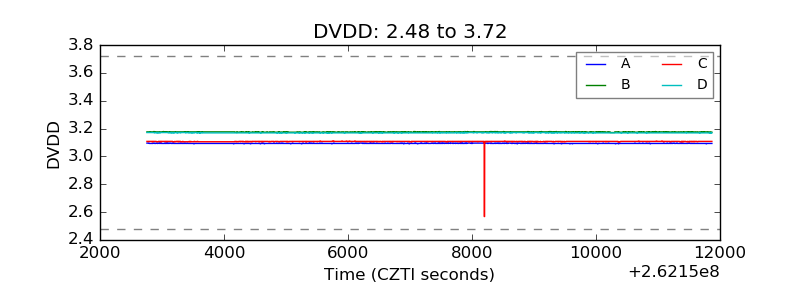 |
| Temperature 1 | 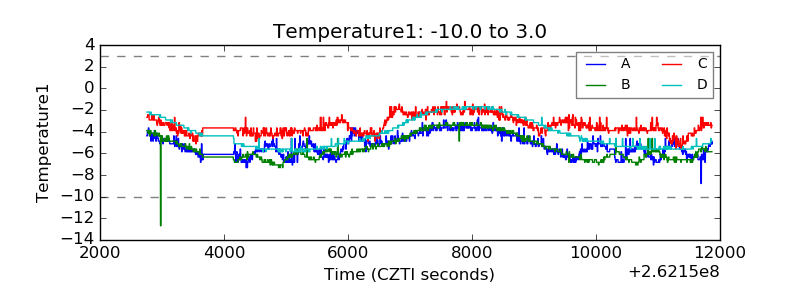 |
| Veto HV Monitor | 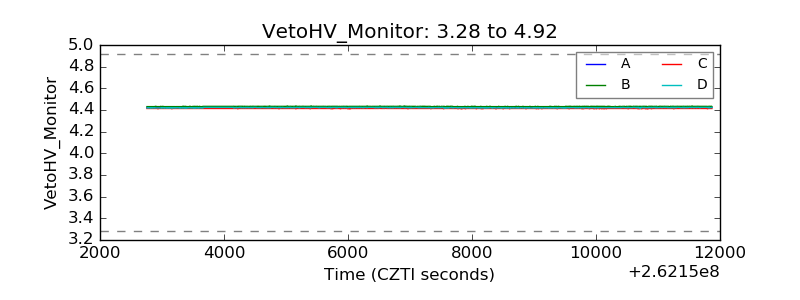 |
| Veto LLD | 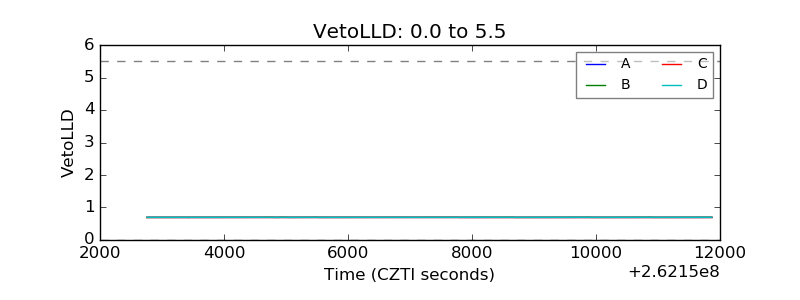 |
| Alpha Counter | 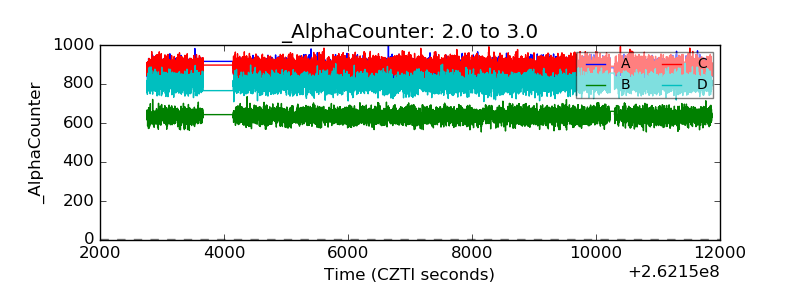 |
| _CPM_Rate | 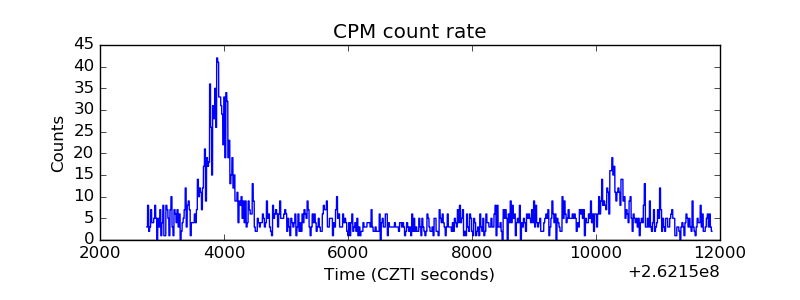 |
| CZT Counter | 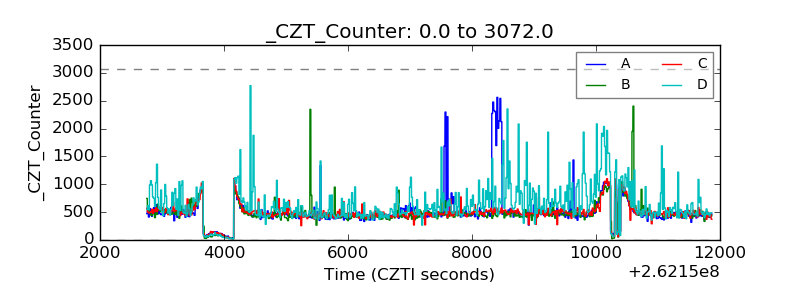 |
| +2.5 Volts monitor | 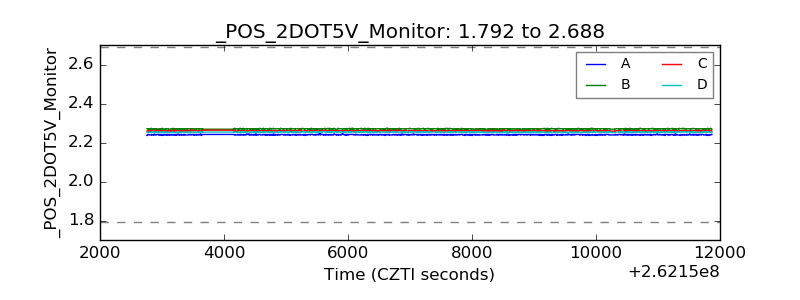 |
| +5 Volts monitor | 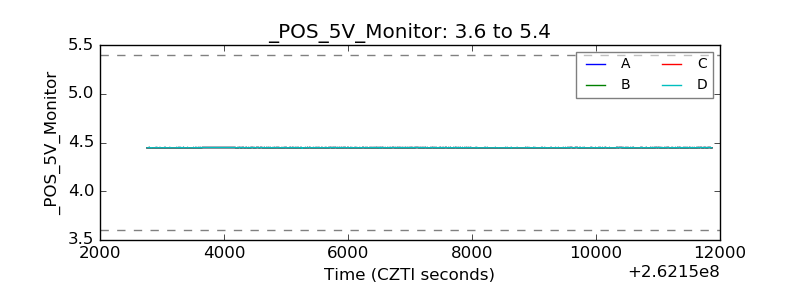 |
| _ROLL_ROT | 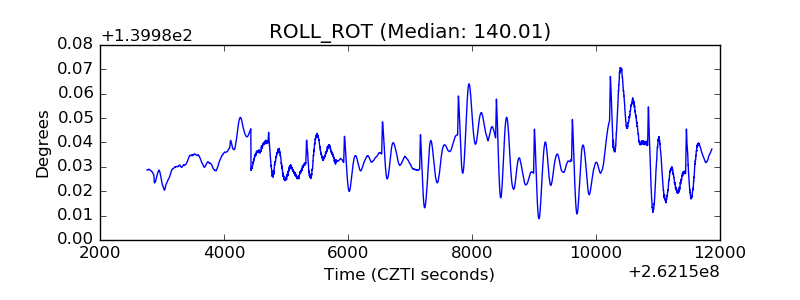 |
| _Roll_DEC |  |
| _Roll_RA | 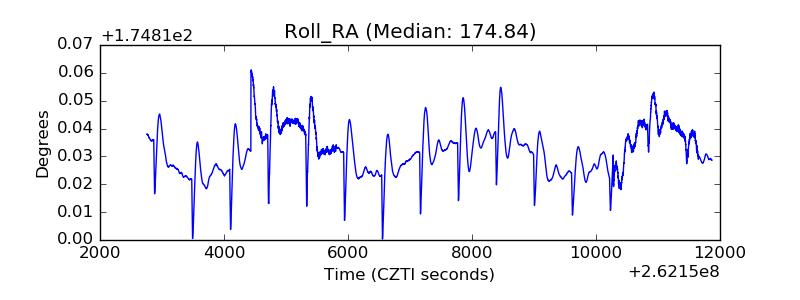 |
| Veto Counter | 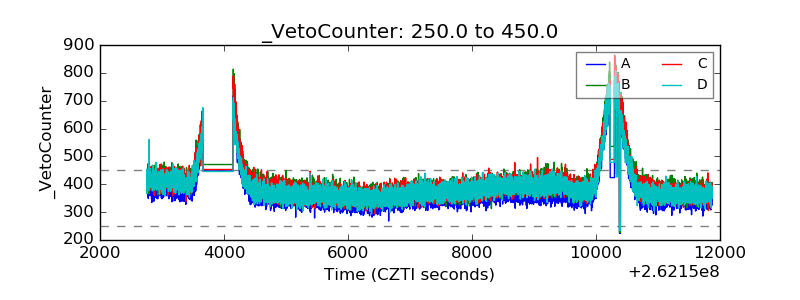 |