| Param | Original file | Final file |
|---|---|---|
| Filename | modeM0/AS1A04_010T01_9000002046_13886cztM0_level2.evt | modeM0/AS1A04_010T01_9000002046_13886cztM0_level2_quad_clean.evt |
| Size (bytes) | 601,715,520 | 79,404,480 |
| Size | 573.8 MB | 75.7 MB |
| Events in quadrant A | 3,994,827 | 468,858 |
| Events in quadrant B | 3,828,168 | 479,992 |
| Events in quadrant C | 3,738,683 | 479,312 |
| Events in quadrant D | 6,141,335 | 442,576 |
| Mode M9 | |||
|---|---|---|---|
| Quadrant | BADHDUFLAG | Total packets | Discarded packets |
| A | 0 | 4 | 0 |
| B | 0 | 4 | 0 |
| C | 0 | 4 | 0 |
| D | 0 | 4 | 0 |
| Mode SS | |||
|---|---|---|---|
| Quadrant | BADHDUFLAG | Total packets | Discarded packets |
| A | 0 | 158 | 0 |
| B | 0 | 158 | 0 |
| C | 0 | 158 | 0 |
| D | 0 | 158 | 0 |
| Mode M0 | |||
|---|---|---|---|
| Quadrant | BADHDUFLAG | Total packets | Discarded packets |
| A | 0 | 17050 | 3 |
| B | 0 | 16357 | 2 |
| C | 0 | 16125 | 2 |
| D | 0 | 23367 | 2 |
| Quadrant | Total seconds | Saturated seconds | Saturation percentage |
|---|---|---|---|
| A | 7663 | 334 | 4.358606% |
| B | 7663 | 329 | 4.293358% |
| C | 7663 | 196 | 2.557745% |
| D | 7663 | 542 | 7.072948% |
Noise dominated data is calculated using 1-second bins in cleaned event files. If a bin has >2000 counts, and if more than 50% of those come from <1% of pixels, then it is considered to be noise-dominated and hence unusable.
| Quadrant | # 1 sec bins | Bins with >0 counts | Bins with >2000 counts | High rate bins dominated by noise | Noise dominated (total time) | Noise dominated (detector-on time) | Marked lightcurve |
|---|---|---|---|---|---|---|---|
| A | 8064 | 7664 | 64 | 64 | 0.79% | 0.84% | 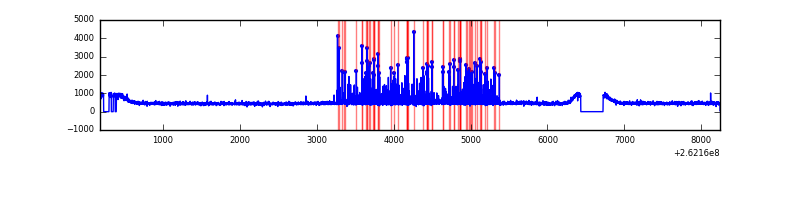 |
| B | 8064 | 7664 | 32 | 32 | 0.40% | 0.42% | 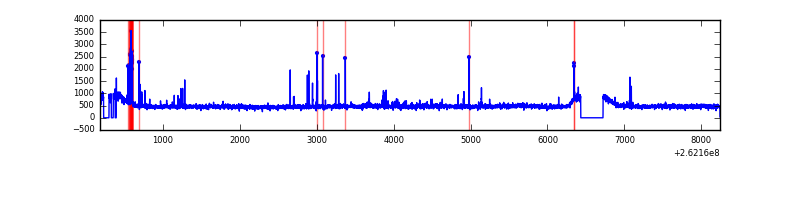 |
| C | 8064 | 7664 | 4 | 4 | 0.05% | 0.05% | 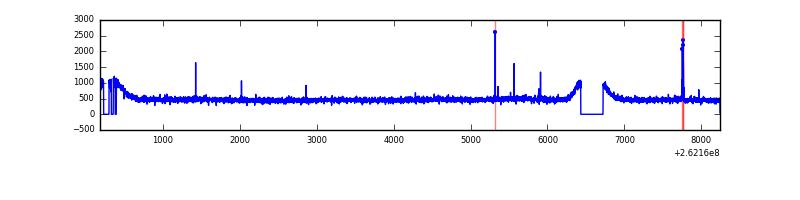 |
| D | 8064 | 7664 | 305 | 305 | 3.78% | 3.98% | 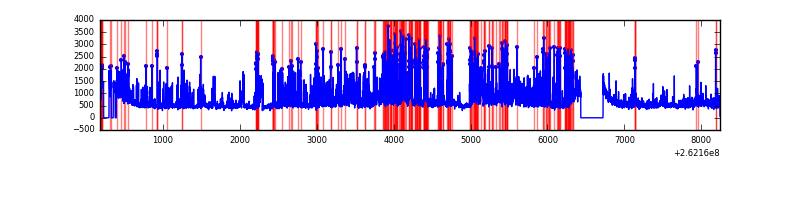 |
Top three noisy pixels from each quadrant. If the there are fewer than three noisy pixels in the level2.evt file, extra rows are filled as -1
| Pixel properties | Quadrant properties | ||||||
|---|---|---|---|---|---|---|---|
| Quadrant | DetID | PixID | Counts | Sigma | Mean | Median | Sigma |
| A | 0 | 23 | 363702 | 1886.69 | 933 | 909 | 192.3 |
| A | 0 | 226 | 29910 | 150.82 | 933 | 909 | 192.3 |
| A | 1 | 162 | 12233 | 58.89 | 933 | 909 | 192.3 |
| B | 4 | 80 | 112909 | 611.88 | 930 | 907 | 183.0 |
| B | 4 | 173 | 37472 | 199.76 | 930 | 907 | 183.0 |
| B | 3 | 209 | 26649 | 140.63 | 930 | 907 | 183.0 |
| C | 3 | 233 | 148248 | 685.57 | 913 | 917 | 214.9 |
| C | 14 | 234 | 22283 | 99.42 | 913 | 917 | 214.9 |
| C | 12 | 4 | 11019 | 47.01 | 913 | 917 | 214.9 |
| D | 1 | 52 | 1885591 | 8801.9 | 886 | 862 | 214.1 |
| D | 13 | 122 | 294905 | 1373.21 | 886 | 862 | 214.1 |
| D | 8 | 195 | 244140 | 1136.14 | 886 | 862 | 214.1 |
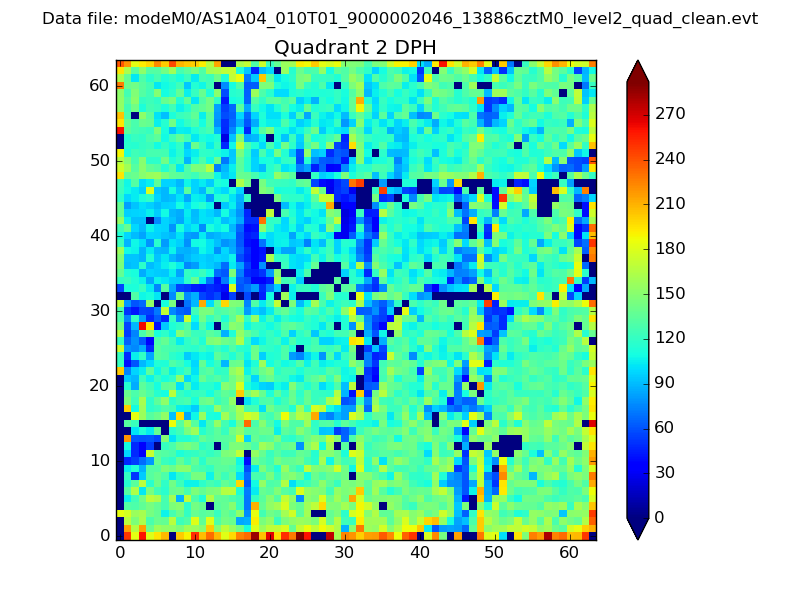
Histogram calculated using DETX and DETY for each event in the final _common_clean file
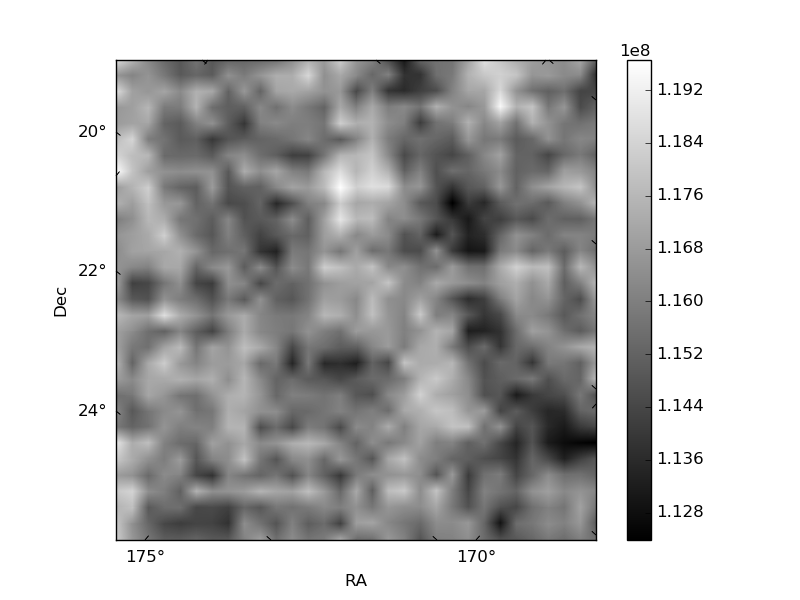
| Quadrant A | 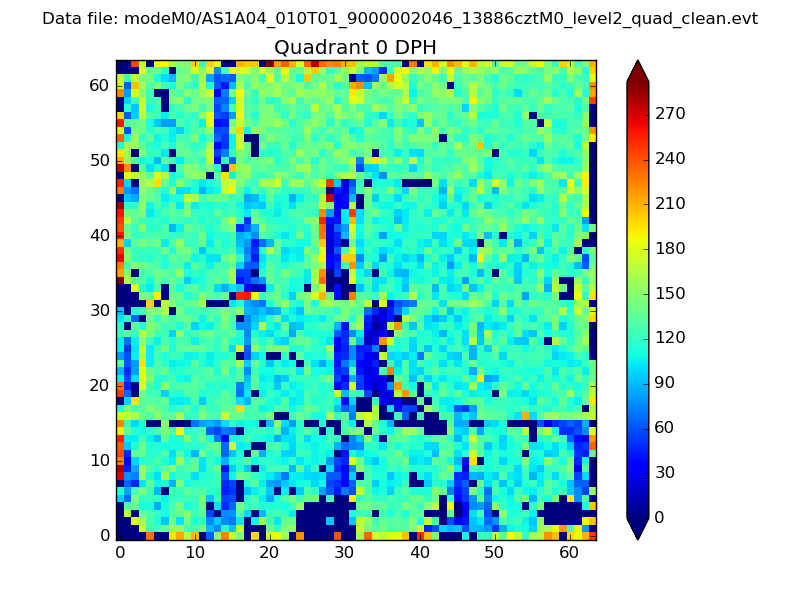 |
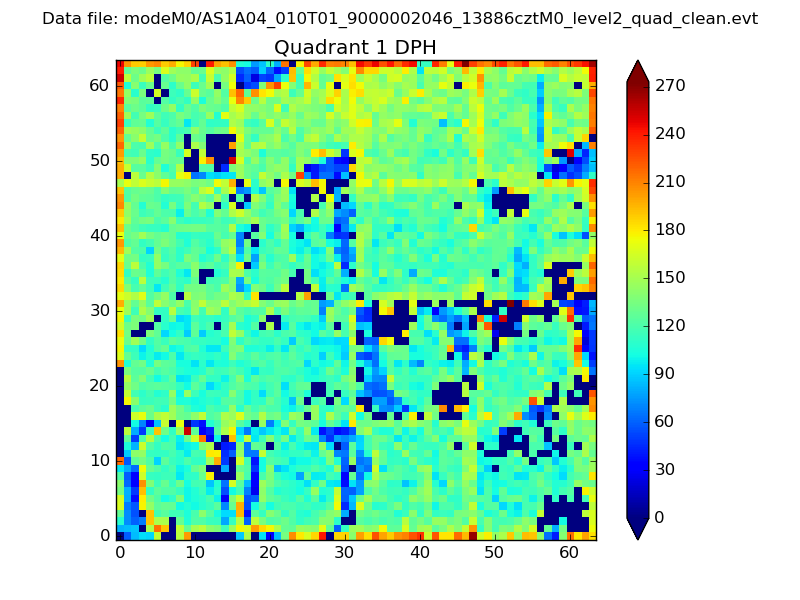 |
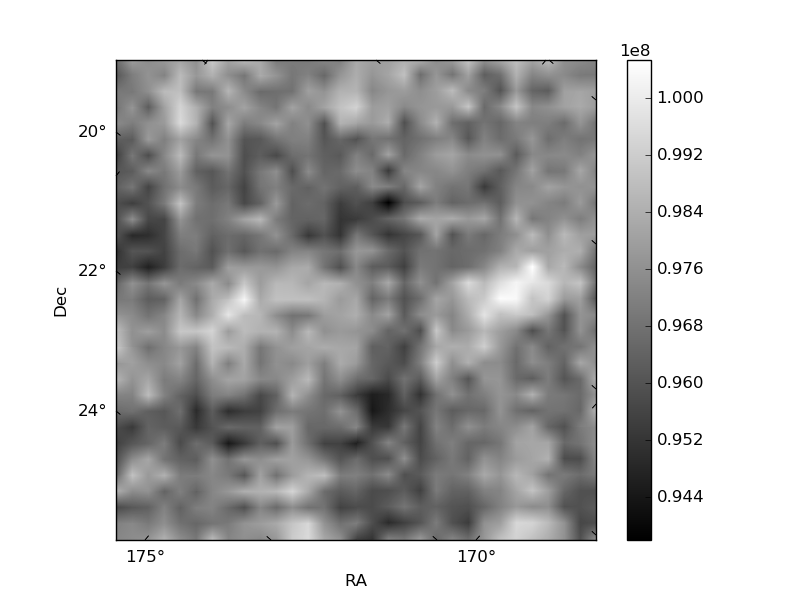
Quadrant B |
|---|---|---|---|
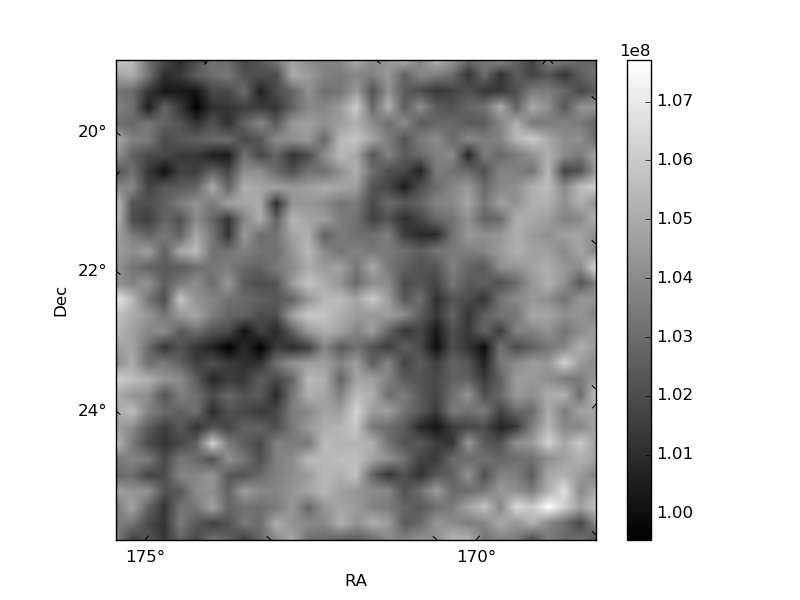
| Quadrant D | 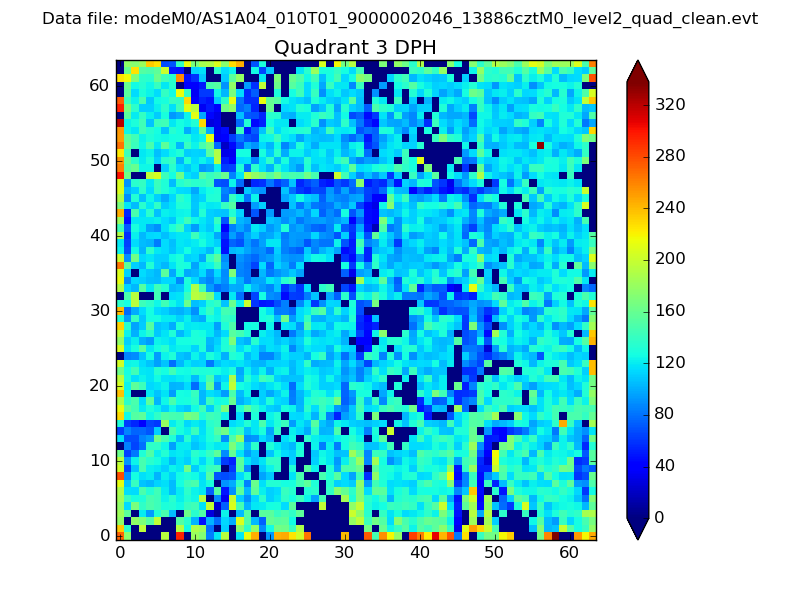 |
 |
Quadrant C |
| Plot type | Count rate plots | Images |
|---|---|---|
| Comparison with Poisson distribution Blue bars denote a histogram of data divided into 1 sec bins. Red curve is a Poisson curve with rate = median count rate of data. |
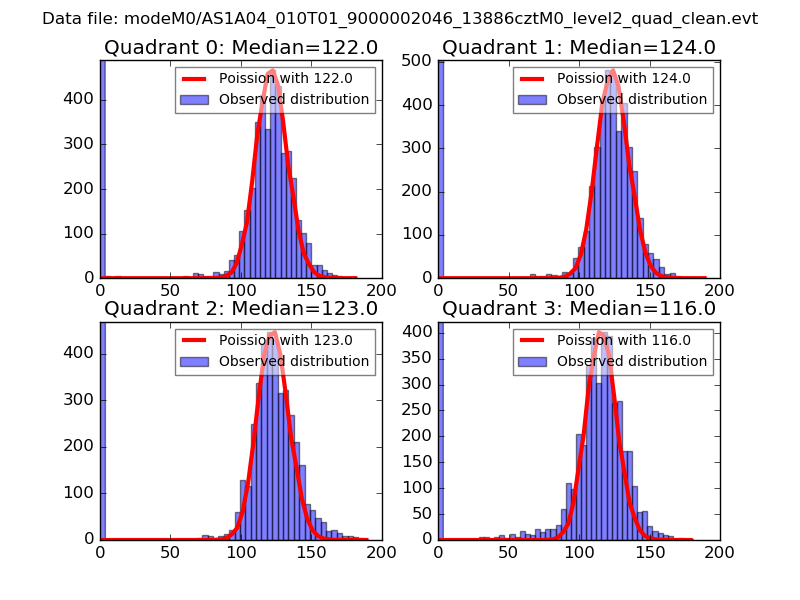 |
 |
| Quadrant-wise count rates Data is divided into 100 sec bins |
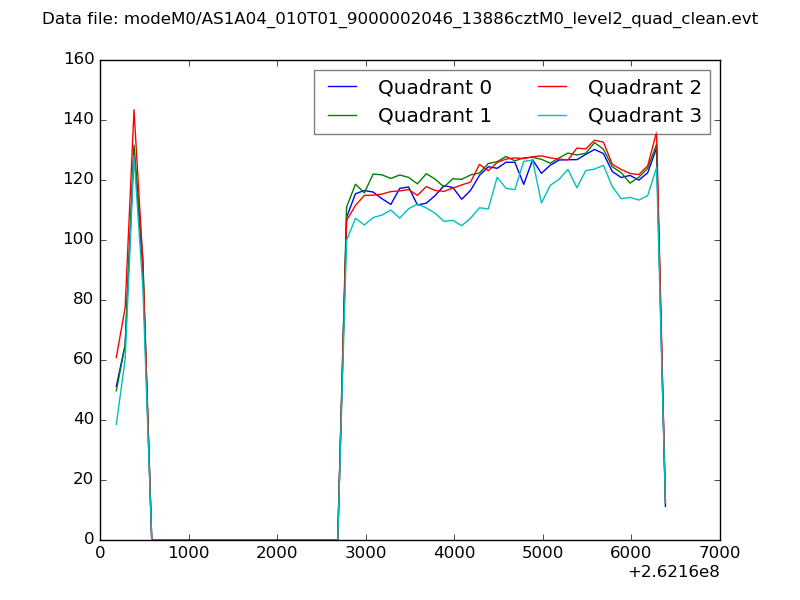 |
|
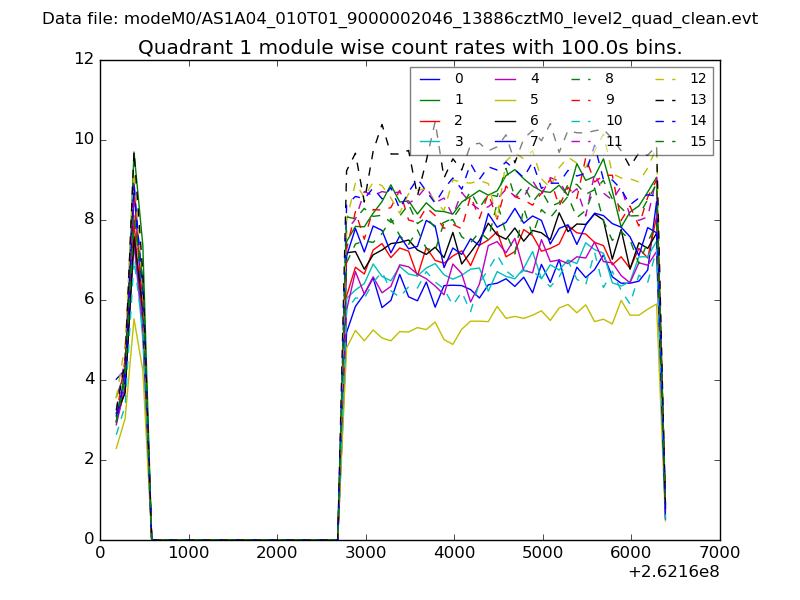
| Module-wise count rates for Quadrant A Data is divided into 100 sec bins |
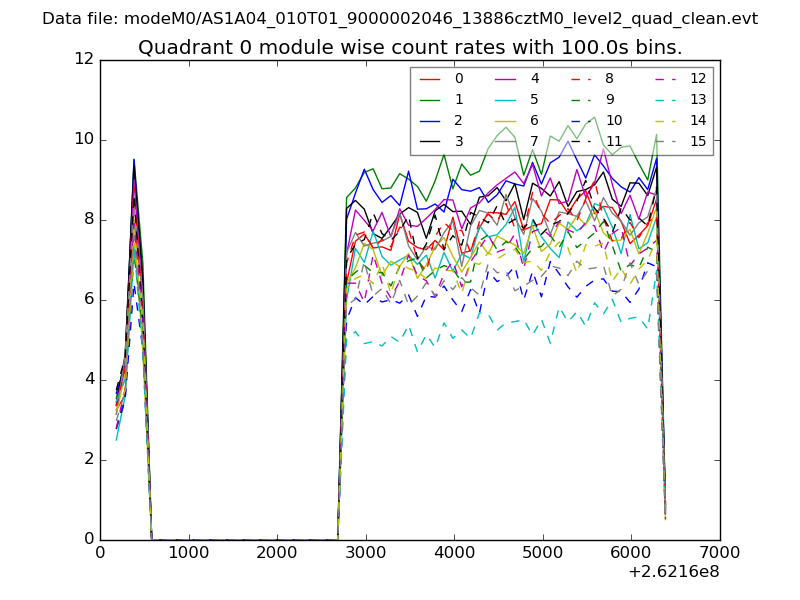 |
 |
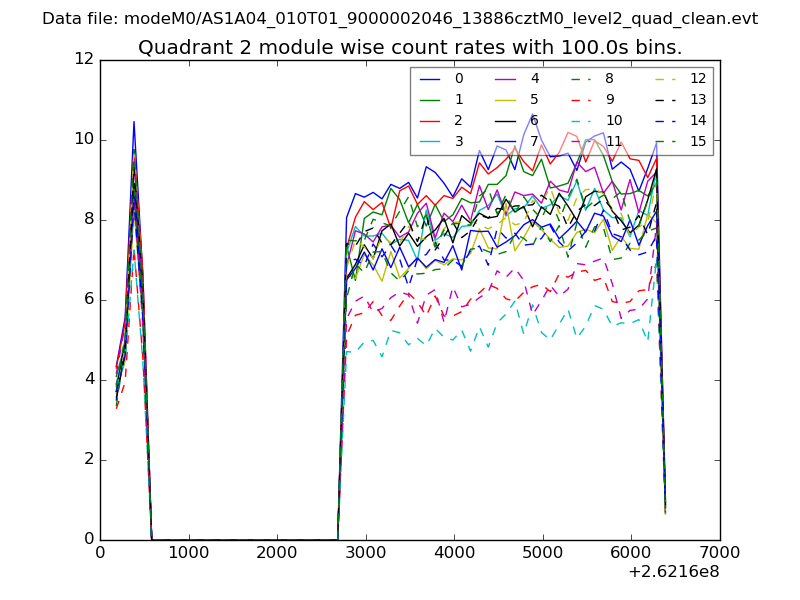
| Module-wise count rates for Quadrant B Data is divided into 100 sec bins |
 |
 |
| Module-wise count rates for Quadrant C Data is divided into 100 sec bins |
 |
 |
| Module-wise count rates for Quadrant D Data is divided into 100 sec bins |
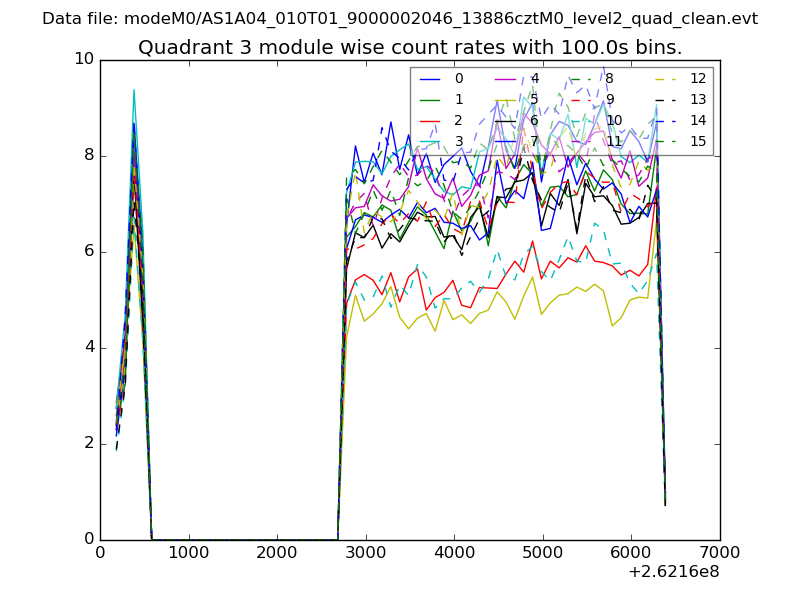 |
 |
| Parameter | Plot |
|---|---|
| CZT HV Monitor | 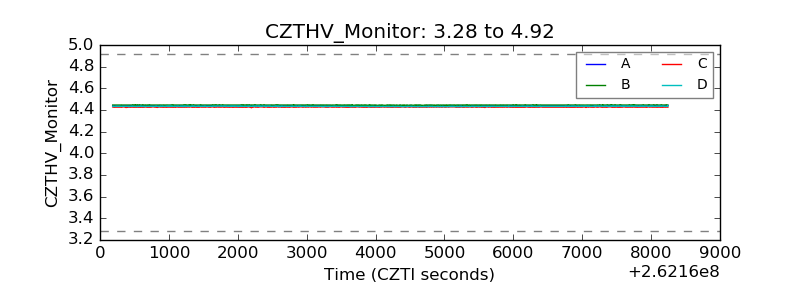 |
| D_VDD | 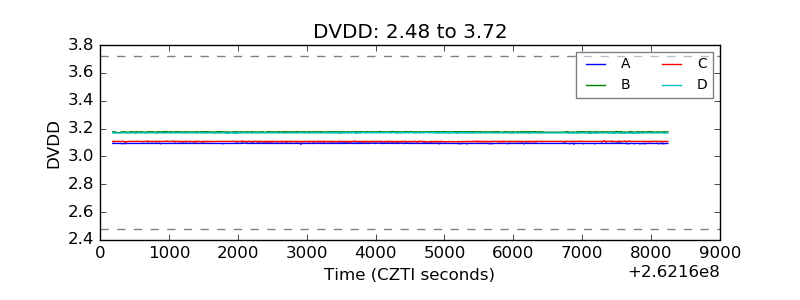 |
| Temperature 1 | 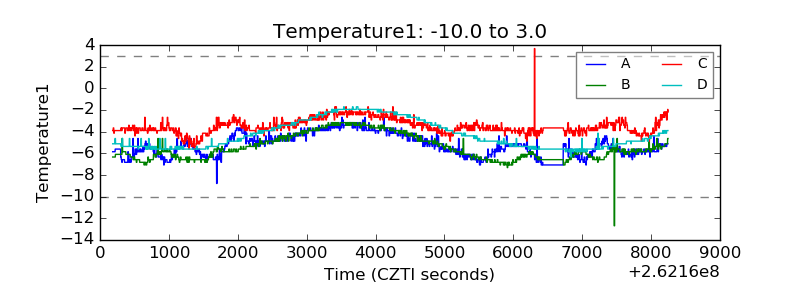 |
| Veto HV Monitor | 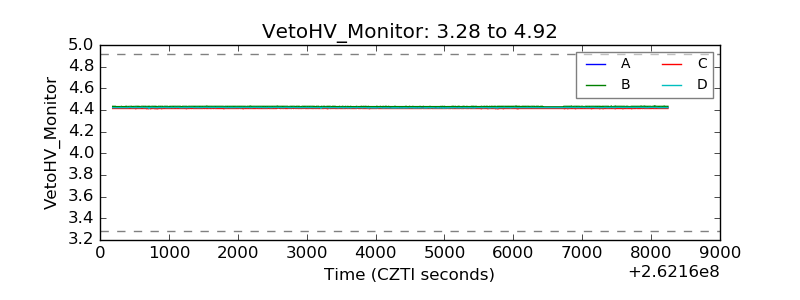 |
| Veto LLD | 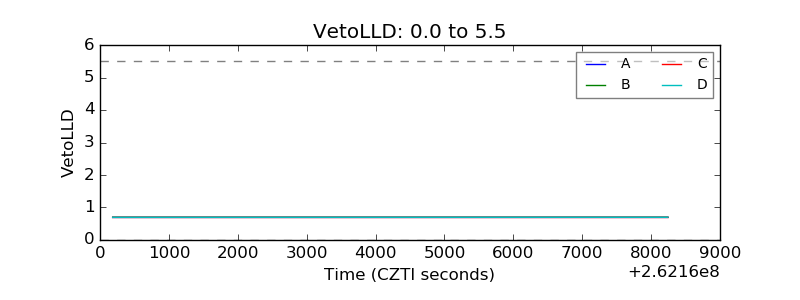 |
| Alpha Counter | 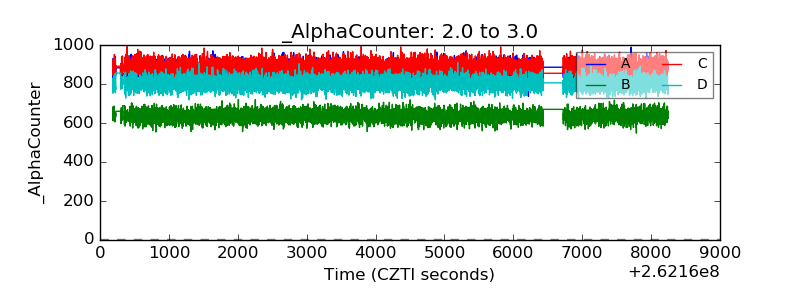 |
| _CPM_Rate |  |
| CZT Counter | 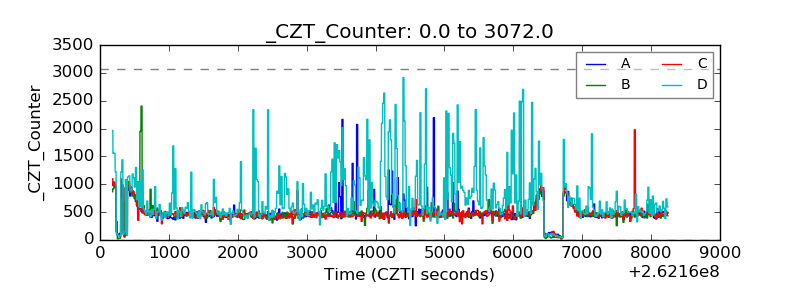 |
| +2.5 Volts monitor |  |
| +5 Volts monitor |  |
| _ROLL_ROT | 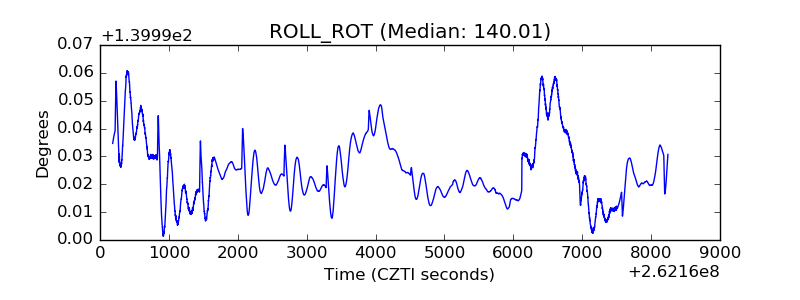 |
| _Roll_DEC | 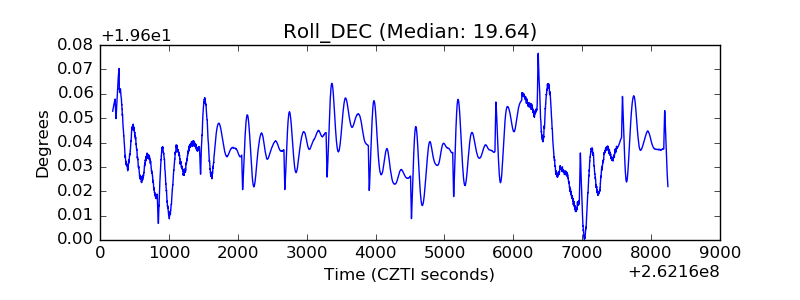 |
| _Roll_RA | 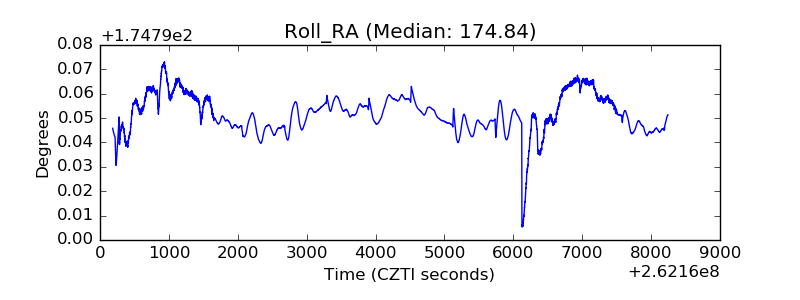 |
| Veto Counter | 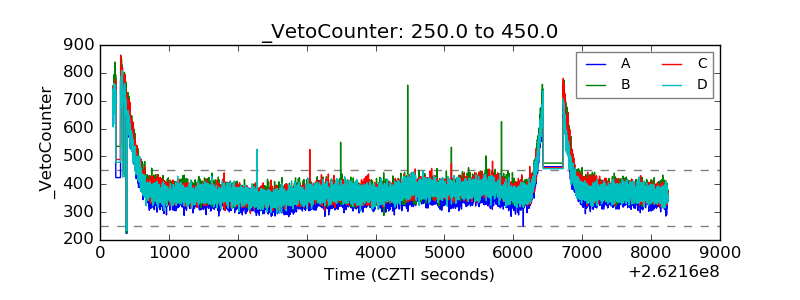 |