| Param | Original file | Final file |
|---|---|---|
| Filename | modeM0/AS1A04_010T01_9000002046_13889cztM0_level2.evt | modeM0/AS1A04_010T01_9000002046_13889cztM0_level2_quad_clean.evt |
| Size (bytes) | 1,444,901,760 | 241,879,680 |
| Size | 1.3 GB | 230.7 MB |
| Events in quadrant A | 9,058,361 | 1,524,218 |
| Events in quadrant B | 9,378,830 | 1,531,096 |
| Events in quadrant C | 9,173,699 | 1,514,526 |
| Events in quadrant D | 14,840,613 | 1,422,671 |
| Mode M9 | |||
|---|---|---|---|
| Quadrant | BADHDUFLAG | Total packets | Discarded packets |
| A | 0 | 22 | 0 |
| B | 0 | 22 | 0 |
| C | 0 | 22 | 0 |
| D | 0 | 22 | 0 |
| Mode SS | |||
|---|---|---|---|
| Quadrant | BADHDUFLAG | Total packets | Discarded packets |
| A | 0 | 396 | 0 |
| B | 0 | 396 | 0 |
| C | 0 | 396 | 0 |
| D | 0 | 396 | 0 |
| Mode M0 | |||
|---|---|---|---|
| Quadrant | BADHDUFLAG | Total packets | Discarded packets |
| A | 0 | 39609 | 5 |
| B | 0 | 40322 | 4 |
| C | 0 | 39698 | 4 |
| D | 0 | 56945 | 4 |
| Quadrant | Total seconds | Saturated seconds | Saturation percentage |
|---|---|---|---|
| A | 19352 | 313 | 1.617404% |
| B | 19352 | 386 | 1.994626% |
| C | 19352 | 228 | 1.178173% |
| D | 19352 | 1315 | 6.795163% |
Noise dominated data is calculated using 1-second bins in cleaned event files. If a bin has >2000 counts, and if more than 50% of those come from <1% of pixels, then it is considered to be noise-dominated and hence unusable.
| Quadrant | # 1 sec bins | Bins with >0 counts | Bins with >2000 counts | High rate bins dominated by noise | Noise dominated (total time) | Noise dominated (detector-on time) | Marked lightcurve |
|---|---|---|---|---|---|---|---|
| A | 21558 | 19354 | 0 | 0 | 0.00% | 0.00% | 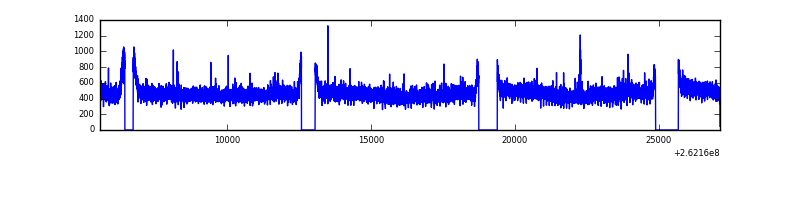 |
| B | 21558 | 19353 | 35 | 35 | 0.16% | 0.18% | 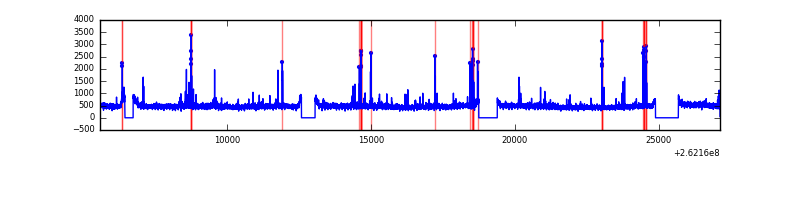 |
| C | 21558 | 19353 | 5 | 5 | 0.02% | 0.03% | 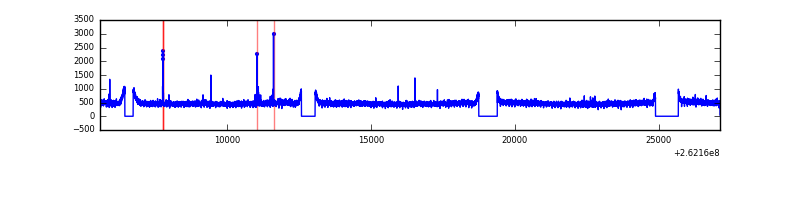 |
| D | 21558 | 19353 | 1032 | 1032 | 4.79% | 5.33% | 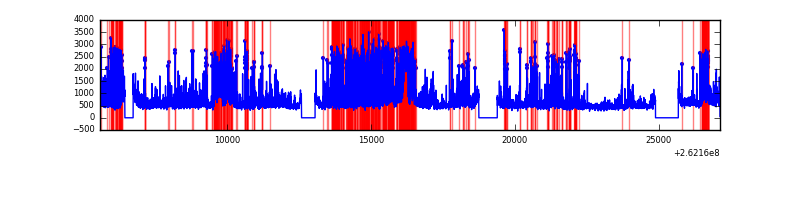 |
Top three noisy pixels from each quadrant. If the there are fewer than three noisy pixels in the level2.evt file, extra rows are filled as -1
| Pixel properties | Quadrant properties | ||||||
|---|---|---|---|---|---|---|---|
| Quadrant | DetID | PixID | Counts | Sigma | Mean | Median | Sigma |
| A | 0 | 23 | 84601 | 176.47 | 2314 | 2260 | 466.6 |
| A | 1 | 162 | 39448 | 79.7 | 2314 | 2260 | 466.6 |
| A | 0 | 226 | 25963 | 50.8 | 2314 | 2260 | 466.6 |
| B | 4 | 80 | 194851 | 433.67 | 2296 | 2233 | 444.2 |
| B | 3 | 209 | 59445 | 128.81 | 2296 | 2233 | 444.2 |
| B | 12 | 111 | 54878 | 118.53 | 2296 | 2233 | 444.2 |
| C | 3 | 233 | 351842 | 666.45 | 2250 | 2258 | 524.5 |
| C | 14 | 234 | 24878 | 43.12 | 2250 | 2258 | 524.5 |
| C | 0 | 207 | 23773 | 41.02 | 2250 | 2258 | 524.5 |
| D | 1 | 52 | 2916881 | 5569.13 | 2192 | 2136 | 523.4 |
| D | 5 | 222 | 1846072 | 3523.16 | 2192 | 2136 | 523.4 |
| D | 10 | 157 | 831567 | 1584.77 | 2192 | 2136 | 523.4 |
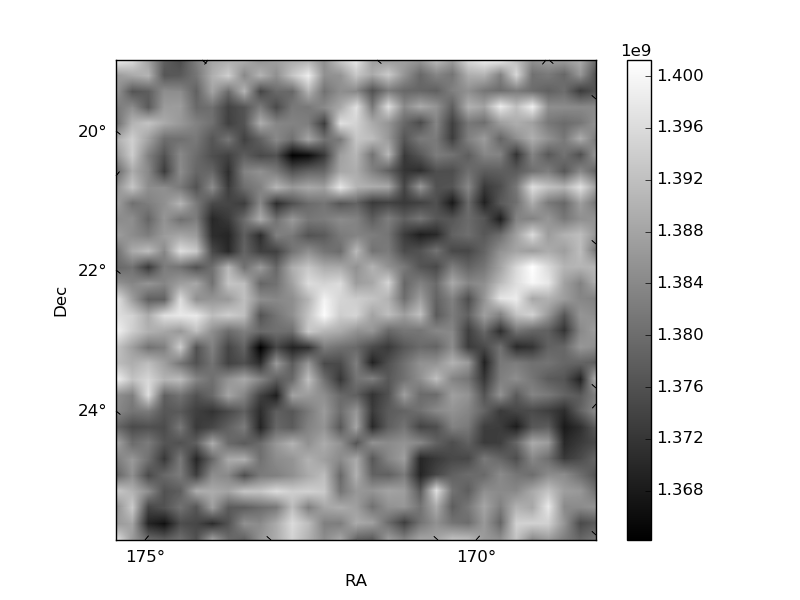
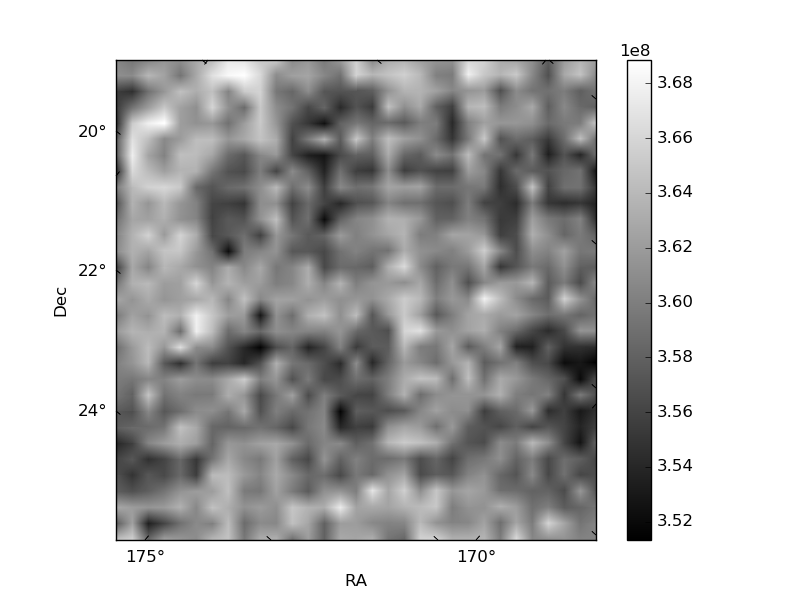
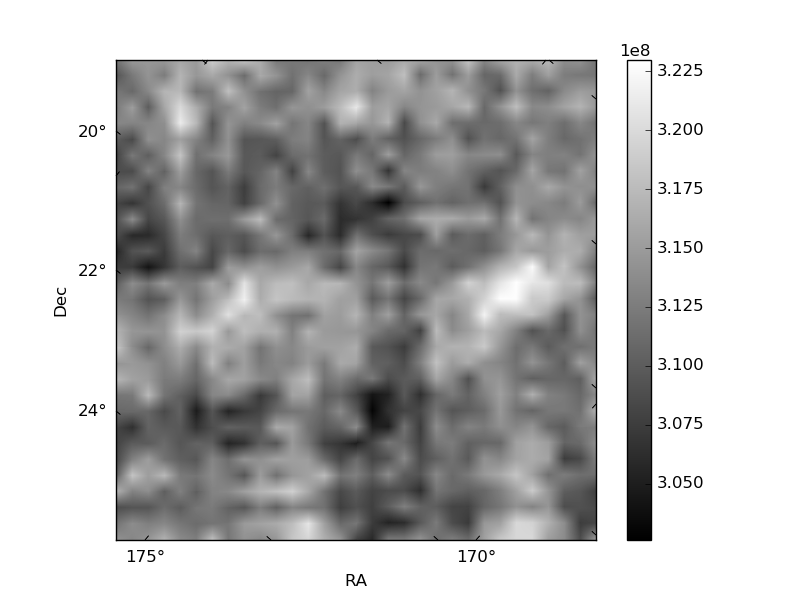
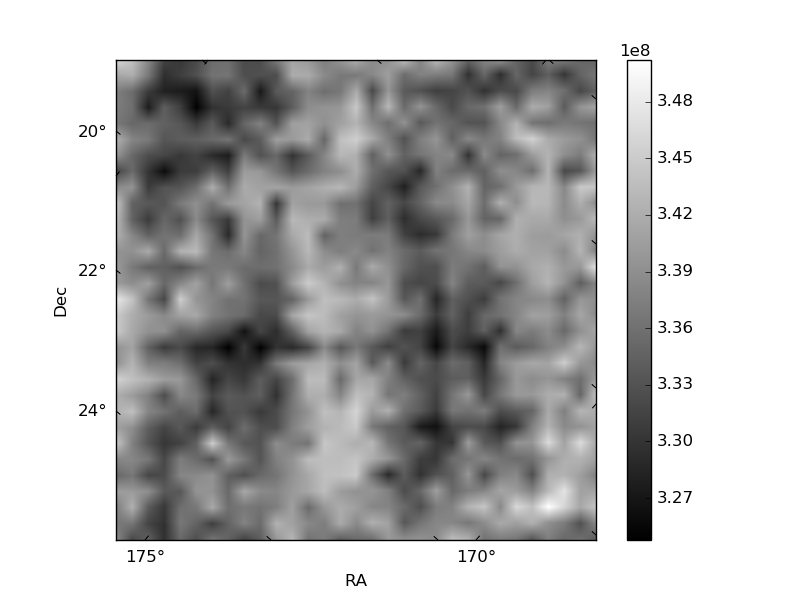
Histogram calculated using DETX and DETY for each event in the final _common_clean file
| Quadrant A | 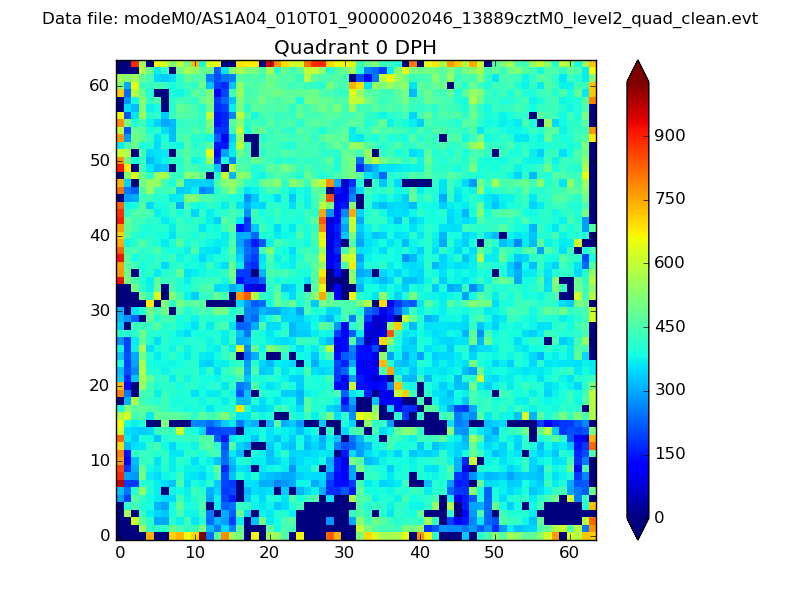 |
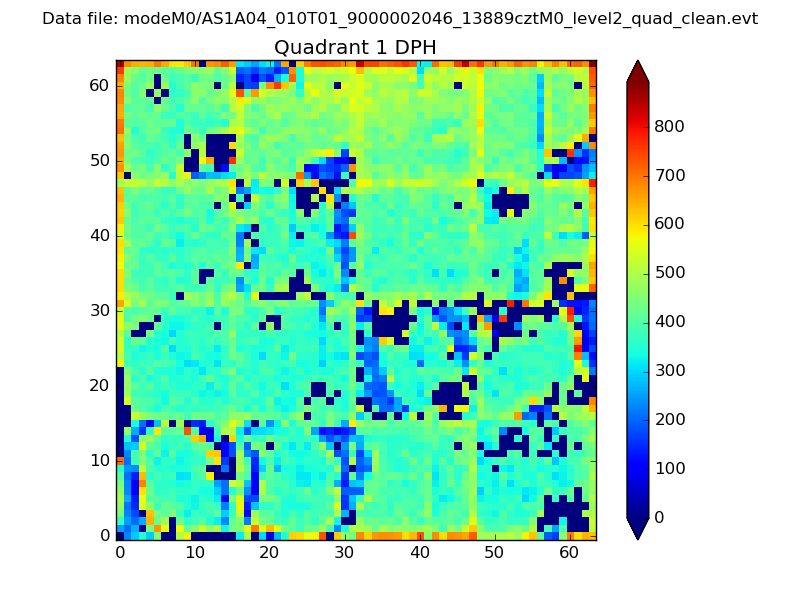 |
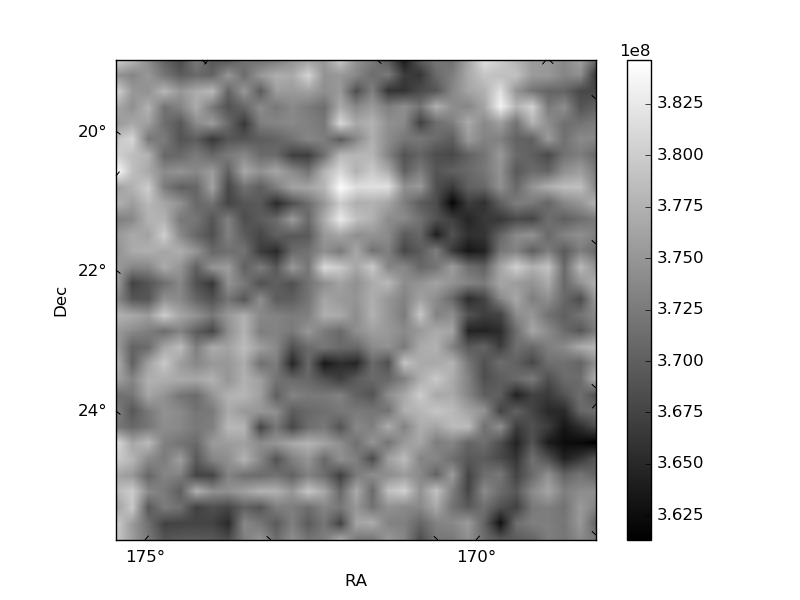
Quadrant B |
|---|---|---|---|
| Quadrant D | 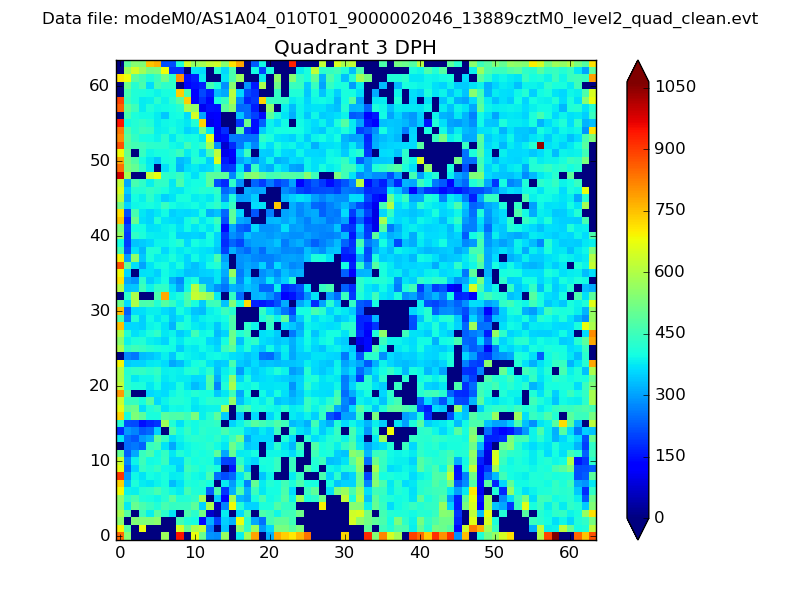 |
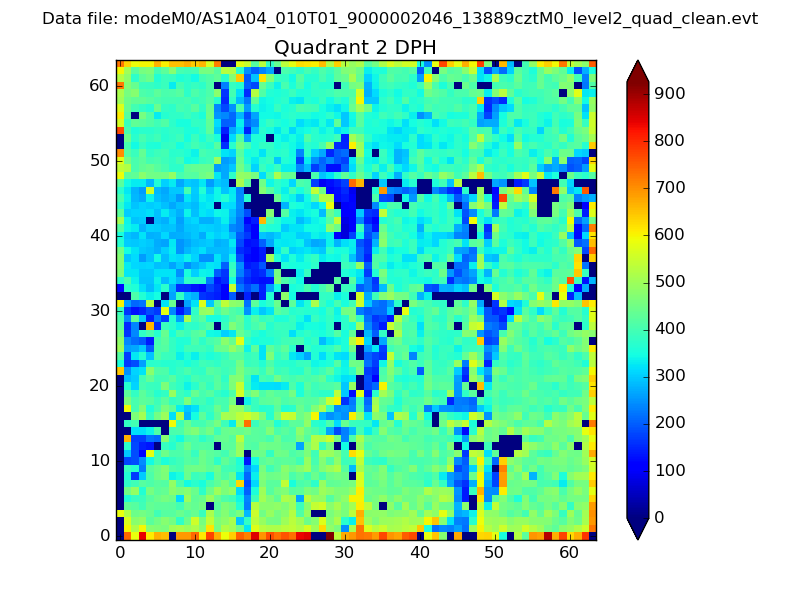 |
Quadrant C |
| Plot type | Count rate plots | Images |
|---|---|---|
| Comparison with Poisson distribution Blue bars denote a histogram of data divided into 1 sec bins. Red curve is a Poisson curve with rate = median count rate of data. |
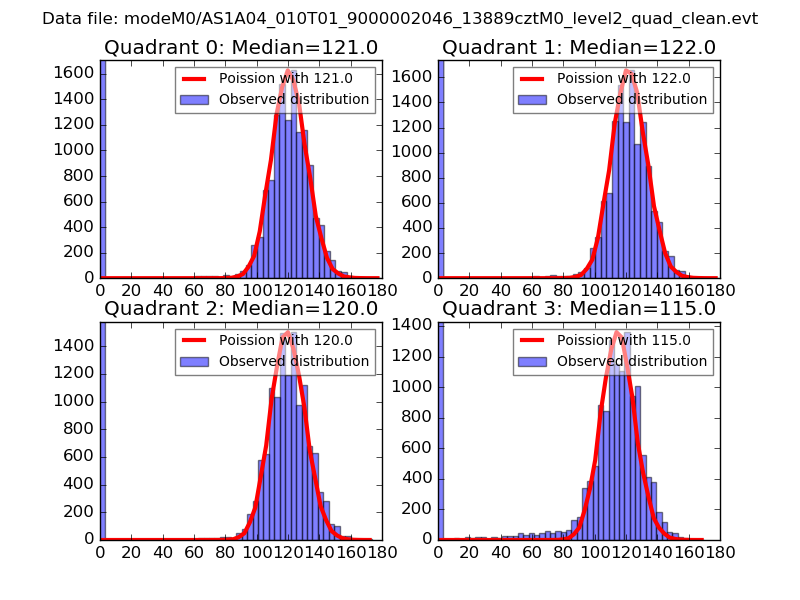 |
 |
| Quadrant-wise count rates Data is divided into 100 sec bins |
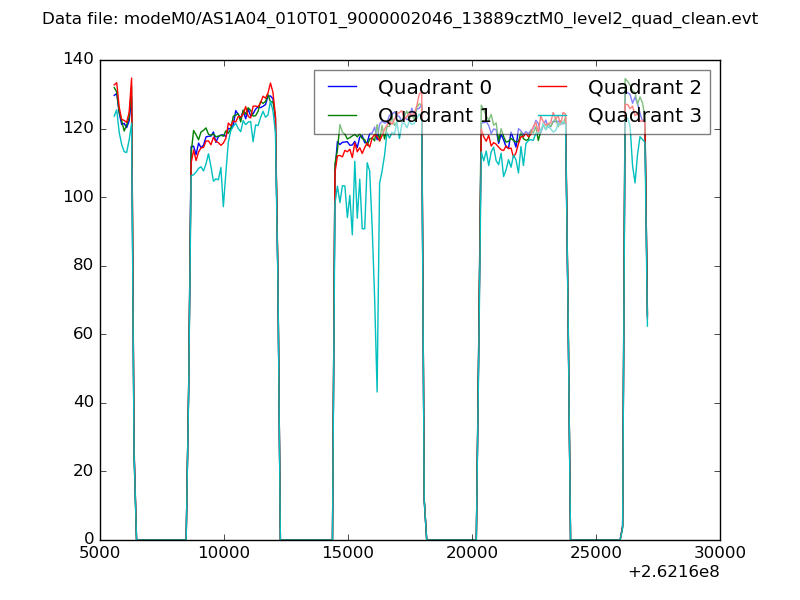 |
|
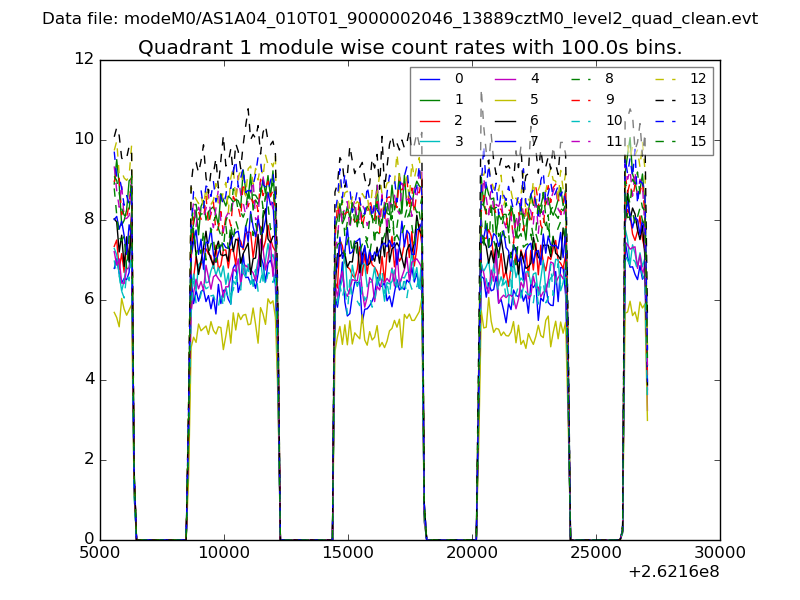
| Module-wise count rates for Quadrant A Data is divided into 100 sec bins |
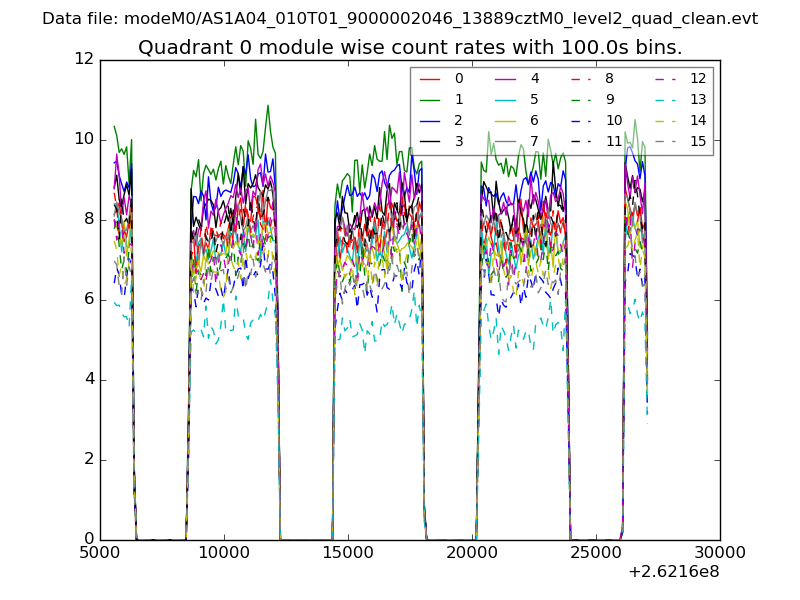 |
 |
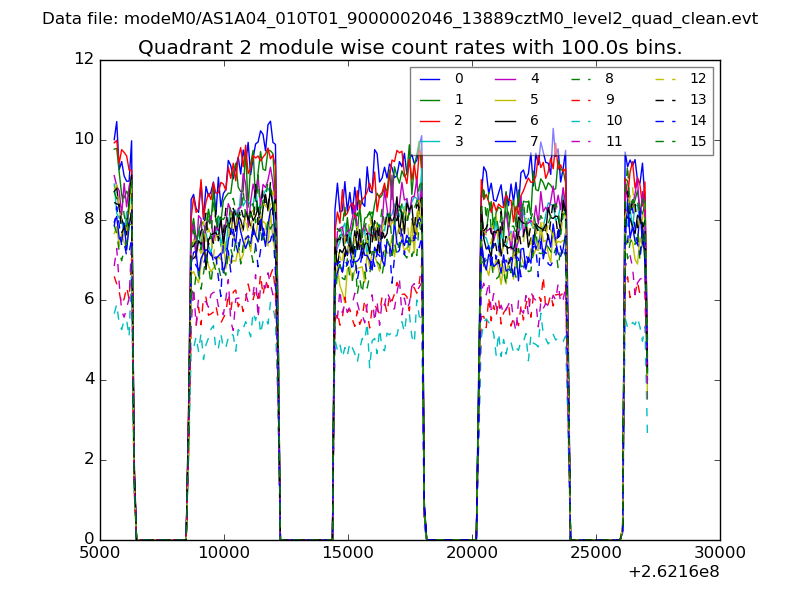
| Module-wise count rates for Quadrant B Data is divided into 100 sec bins |
 |
 |
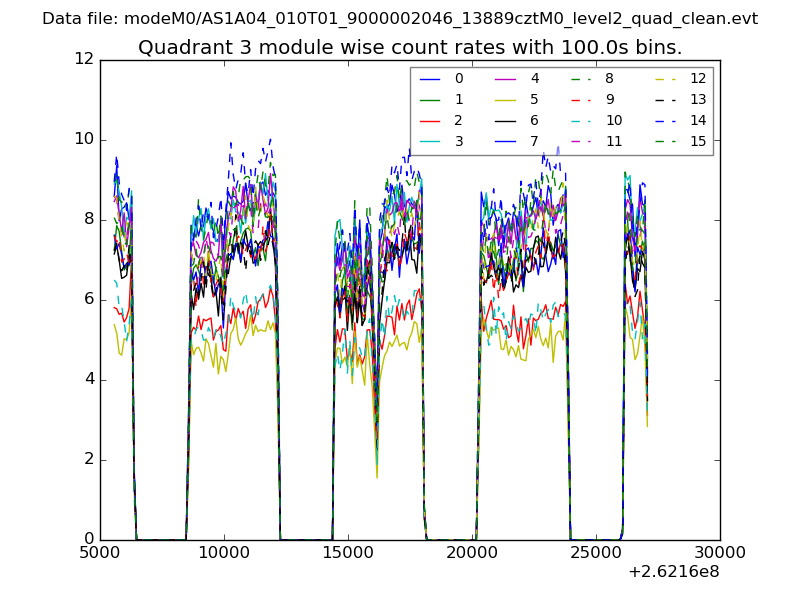
| Module-wise count rates for Quadrant C Data is divided into 100 sec bins |
 |
 |
| Module-wise count rates for Quadrant D Data is divided into 100 sec bins |
 |
 |
| Parameter | Plot |
|---|---|
| CZT HV Monitor | 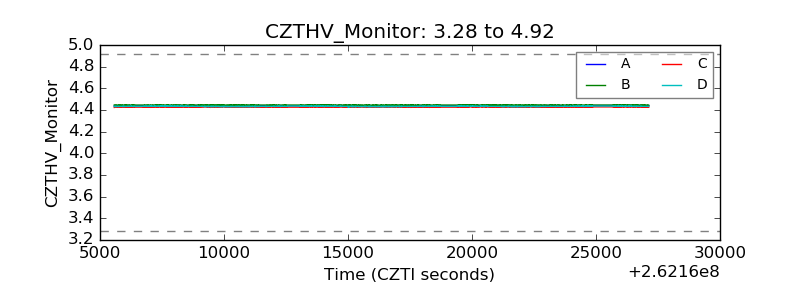 |
| D_VDD | 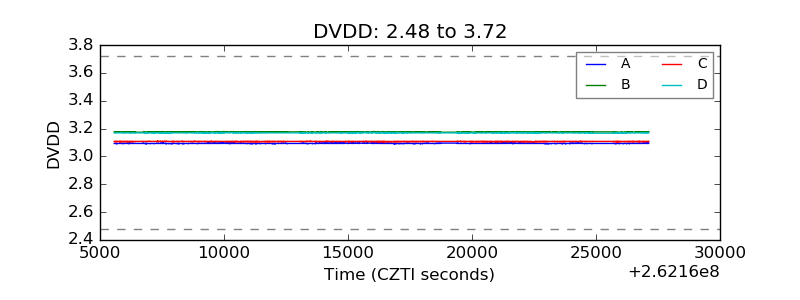 |
| Temperature 1 | 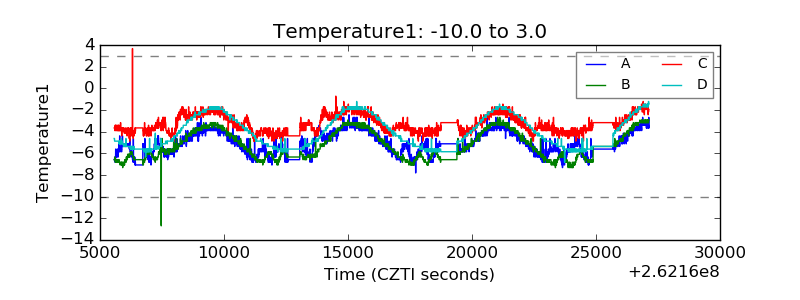 |
| Veto HV Monitor | 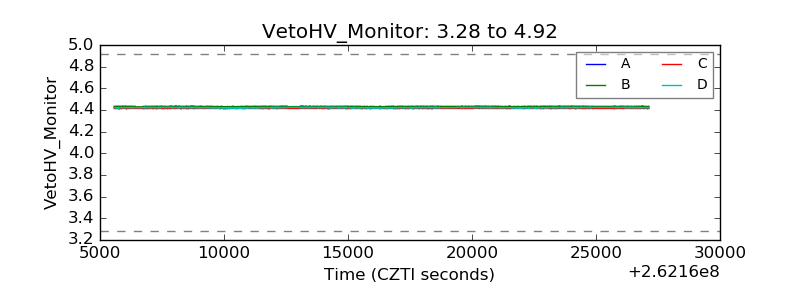 |
| Veto LLD | 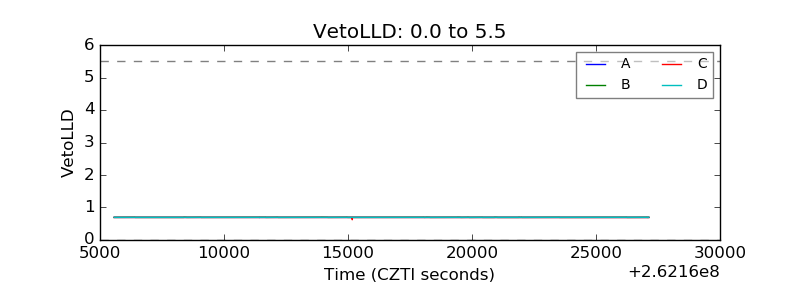 |
| Alpha Counter | 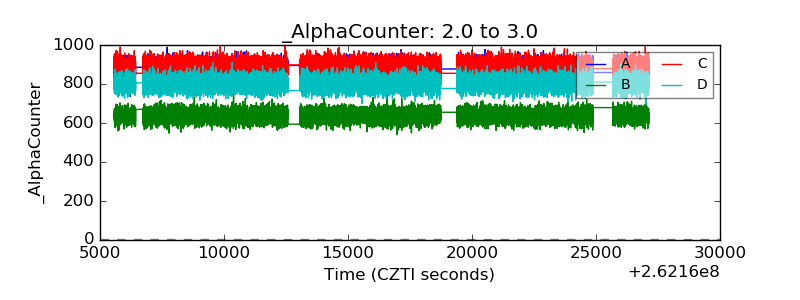 |
| _CPM_Rate | 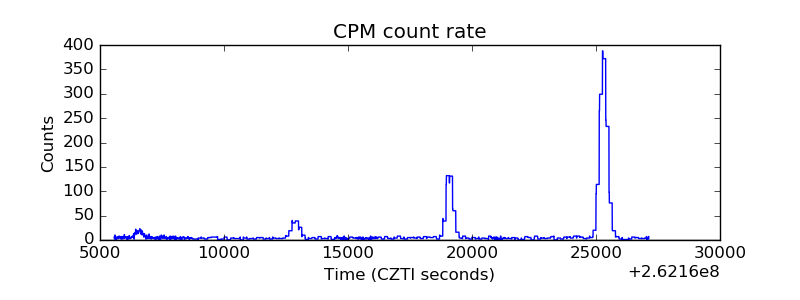 |
| CZT Counter | 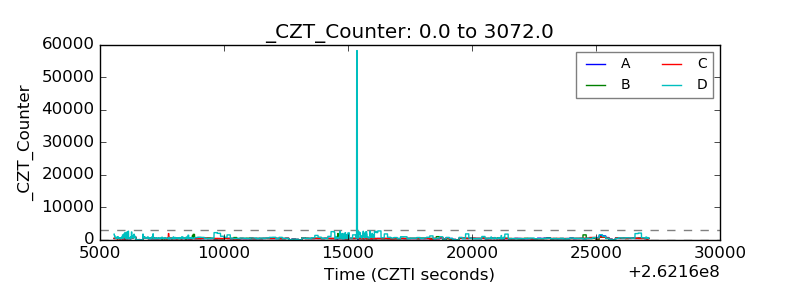 |
| +2.5 Volts monitor |  |
| +5 Volts monitor |  |
| _ROLL_ROT | 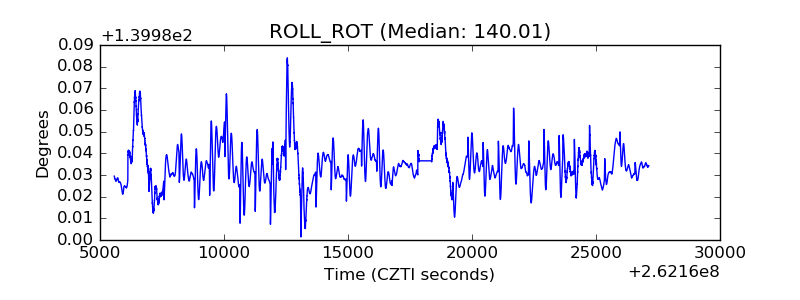 |
| _Roll_DEC | 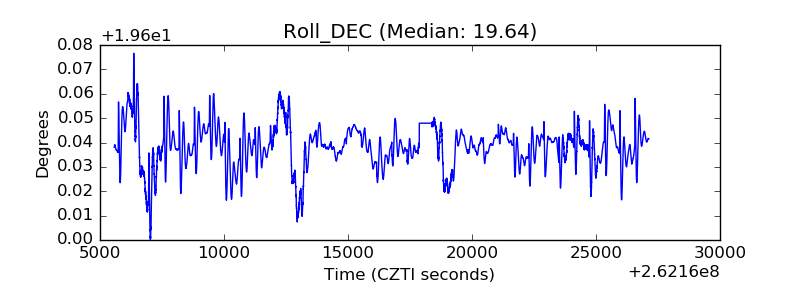 |
| _Roll_RA | 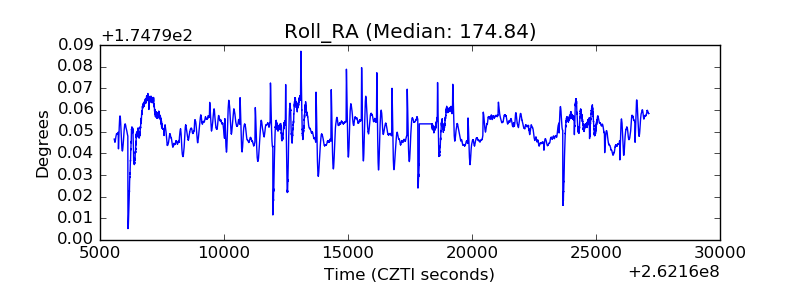 |
| Veto Counter | 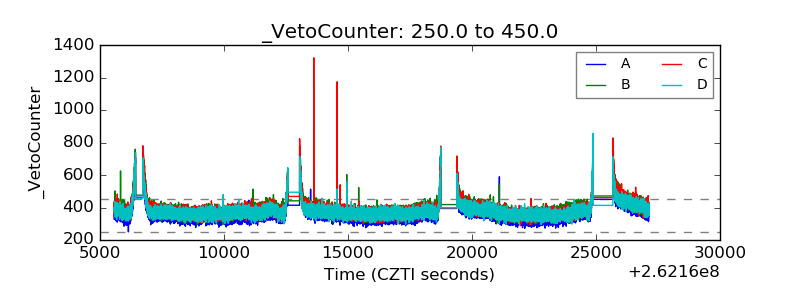 |