| Param | Original file | Final file |
|---|---|---|
| Filename | modeM0/AS1A04_010T01_9000002046_13890cztM0_level2.evt | modeM0/AS1A04_010T01_9000002046_13890cztM0_level2_quad_clean.evt |
| Size (bytes) | 539,415,360 | 91,339,200 |
| Size | 514.4 MB | 87.1 MB |
| Events in quadrant A | 2,890,187 | 604,957 |
| Events in quadrant B | 2,917,356 | 609,461 |
| Events in quadrant C | 3,392,308 | 588,224 |
| Events in quadrant D | 6,722,714 | 537,107 |
| Mode M9 | |||
|---|---|---|---|
| Quadrant | BADHDUFLAG | Total packets | Discarded packets |
| A | 0 | 9 | 0 |
| B | 0 | 9 | 0 |
| C | 0 | 9 | 0 |
| D | 0 | 9 | 0 |
| Mode SS | |||
|---|---|---|---|
| Quadrant | BADHDUFLAG | Total packets | Discarded packets |
| A | 0 | 124 | 0 |
| B | 0 | 124 | 0 |
| C | 0 | 124 | 0 |
| D | 0 | 124 | 0 |
| Mode M0 | |||
|---|---|---|---|
| Quadrant | BADHDUFLAG | Total packets | Discarded packets |
| A | 0 | 12620 | 2 |
| B | 0 | 12700 | 1 |
| C | 0 | 14195 | 1 |
| D | 0 | 24326 | 1 |
| Quadrant | Total seconds | Saturated seconds | Saturation percentage |
|---|---|---|---|
| A | 6099 | 77 | 1.262502% |
| B | 6099 | 80 | 1.311690% |
| C | 6099 | 236 | 3.869487% |
| D | 6099 | 980 | 16.068208% |
Noise dominated data is calculated using 1-second bins in cleaned event files. If a bin has >2000 counts, and if more than 50% of those come from <1% of pixels, then it is considered to be noise-dominated and hence unusable.
| Quadrant | # 1 sec bins | Bins with >0 counts | Bins with >2000 counts | High rate bins dominated by noise | Noise dominated (total time) | Noise dominated (detector-on time) | Marked lightcurve |
|---|---|---|---|---|---|---|---|
| A | 7025 | 6100 | 0 | 0 | 0.00% | 0.00% | 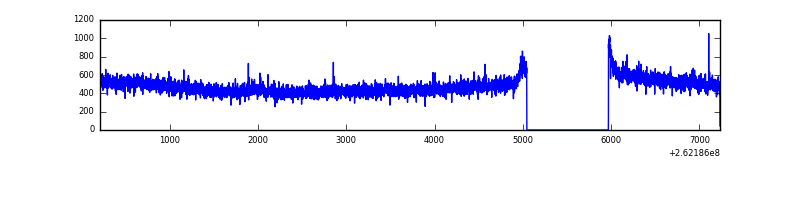 |
| B | 7025 | 6100 | 1 | 1 | 0.01% | 0.02% | 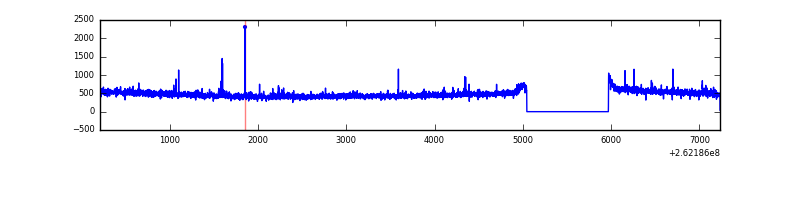 |
| C | 7024 | 6099 | 98 | 98 | 1.40% | 1.61% | 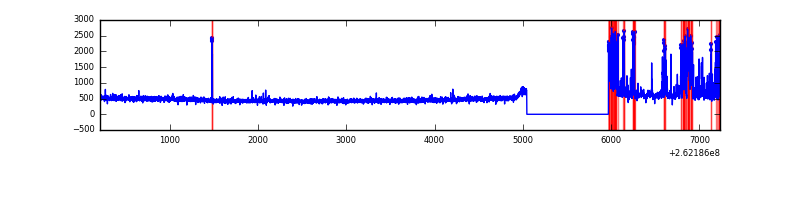 |
| D | 7025 | 6100 | 921 | 921 | 13.11% | 15.10% | 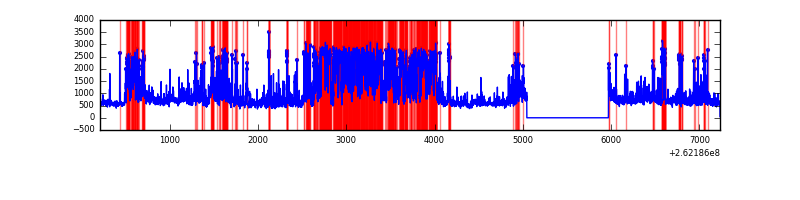 |
Top three noisy pixels from each quadrant. If the there are fewer than three noisy pixels in the level2.evt file, extra rows are filled as -1
| Pixel properties | Quadrant properties | ||||||
|---|---|---|---|---|---|---|---|
| Quadrant | DetID | PixID | Counts | Sigma | Mean | Median | Sigma |
| A | 0 | 23 | 28582 | 183.2 | 739 | 723 | 152.1 |
| A | 1 | 162 | 11493 | 70.82 | 739 | 723 | 152.1 |
| A | 0 | 226 | 8281 | 49.7 | 739 | 723 | 152.1 |
| B | 4 | 173 | 22865 | 153.77 | 731 | 712 | 144.1 |
| B | 12 | 111 | 16749 | 111.32 | 731 | 712 | 144.1 |
| B | 11 | 111 | 14496 | 95.68 | 731 | 712 | 144.1 |
| C | 3 | 233 | 622390 | 3740.36 | 708 | 710 | 166.2 |
| C | 0 | 207 | 9639 | 53.72 | 708 | 710 | 166.2 |
| C | 13 | 61 | 4879 | 25.08 | 708 | 710 | 166.2 |
| D | 1 | 52 | 3226744 | 19802.59 | 679 | 663 | 162.9 |
| D | 5 | 222 | 405268 | 2483.58 | 679 | 663 | 162.9 |
| D | 8 | 195 | 212751 | 1301.86 | 679 | 663 | 162.9 |
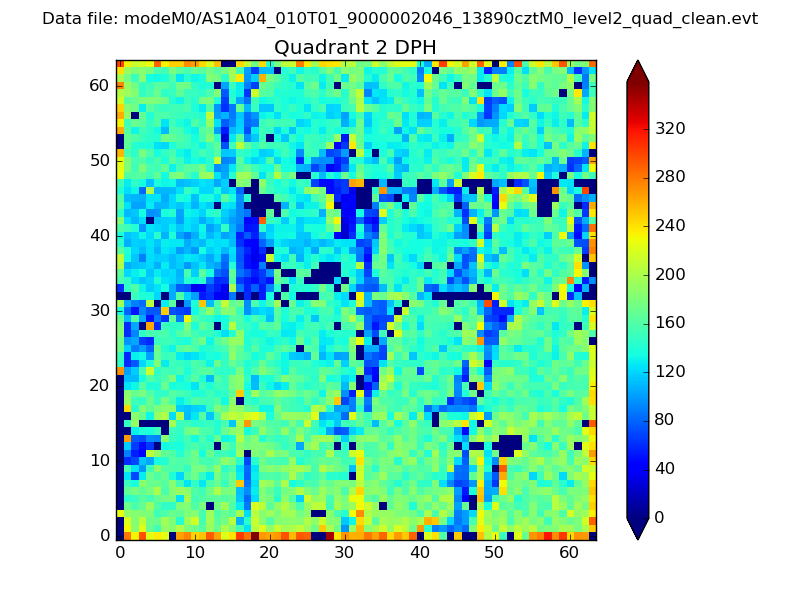
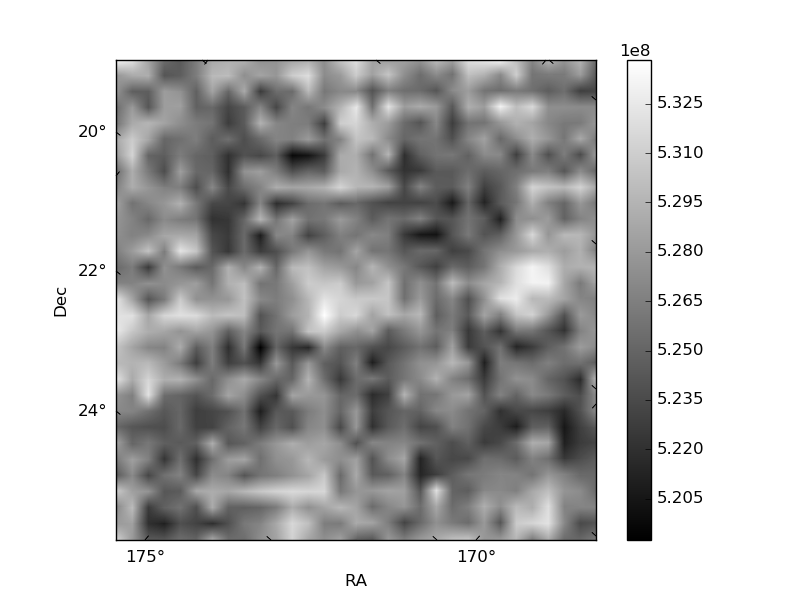
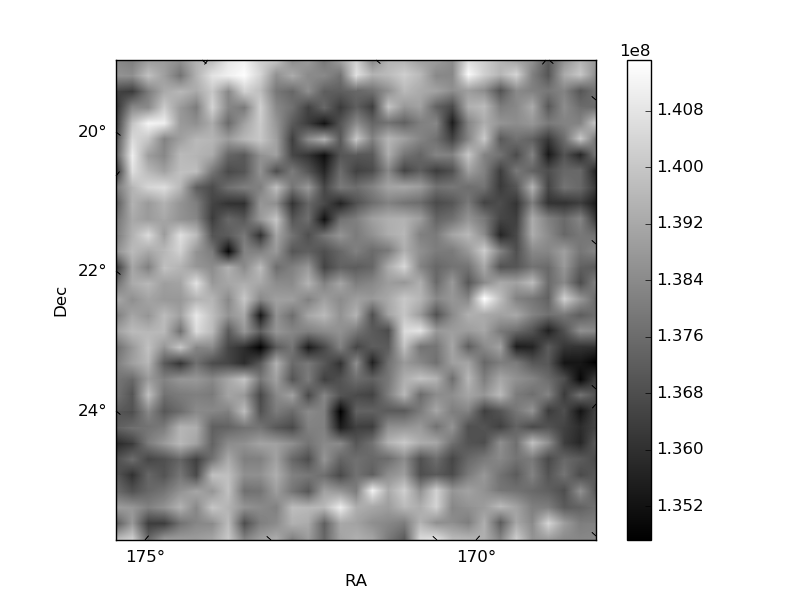
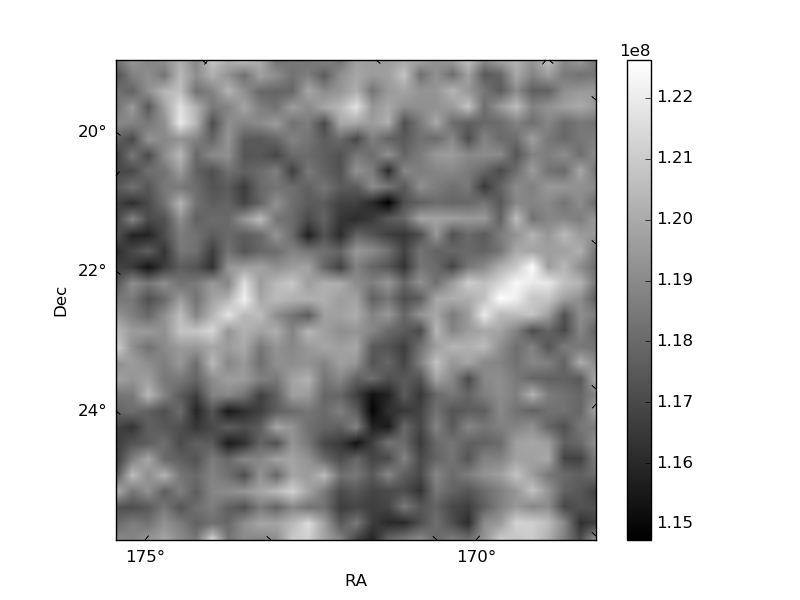
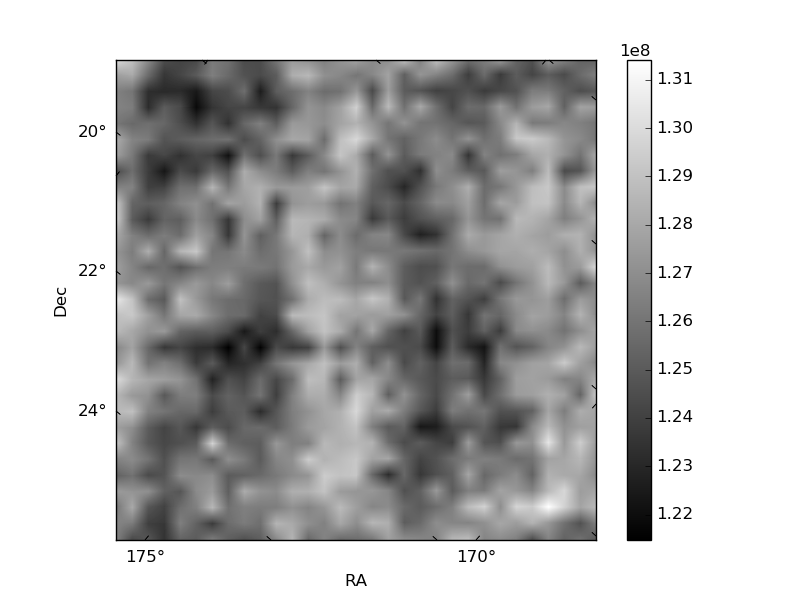
Histogram calculated using DETX and DETY for each event in the final _common_clean file
| Quadrant A | 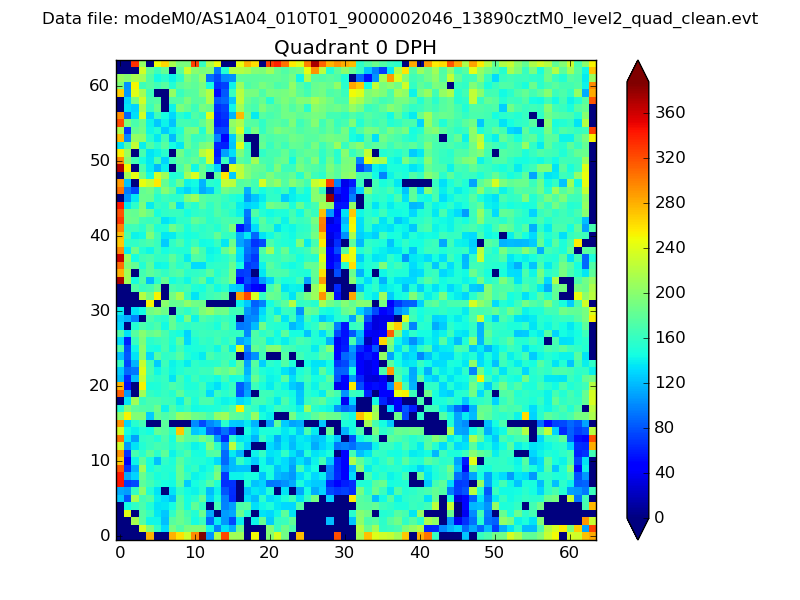 |
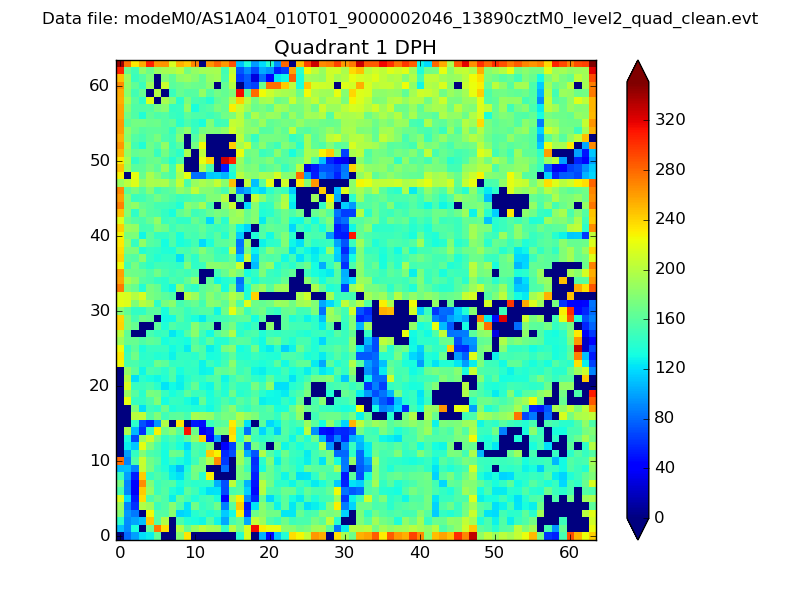 |
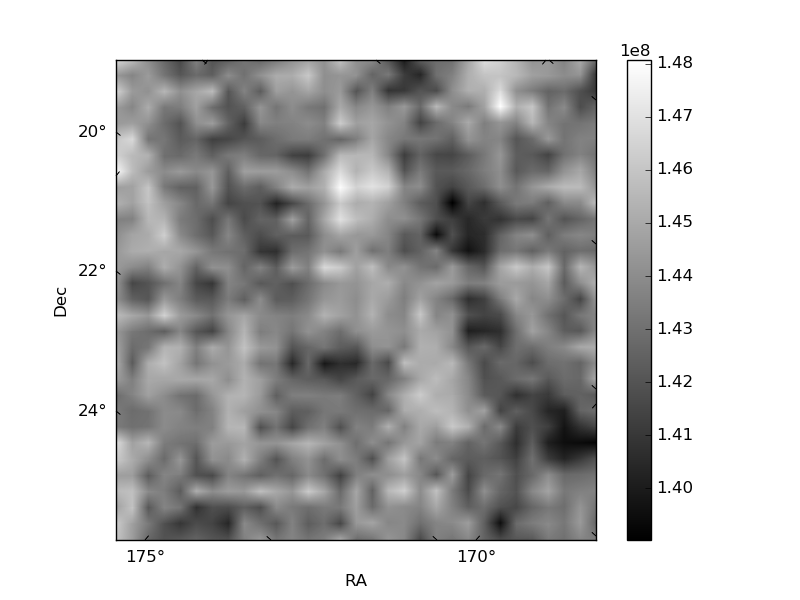
Quadrant B |
|---|---|---|---|
| Quadrant D | 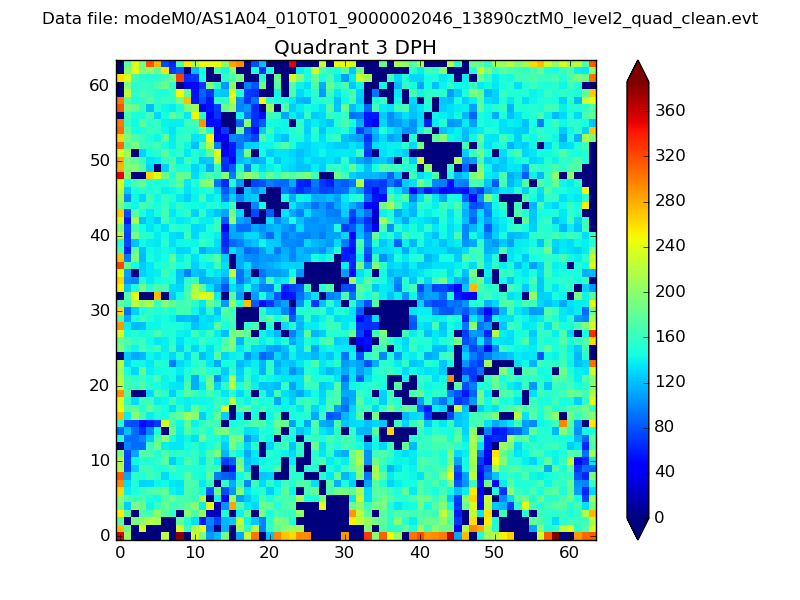 |
 |
Quadrant C |
| Plot type | Count rate plots | Images |
|---|---|---|
| Comparison with Poisson distribution Blue bars denote a histogram of data divided into 1 sec bins. Red curve is a Poisson curve with rate = median count rate of data. |
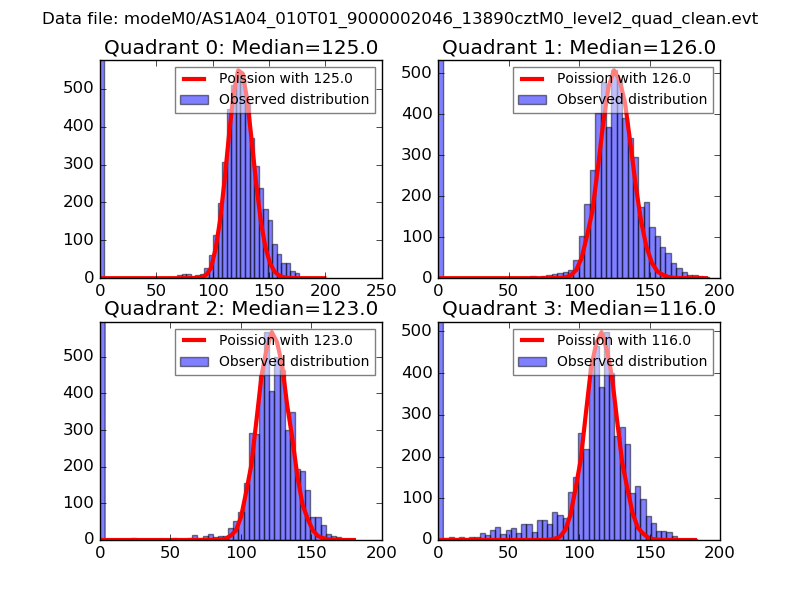 |
 |
| Quadrant-wise count rates Data is divided into 100 sec bins |
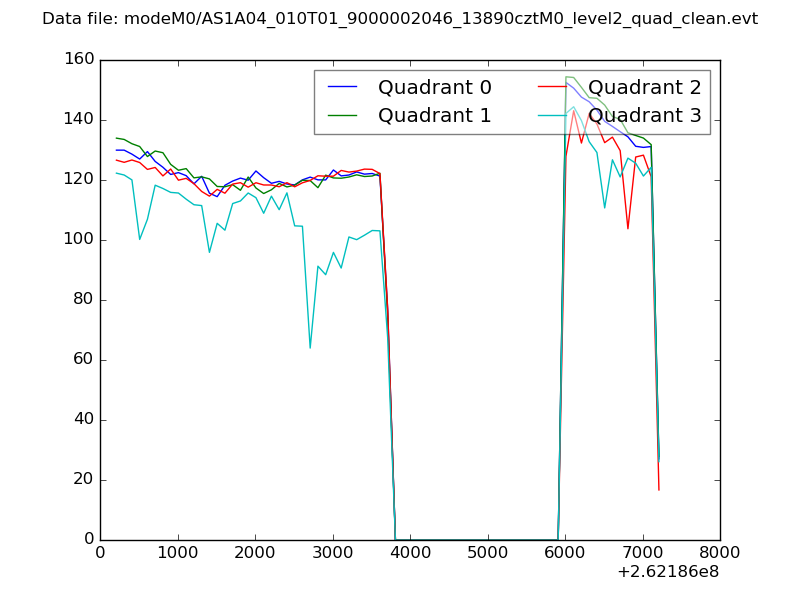 |
|
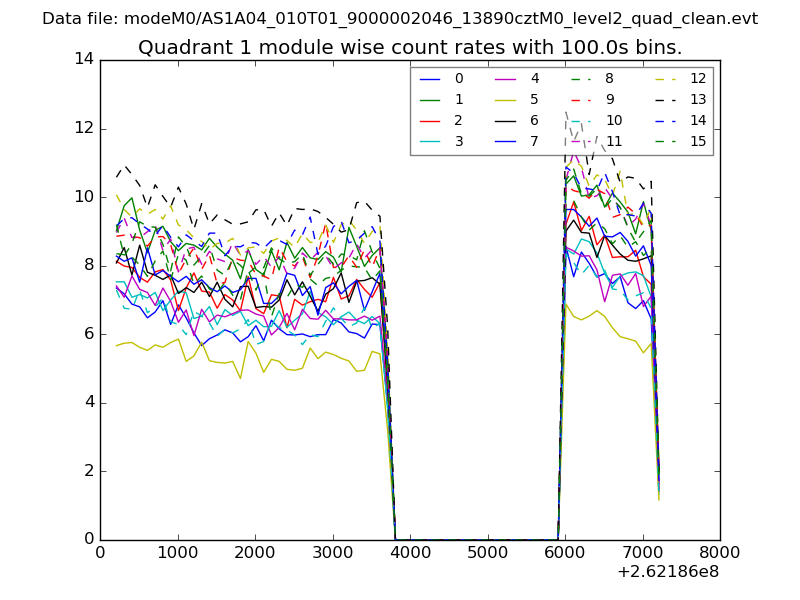
| Module-wise count rates for Quadrant A Data is divided into 100 sec bins |
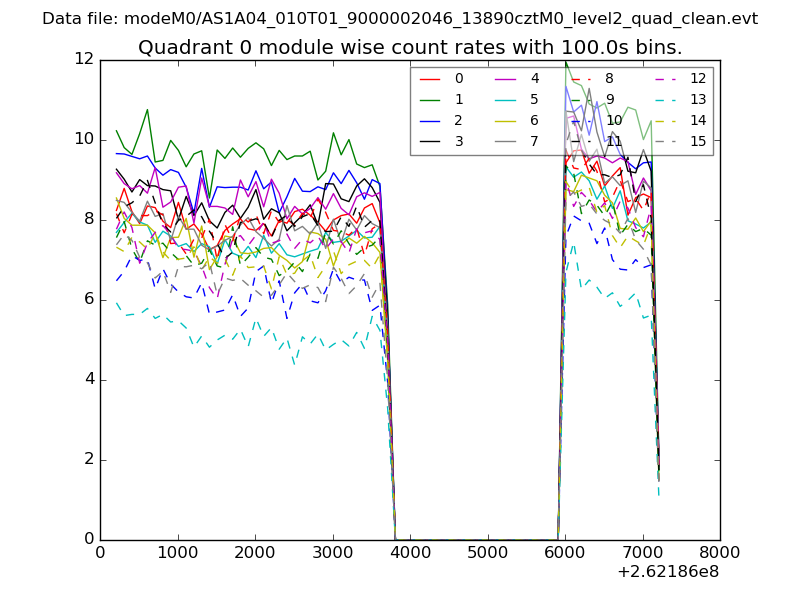 |
 |
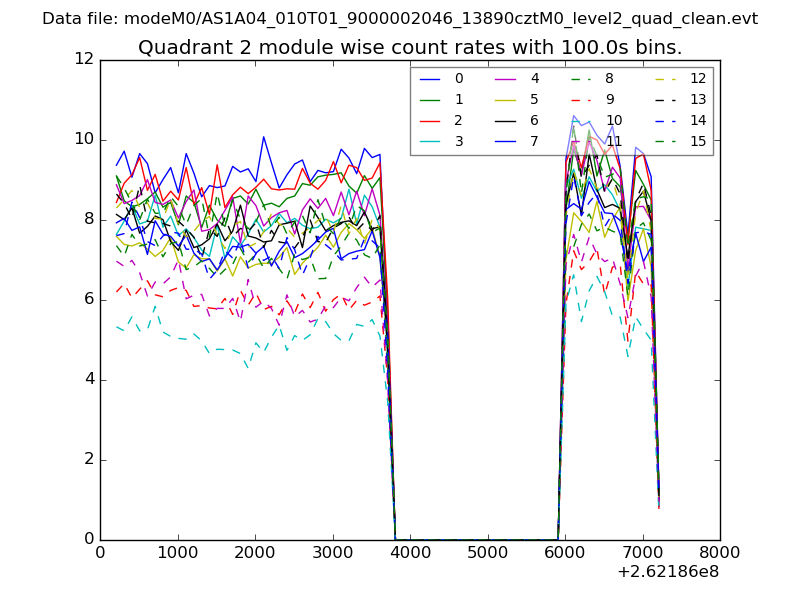
| Module-wise count rates for Quadrant B Data is divided into 100 sec bins |
 |
 |
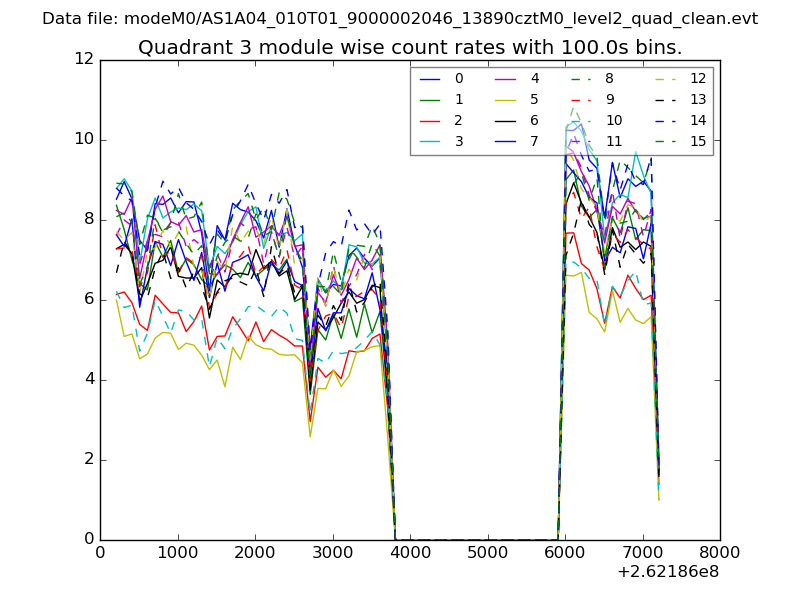
| Module-wise count rates for Quadrant C Data is divided into 100 sec bins |
 |
 |
| Module-wise count rates for Quadrant D Data is divided into 100 sec bins |
 |
 |
| Parameter | Plot |
|---|---|
| CZT HV Monitor | 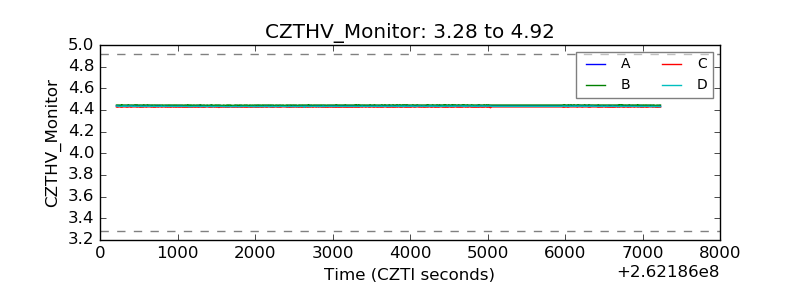 |
| D_VDD | 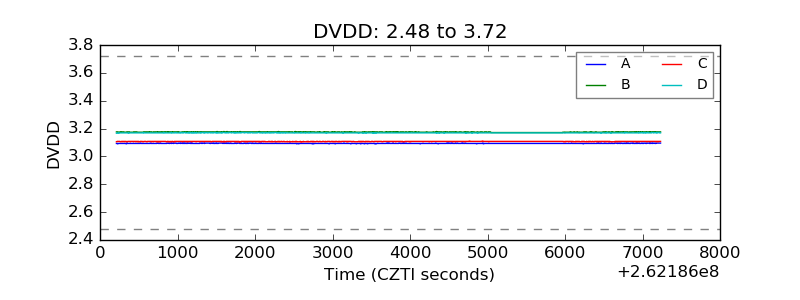 |
| Temperature 1 | 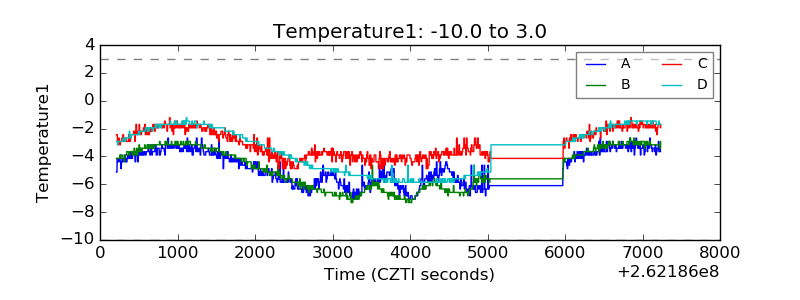 |
| Veto HV Monitor | 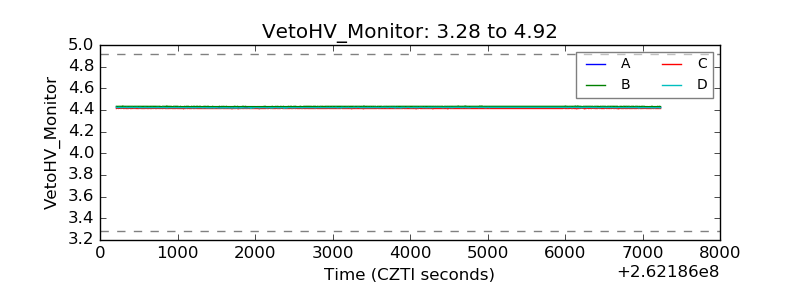 |
| Veto LLD | 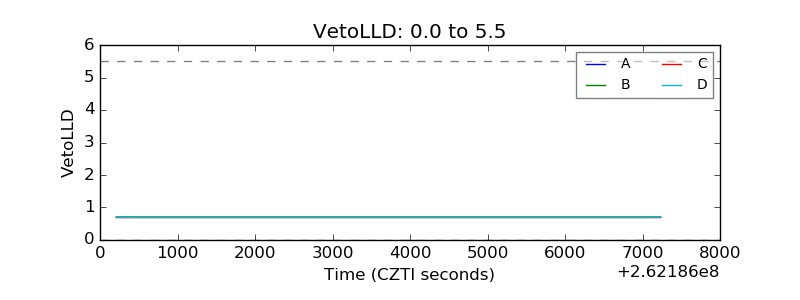 |
| Alpha Counter | 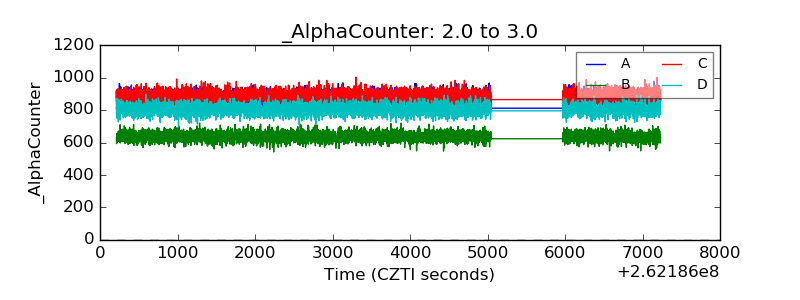 |
| _CPM_Rate |  |
| CZT Counter | 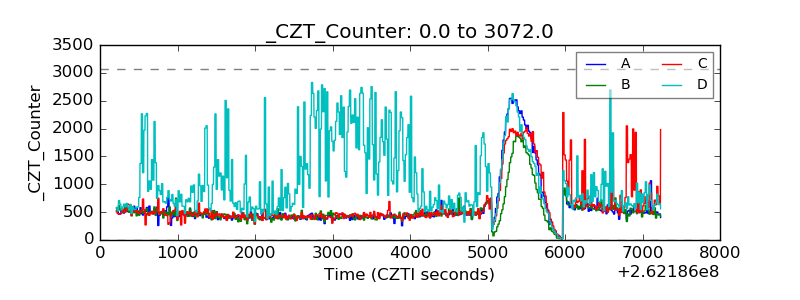 |
| +2.5 Volts monitor |  |
| +5 Volts monitor |  |
| _ROLL_ROT | 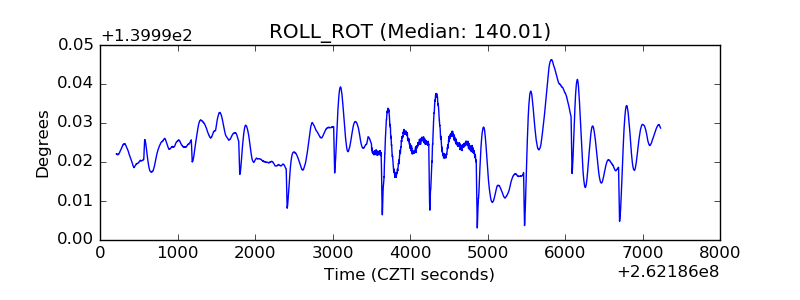 |
| _Roll_DEC | 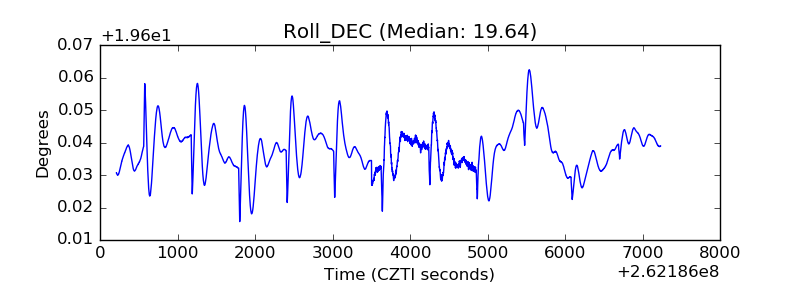 |
| _Roll_RA | 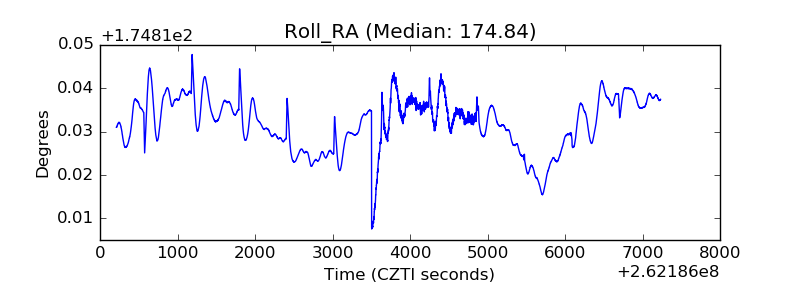 |
| Veto Counter | 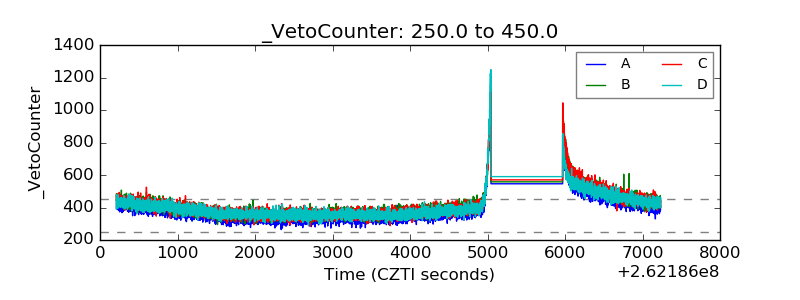 |