| Param | Original file | Final file |
|---|---|---|
| Filename | modeM0/AS1A04_010T01_9000002046_13893cztM0_level2.evt | modeM0/AS1A04_010T01_9000002046_13893cztM0_level2_quad_clean.evt |
| Size (bytes) | 530,170,560 | 100,926,720 |
| Size | 505.6 MB | 96.3 MB |
| Events in quadrant A | 3,228,524 | 665,974 |
| Events in quadrant B | 3,327,500 | 673,539 |
| Events in quadrant C | 3,880,669 | 648,342 |
| Events in quadrant D | 5,175,172 | 611,681 |
| Mode M9 | |||
|---|---|---|---|
| Quadrant | BADHDUFLAG | Total packets | Discarded packets |
| A | 0 | 23 | 0 |
| B | 0 | 23 | 0 |
| C | 0 | 23 | 0 |
| D | 0 | 23 | 0 |
| Mode SS | |||
|---|---|---|---|
| Quadrant | BADHDUFLAG | Total packets | Discarded packets |
| A | 0 | 134 | 0 |
| B | 0 | 134 | 0 |
| C | 0 | 134 | 0 |
| D | 0 | 134 | 0 |
| Mode M0 | |||
|---|---|---|---|
| Quadrant | BADHDUFLAG | Total packets | Discarded packets |
| A | 0 | 13909 | 2 |
| B | 0 | 14145 | 2 |
| C | 0 | 15676 | 2 |
| D | 0 | 19891 | 5 |
| Quadrant | Total seconds | Saturated seconds | Saturation percentage |
|---|---|---|---|
| A | 6556 | 80 | 1.220256% |
| B | 6556 | 82 | 1.250763% |
| C | 6556 | 255 | 3.889567% |
| D | 6555 | 553 | 8.436308% |
Noise dominated data is calculated using 1-second bins in cleaned event files. If a bin has >2000 counts, and if more than 50% of those come from <1% of pixels, then it is considered to be noise-dominated and hence unusable.
| Quadrant | # 1 sec bins | Bins with >0 counts | Bins with >2000 counts | High rate bins dominated by noise | Noise dominated (total time) | Noise dominated (detector-on time) | Marked lightcurve |
|---|---|---|---|---|---|---|---|
| A | 8838 | 6559 | 0 | 0 | 0.00% | 0.00% | 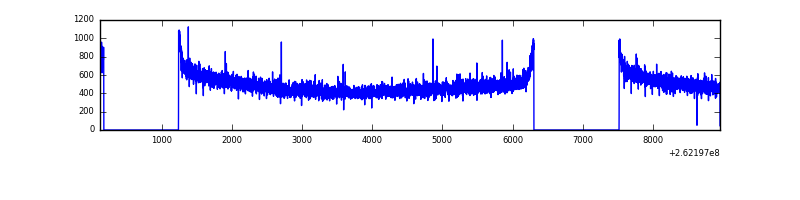 |
| B | 8838 | 6559 | 7 | 7 | 0.08% | 0.11% | 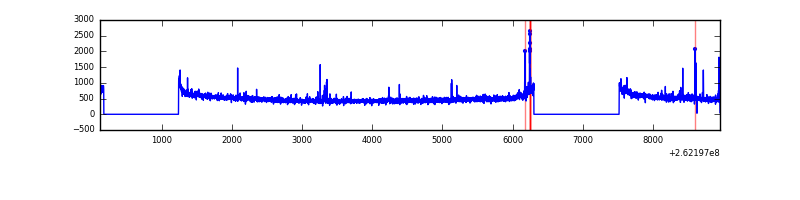 |
| C | 8838 | 6559 | 161 | 161 | 1.82% | 2.45% | 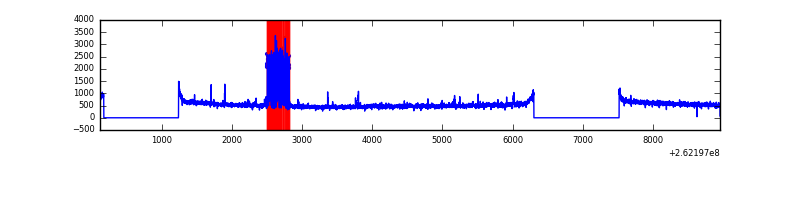 |
| D | 8838 | 6559 | 457 | 457 | 5.17% | 6.97% | 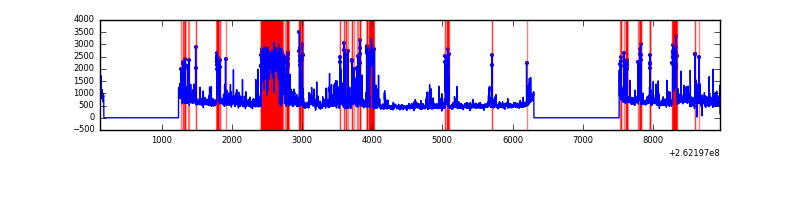 |
Top three noisy pixels from each quadrant. If the there are fewer than three noisy pixels in the level2.evt file, extra rows are filled as -1
| Pixel properties | Quadrant properties | ||||||
|---|---|---|---|---|---|---|---|
| Quadrant | DetID | PixID | Counts | Sigma | Mean | Median | Sigma |
| A | 1 | 162 | 14240 | 79.1 | 833 | 815 | 169.7 |
| A | 0 | 226 | 7692 | 40.52 | 833 | 815 | 169.7 |
| A | 12 | 194 | 6235 | 31.93 | 833 | 815 | 169.7 |
| B | 10 | 244 | 35213 | 218.8 | 829 | 808 | 157.2 |
| B | 4 | 48 | 27027 | 166.74 | 829 | 808 | 157.2 |
| B | 12 | 111 | 18060 | 109.71 | 829 | 808 | 157.2 |
| C | 3 | 233 | 742074 | 3977.08 | 804 | 808 | 186.4 |
| C | 0 | 207 | 6321 | 29.58 | 804 | 808 | 186.4 |
| C | 13 | 61 | 5721 | 26.36 | 804 | 808 | 186.4 |
| D | 1 | 52 | 1693385 | 9015.31 | 792 | 775 | 187.7 |
| D | 13 | 189 | 99879 | 527.86 | 792 | 775 | 187.7 |
| D | 8 | 195 | 92756 | 489.92 | 792 | 775 | 187.7 |
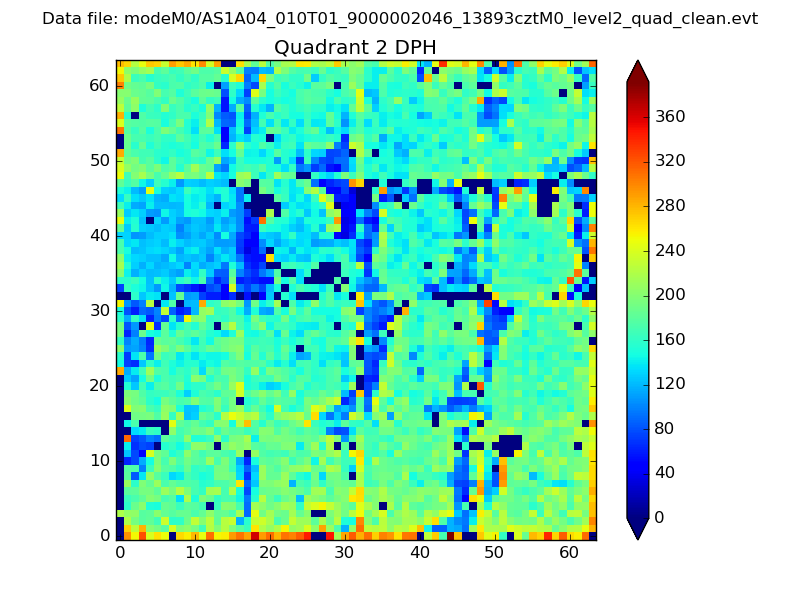
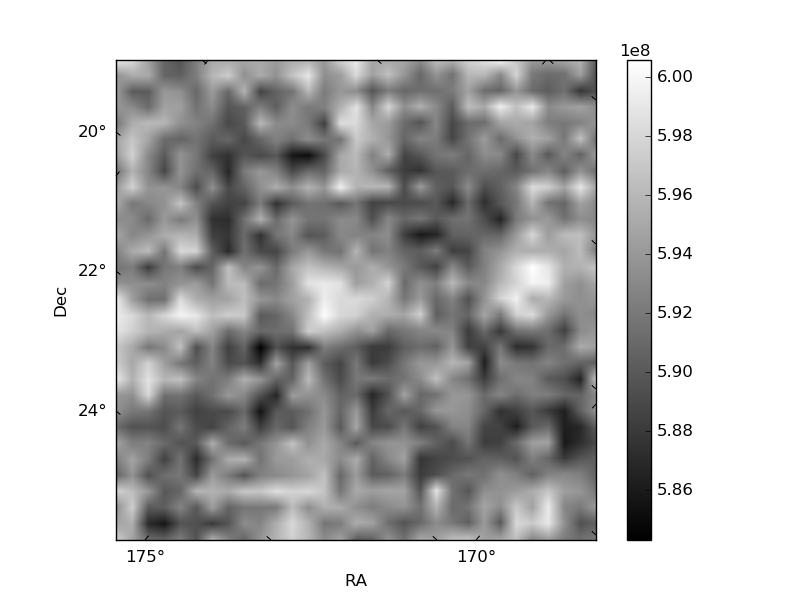
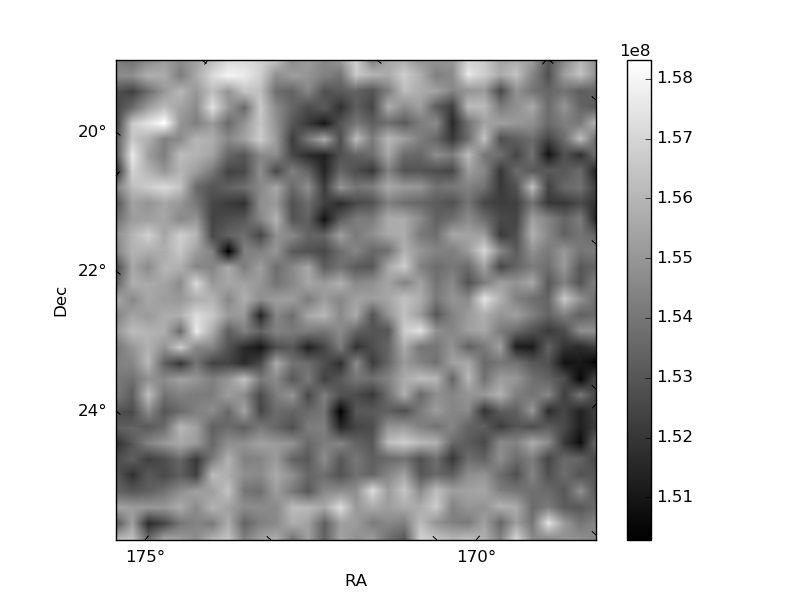
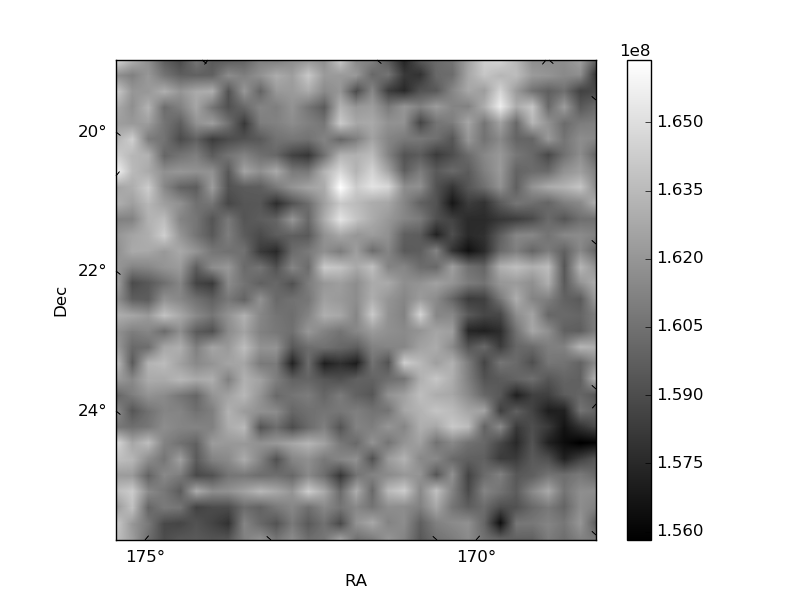
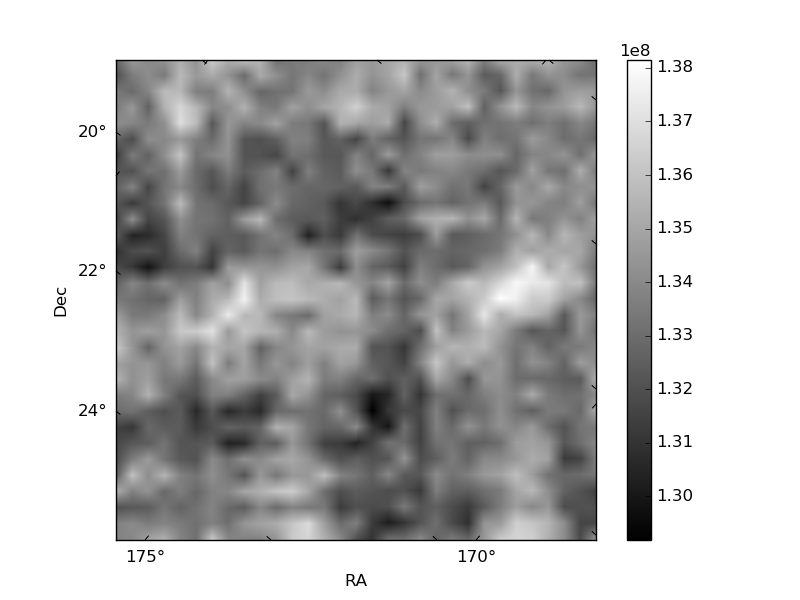
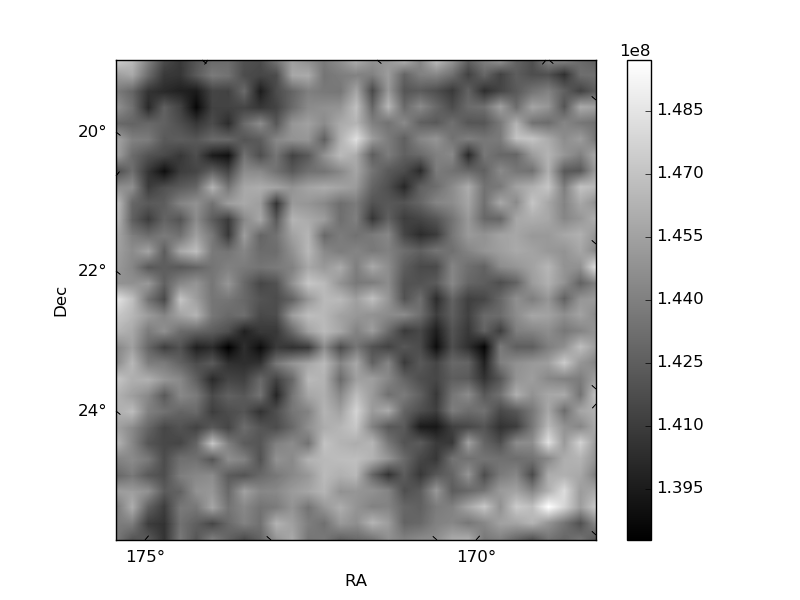
Histogram calculated using DETX and DETY for each event in the final _common_clean file
| Quadrant A | 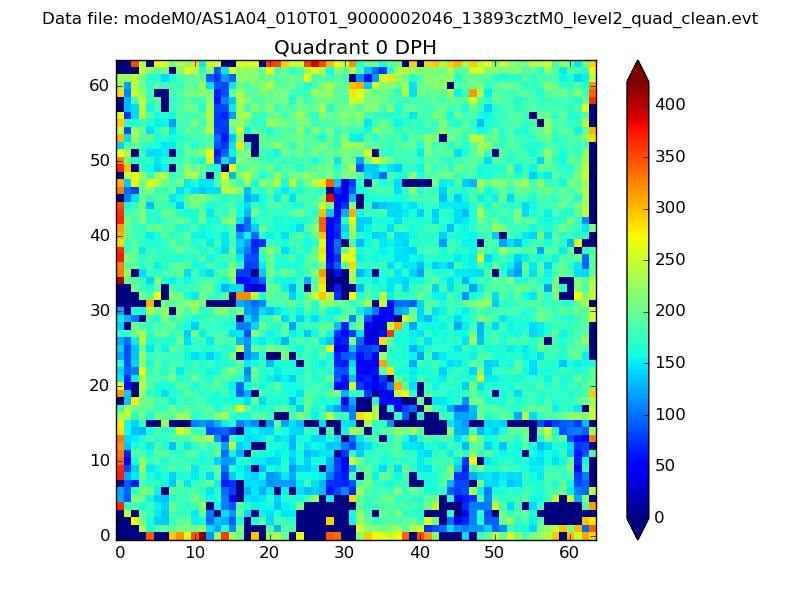 |
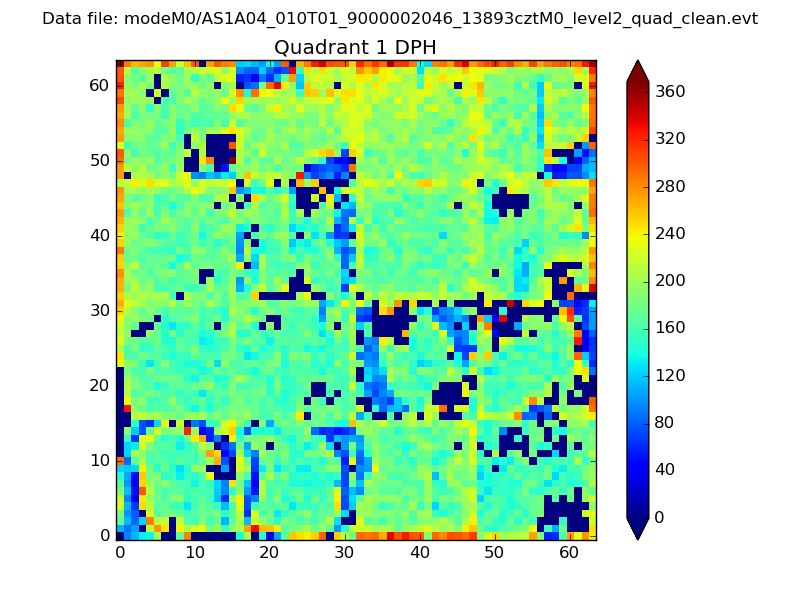 |
Quadrant B |
|---|---|---|---|
| Quadrant D | 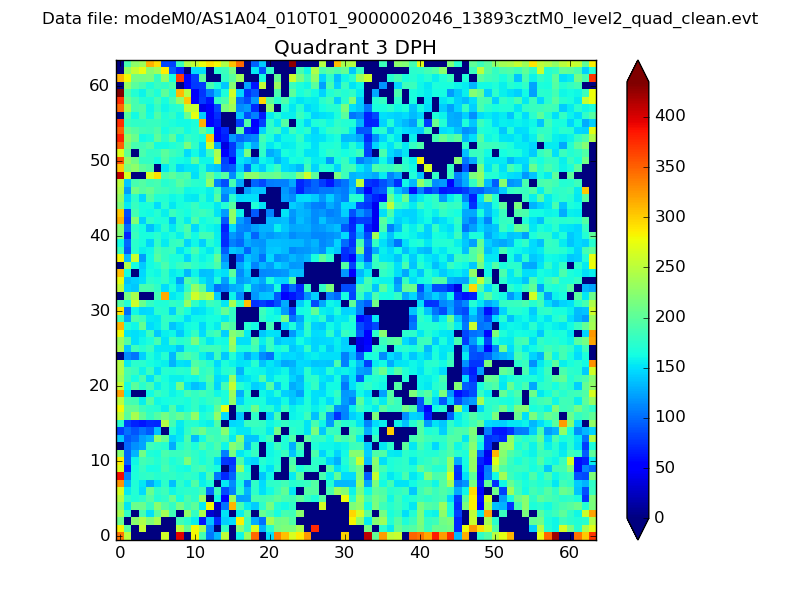 |
 |
Quadrant C |
| Plot type | Count rate plots | Images |
|---|---|---|
| Comparison with Poisson distribution Blue bars denote a histogram of data divided into 1 sec bins. Red curve is a Poisson curve with rate = median count rate of data. |
 |
 |
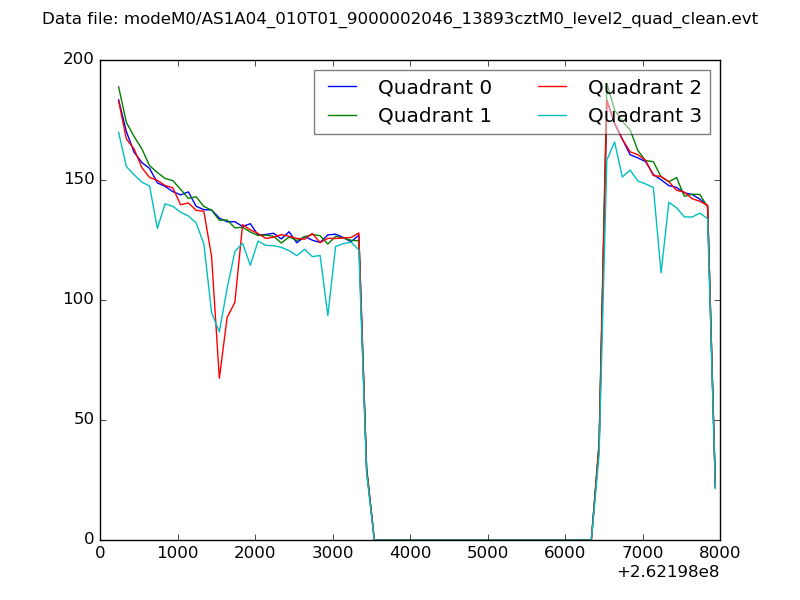
| Quadrant-wise count rates Data is divided into 100 sec bins |
 |
|
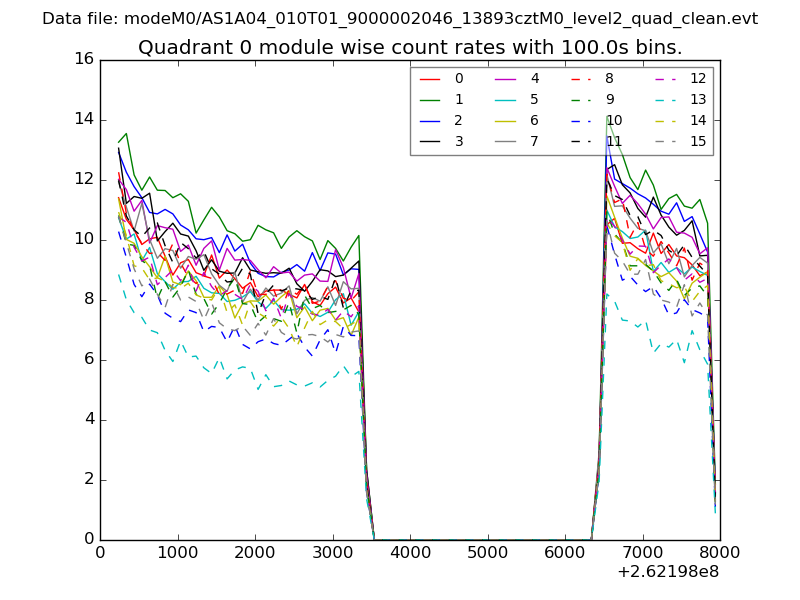
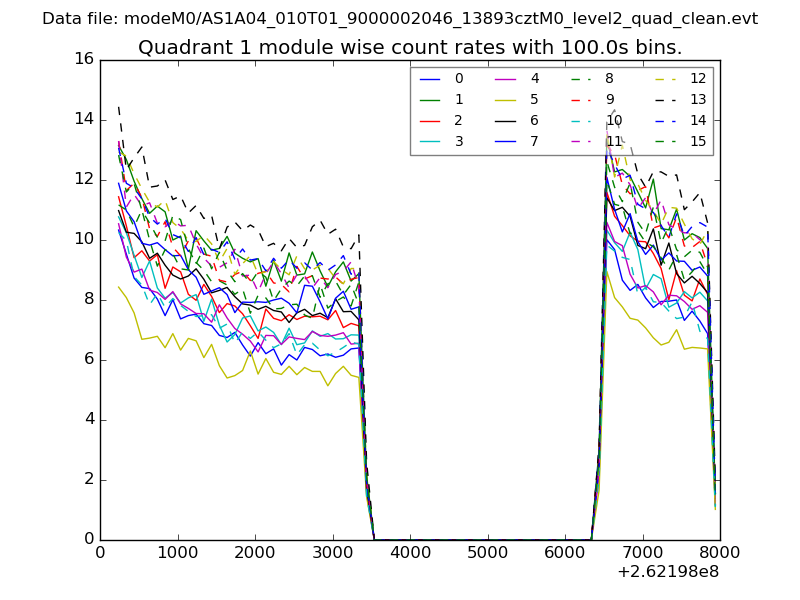
| Module-wise count rates for Quadrant A Data is divided into 100 sec bins |
 |
 |
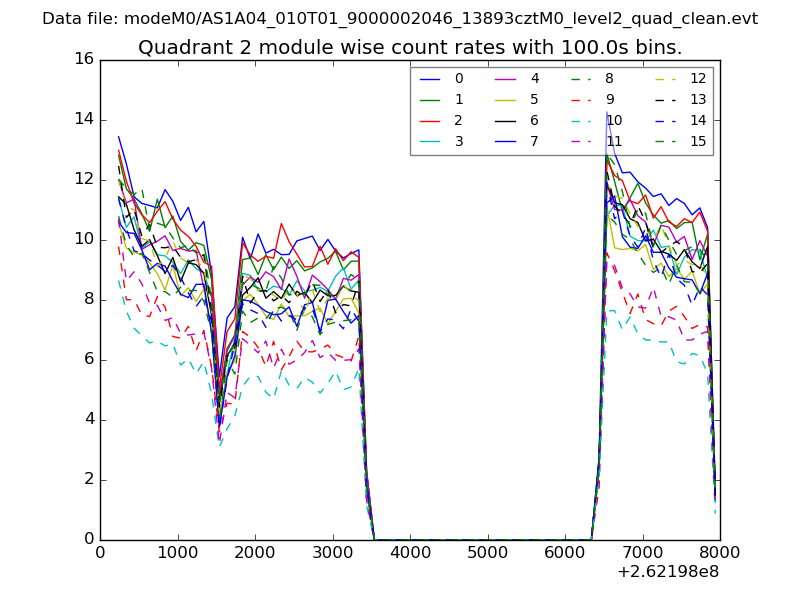
| Module-wise count rates for Quadrant B Data is divided into 100 sec bins |
 |
 |
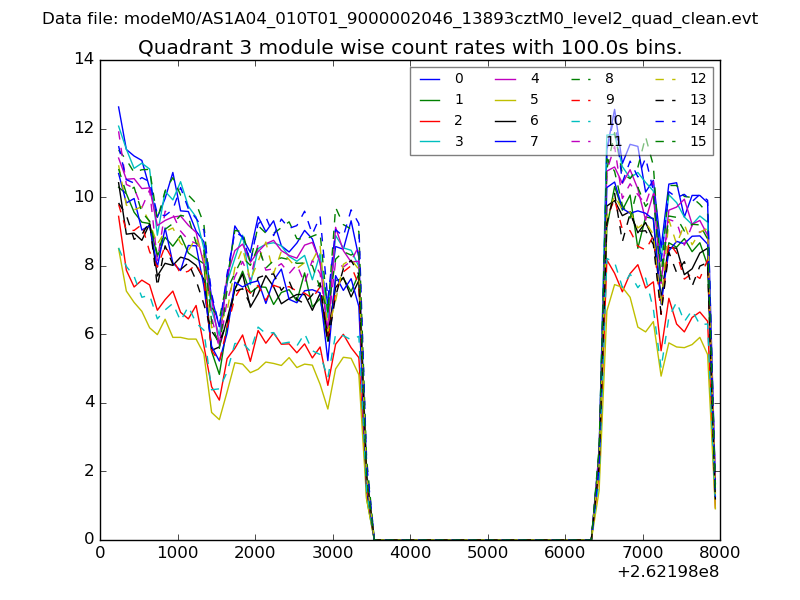
| Module-wise count rates for Quadrant C Data is divided into 100 sec bins |
 |
 |
| Module-wise count rates for Quadrant D Data is divided into 100 sec bins |
 |
 |
| Parameter | Plot |
|---|---|
| CZT HV Monitor | 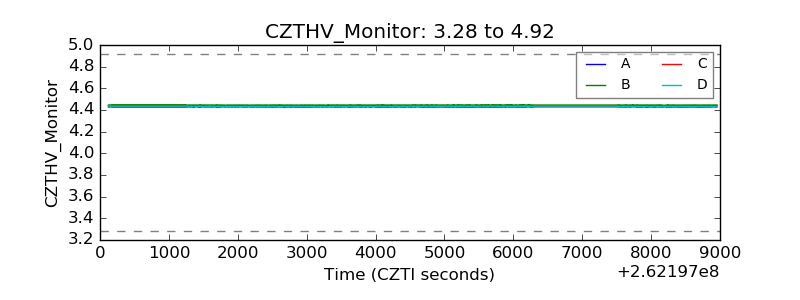 |
| D_VDD | 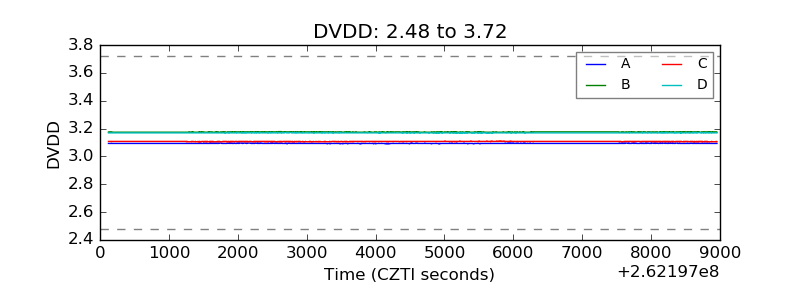 |
| Temperature 1 |  |
| Veto HV Monitor | 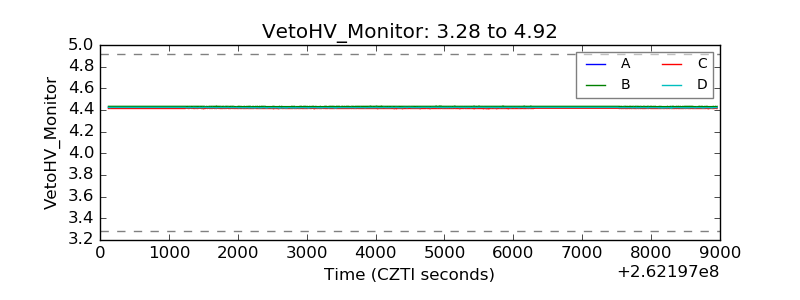 |
| Veto LLD | 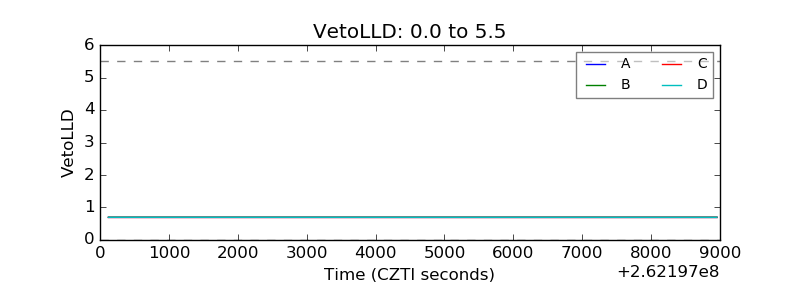 |
| Alpha Counter | 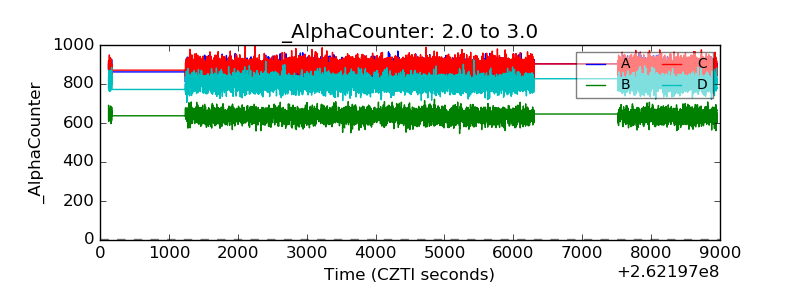 |
| _CPM_Rate | 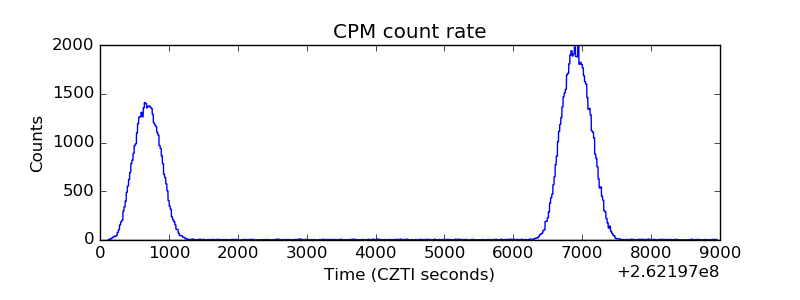 |
| CZT Counter | 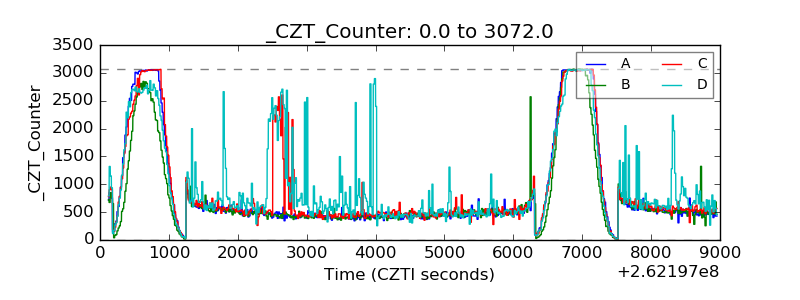 |
| +2.5 Volts monitor | 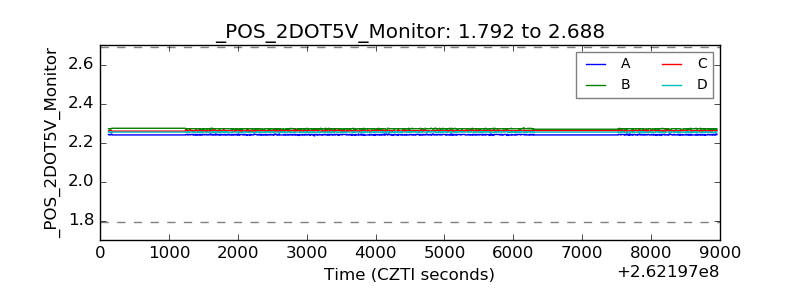 |
| +5 Volts monitor |  |
| _ROLL_ROT | 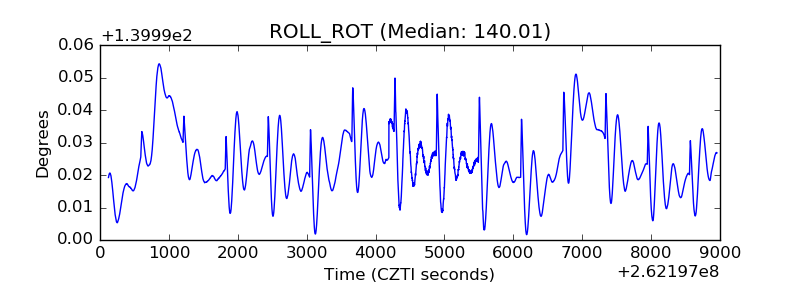 |
| _Roll_DEC | 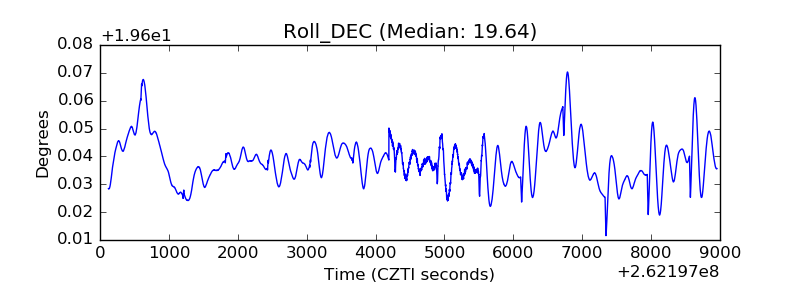 |
| _Roll_RA | 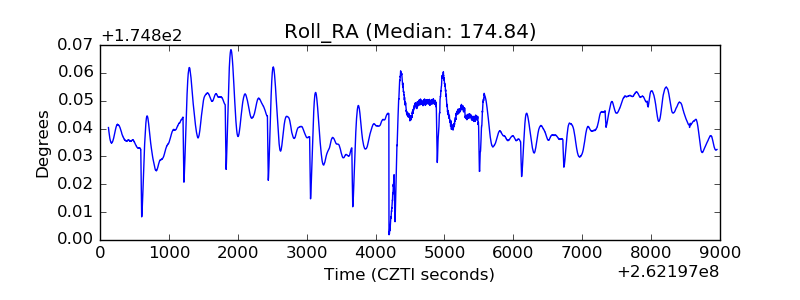 |
| Veto Counter | 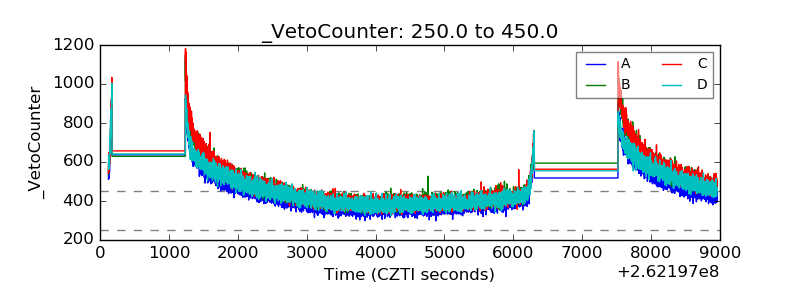 |