| Param | Original file | Final file |
|---|---|---|
| Filename | modeM0/AS1A04_010T01_9000002046_13894cztM0_level2.evt | modeM0/AS1A04_010T01_9000002046_13894cztM0_level2_quad_clean.evt |
| Size (bytes) | 494,141,760 | 93,504,960 |
| Size | 471.3 MB | 89.2 MB |
| Events in quadrant A | 2,986,374 | 615,075 |
| Events in quadrant B | 3,080,713 | 620,505 |
| Events in quadrant C | 3,627,818 | 597,567 |
| Events in quadrant D | 4,849,009 | 565,030 |
| Mode M9 | |||
|---|---|---|---|
| Quadrant | BADHDUFLAG | Total packets | Discarded packets |
| A | 0 | 12 | 0 |
| B | 0 | 12 | 0 |
| C | 0 | 12 | 0 |
| D | 0 | 12 | 0 |
| Mode SS | |||
|---|---|---|---|
| Quadrant | BADHDUFLAG | Total packets | Discarded packets |
| A | 0 | 126 | 0 |
| B | 0 | 126 | 0 |
| C | 0 | 126 | 0 |
| D | 0 | 126 | 0 |
| Mode M0 | |||
|---|---|---|---|
| Quadrant | BADHDUFLAG | Total packets | Discarded packets |
| A | 0 | 12920 | 1 |
| B | 0 | 13135 | 1 |
| C | 0 | 14642 | 1 |
| D | 0 | 18658 | 1 |
| Quadrant | Total seconds | Saturated seconds | Saturation percentage |
|---|---|---|---|
| A | 6208 | 26 | 0.418814% |
| B | 6208 | 35 | 0.563789% |
| C | 6208 | 211 | 3.398840% |
| D | 6208 | 471 | 7.586985% |
Noise dominated data is calculated using 1-second bins in cleaned event files. If a bin has >2000 counts, and if more than 50% of those come from <1% of pixels, then it is considered to be noise-dominated and hence unusable.
| Quadrant | # 1 sec bins | Bins with >0 counts | Bins with >2000 counts | High rate bins dominated by noise | Noise dominated (total time) | Noise dominated (detector-on time) | Marked lightcurve |
|---|---|---|---|---|---|---|---|
| A | 7425 | 6211 | 0 | 0 | 0.00% | 0.00% | 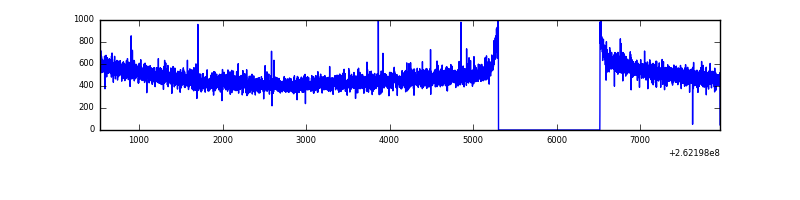 |
| B | 7425 | 6211 | 7 | 7 | 0.09% | 0.11% | 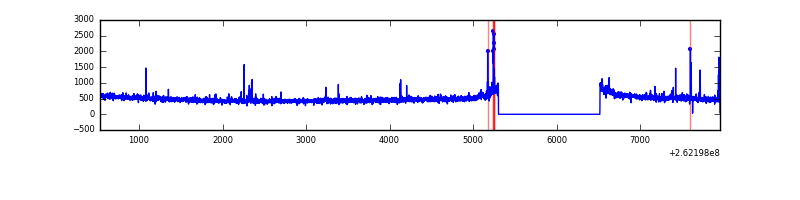 |
| C | 7425 | 6211 | 161 | 161 | 2.17% | 2.59% | 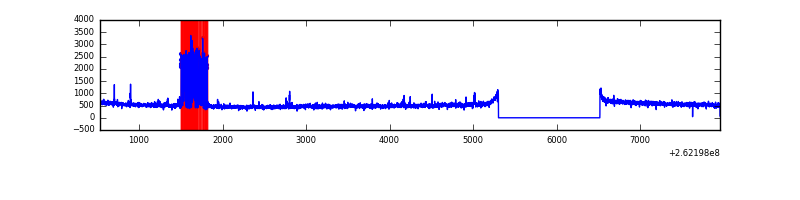 |
| D | 7425 | 6211 | 445 | 445 | 5.99% | 7.16% |  |
Top three noisy pixels from each quadrant. If the there are fewer than three noisy pixels in the level2.evt file, extra rows are filled as -1
| Pixel properties | Quadrant properties | ||||||
|---|---|---|---|---|---|---|---|
| Quadrant | DetID | PixID | Counts | Sigma | Mean | Median | Sigma |
| A | 1 | 162 | 14139 | 85.11 | 770 | 754 | 157.3 |
| A | 0 | 226 | 7101 | 40.36 | 770 | 754 | 157.3 |
| A | 12 | 194 | 5774 | 31.92 | 770 | 754 | 157.3 |
| B | 10 | 244 | 35090 | 236.49 | 767 | 749 | 145.2 |
| B | 4 | 48 | 26929 | 180.29 | 767 | 749 | 145.2 |
| B | 12 | 111 | 16567 | 108.93 | 767 | 749 | 145.2 |
| C | 3 | 233 | 730857 | 4248.68 | 742 | 746 | 171.8 |
| C | 0 | 207 | 6150 | 31.45 | 742 | 746 | 171.8 |
| C | 13 | 61 | 5267 | 26.31 | 742 | 746 | 171.8 |
| D | 1 | 52 | 1623025 | 9365.18 | 732 | 717 | 173.2 |
| D | 8 | 195 | 91171 | 522.17 | 732 | 717 | 173.2 |
| D | 13 | 189 | 90042 | 515.65 | 732 | 717 | 173.2 |
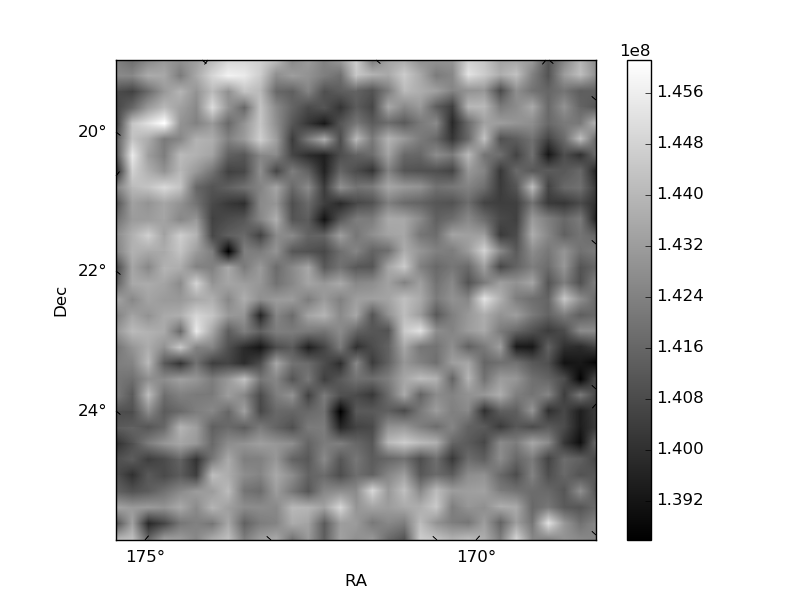
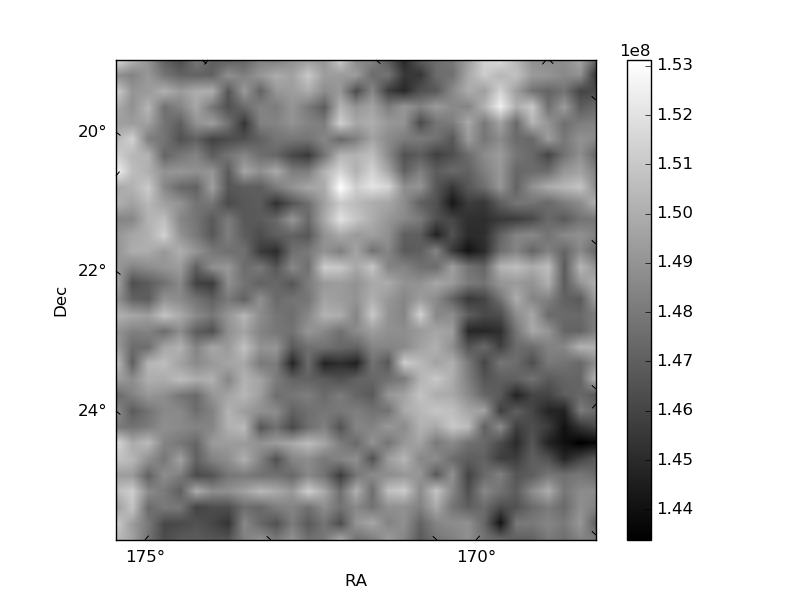
Histogram calculated using DETX and DETY for each event in the final _common_clean file
| Quadrant A | 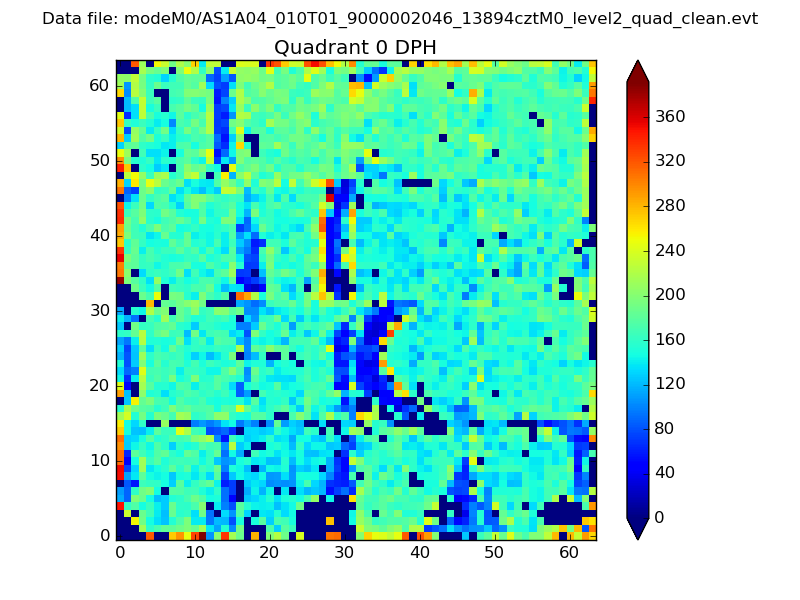 |
 |
Quadrant B |
|---|---|---|---|
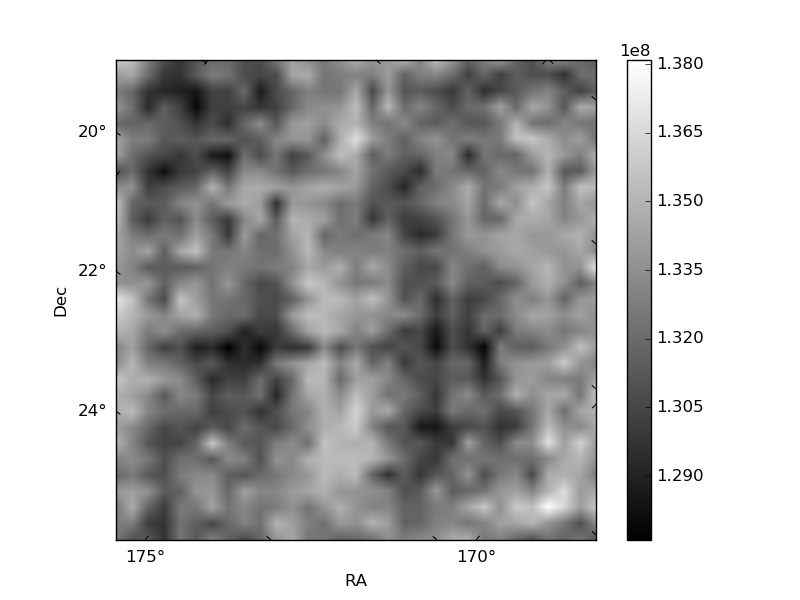
| Quadrant D |  |
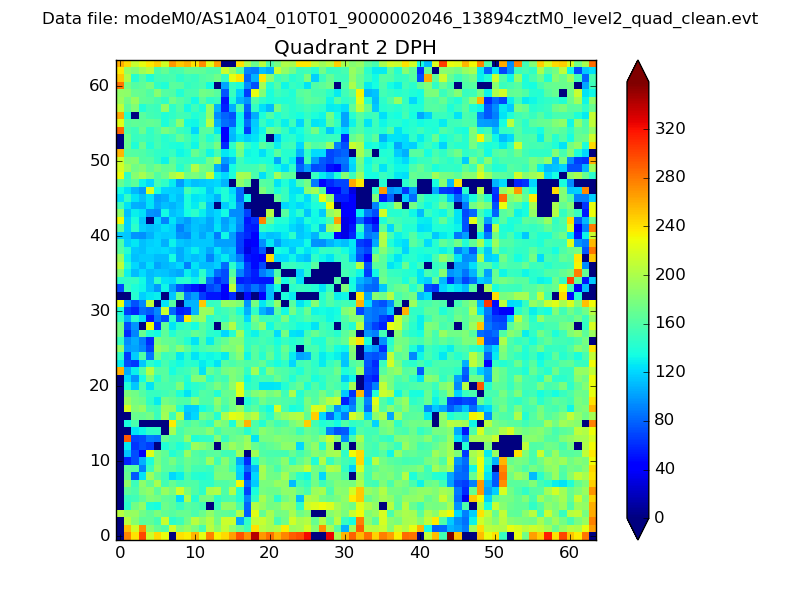 |
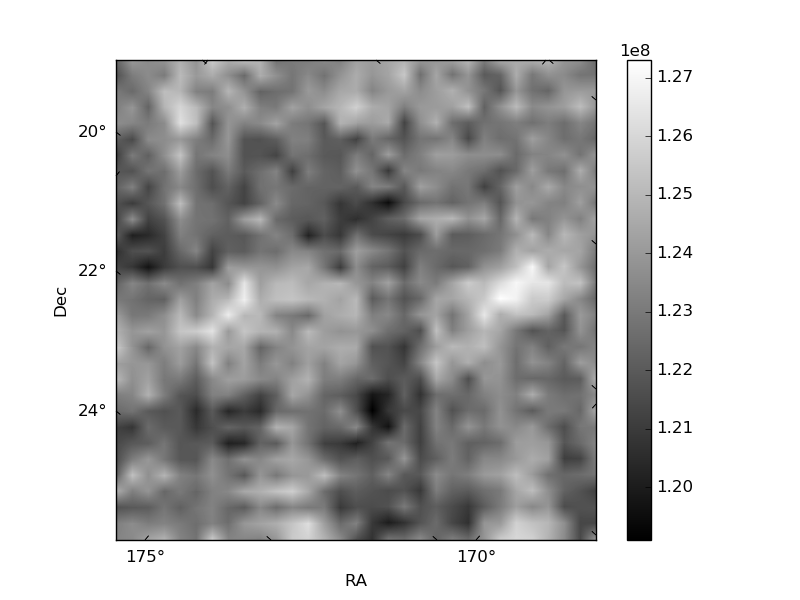
Quadrant C |
| Plot type | Count rate plots | Images |
|---|---|---|
| Comparison with Poisson distribution Blue bars denote a histogram of data divided into 1 sec bins. Red curve is a Poisson curve with rate = median count rate of data. |
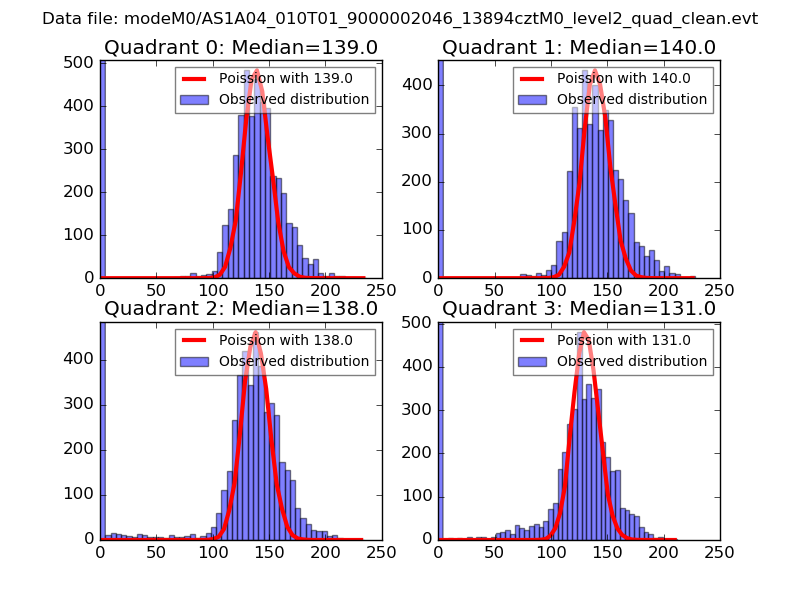 |
 |
| Quadrant-wise count rates Data is divided into 100 sec bins |
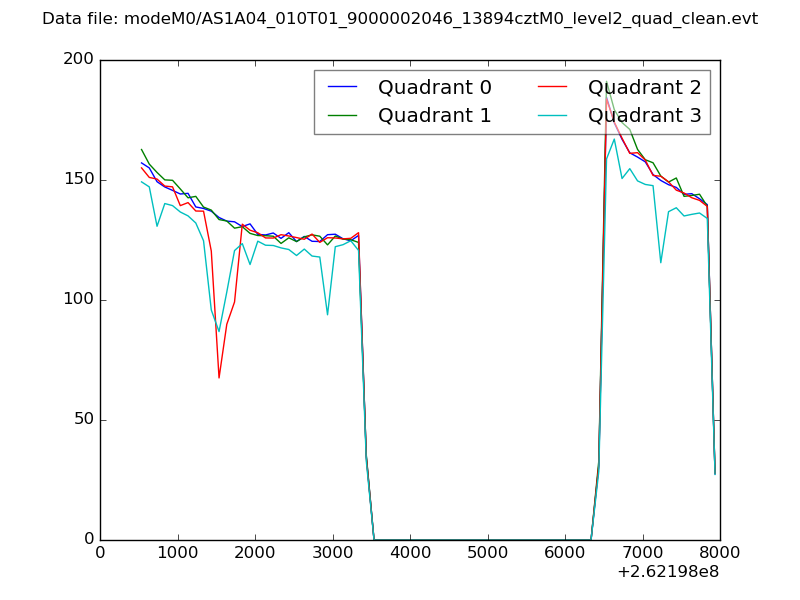 |
|
| Module-wise count rates for Quadrant A Data is divided into 100 sec bins |
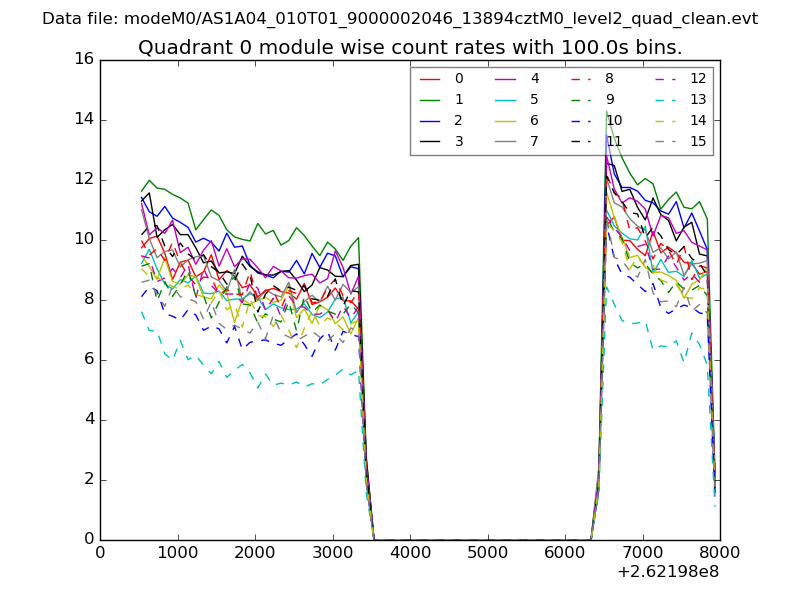 |
 |
| Module-wise count rates for Quadrant B Data is divided into 100 sec bins |
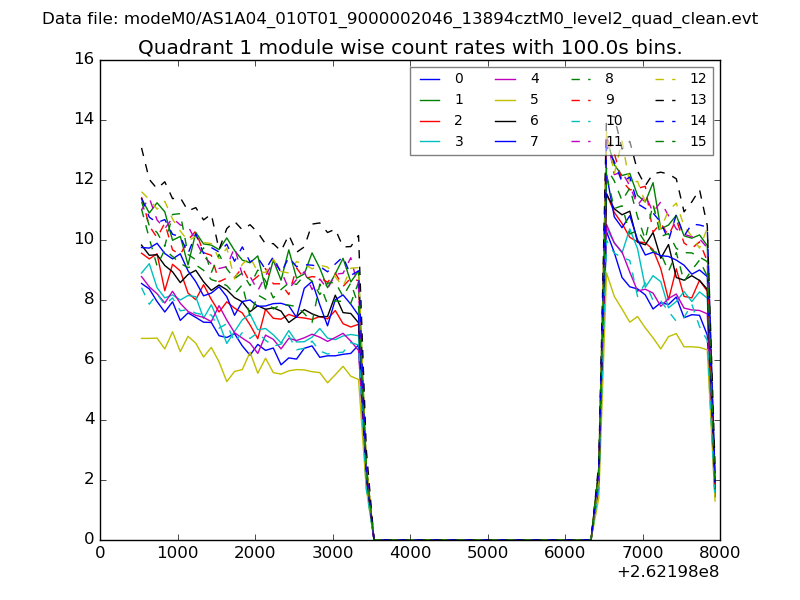 |
 |
| Module-wise count rates for Quadrant C Data is divided into 100 sec bins |
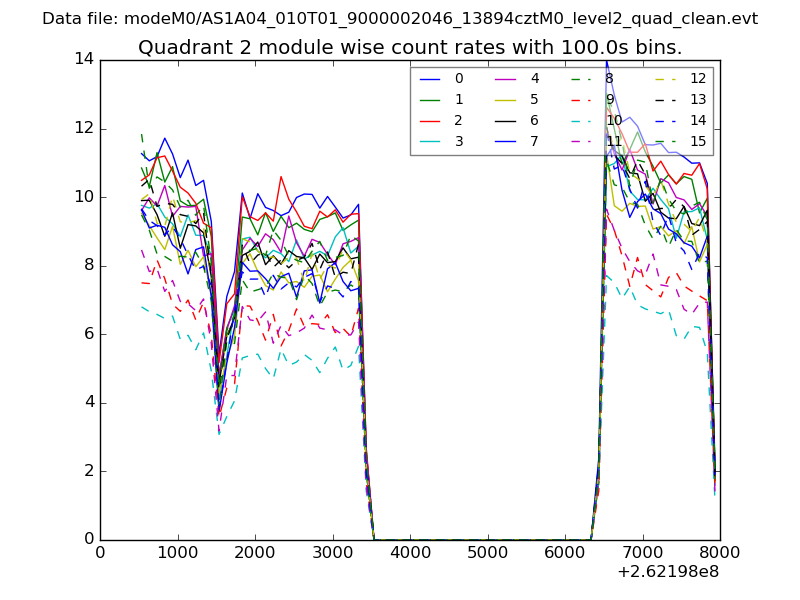 |
 |
| Module-wise count rates for Quadrant D Data is divided into 100 sec bins |
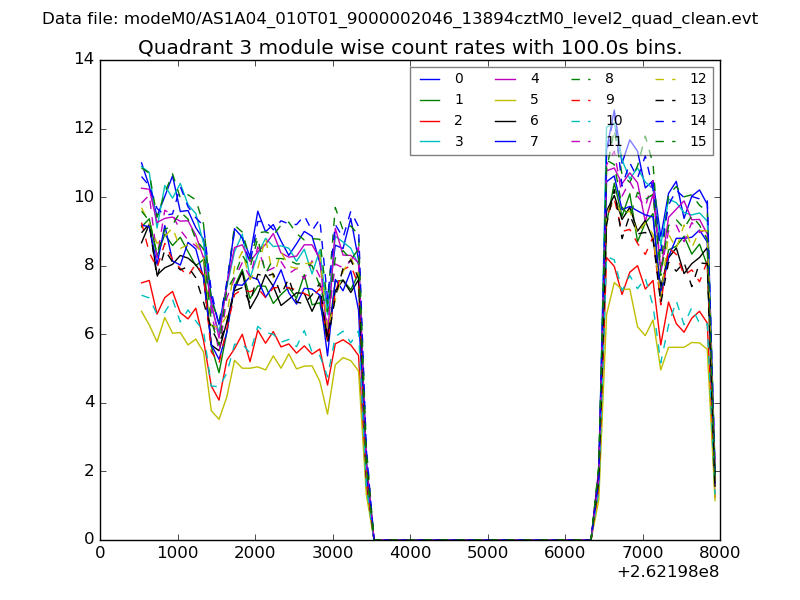 |
 |
| Parameter | Plot |
|---|---|
| CZT HV Monitor | 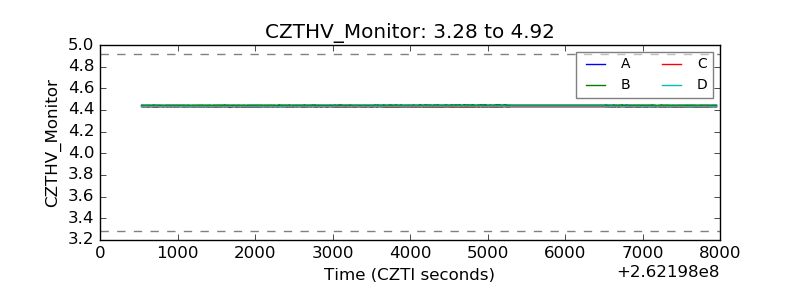 |
| D_VDD | 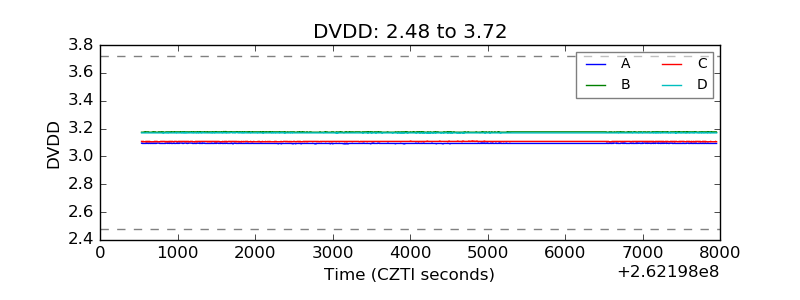 |
| Temperature 1 | 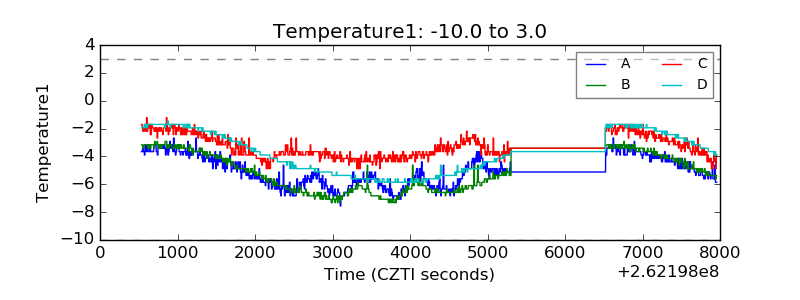 |
| Veto HV Monitor | 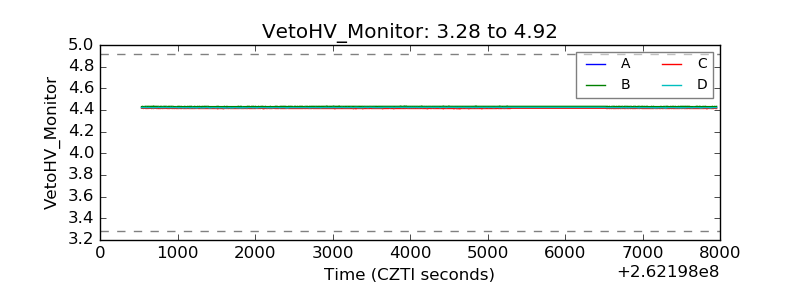 |
| Veto LLD | 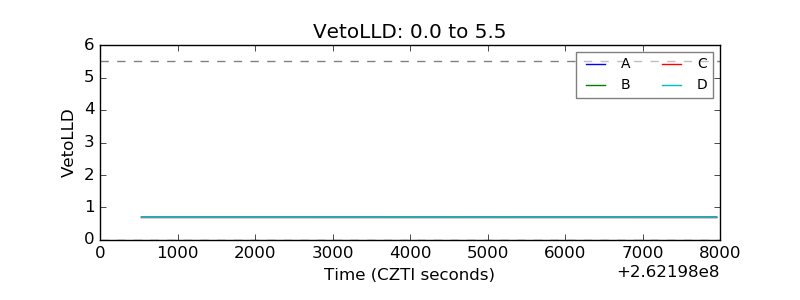 |
| Alpha Counter | 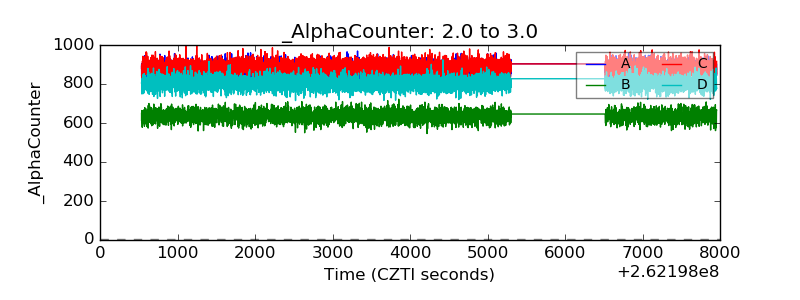 |
| _CPM_Rate | 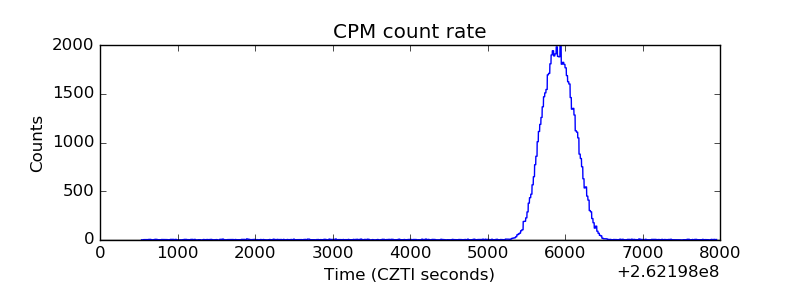 |
| CZT Counter | 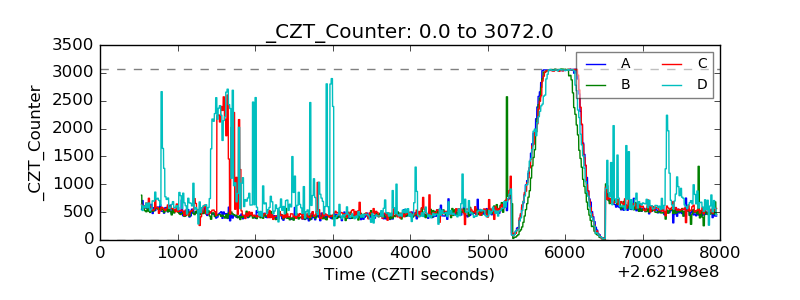 |
| +2.5 Volts monitor | 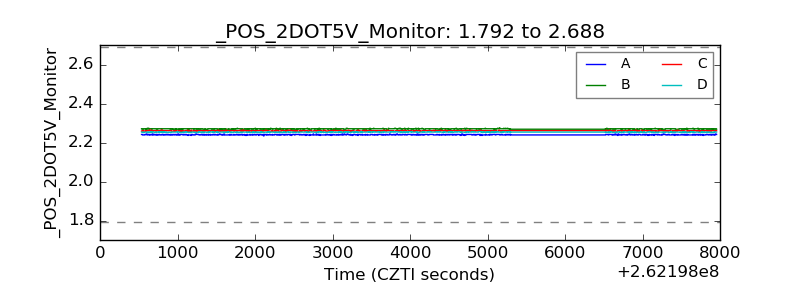 |
| +5 Volts monitor | 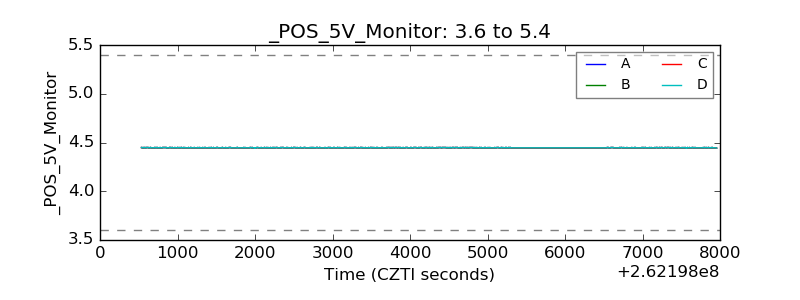 |
| _ROLL_ROT | 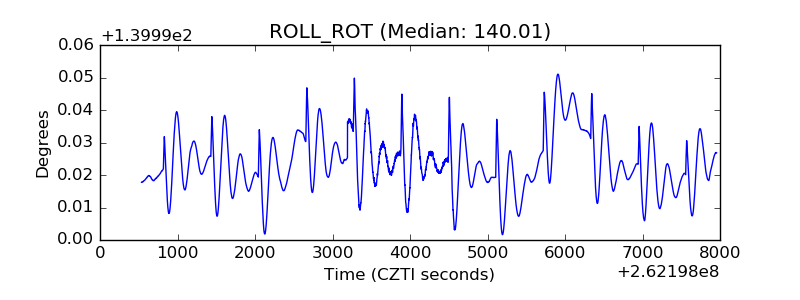 |
| _Roll_DEC | 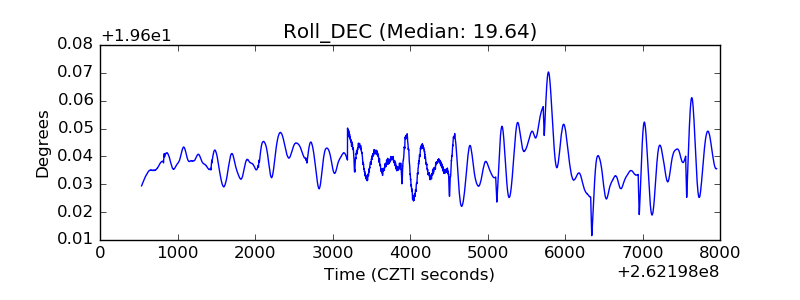 |
| _Roll_RA | 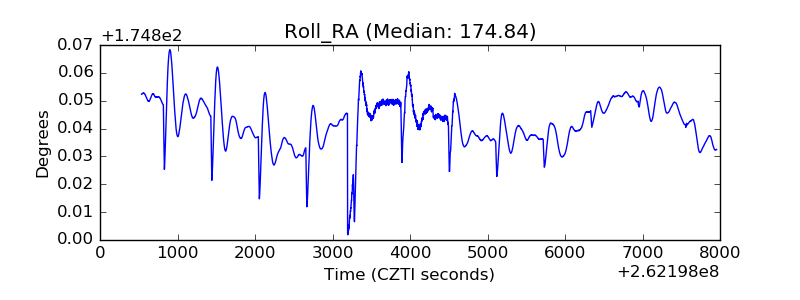 |
| Veto Counter | 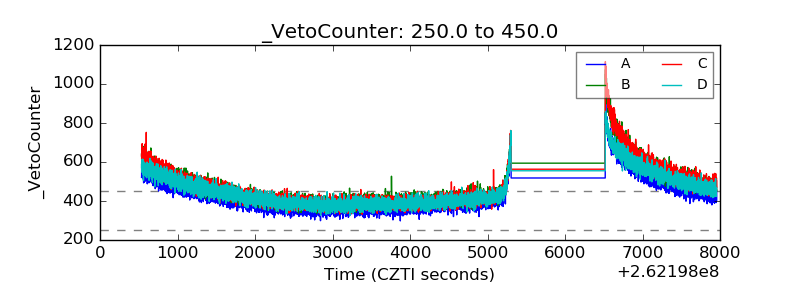 |