| Param | Original file | Final file |
|---|---|---|
| Filename | modeM0/AS1G08_030T01_9000002044cztM0_level2.fits | modeM0/AS1G08_030T01_9000002044cztM0_level2_quad_clean.evt |
| Size (bytes) | 184,881,600 | 192,381,120 |
| Size | 176.3 MB | 183.5 MB |
| Events in quadrant A | 1,133,960 | 1,184,068 |
| Events in quadrant B | 1,081,746 | 1,128,766 |
| Events in quadrant C | 1,128,448 | 1,156,475 |
| Events in quadrant D | 951,826 | 1,053,839 |
| Mode M0 | |||
|---|---|---|---|
| Quadrant | BADHDUFLAG | Total packets | Discarded packets |
| A | 0 | 39418 | 0 |
| B | 0 | 40879 | 0 |
| C | 0 | 39230 | 0 |
| D | 0 | 52408 | 0 |
| Mode M9 | |||
|---|---|---|---|
| Quadrant | BADHDUFLAG | Total packets | Discarded packets |
| A | 0 | 37 | 0 |
| B | 0 | 37 | 0 |
| C | 0 | 37 | 0 |
| D | 0 | 37 | 0 |
| Mode SS | |||
|---|---|---|---|
| Quadrant | BADHDUFLAG | Total packets | Discarded packets |
| A | 0 | 388 | 0 |
| B | 0 | 388 | 0 |
| C | 0 | 388 | 0 |
| D | 0 | 388 | 0 |
| Quadrant | Total seconds | Saturated seconds | Saturation percentage |
|---|---|---|---|
| A | 18905 | 219 | 1.158424% |
| B | 18905 | 270 | 1.428194% |
| C | 18905 | 176 | 0.930971% |
| D | 18905 | 1054 | 5.575245% |
Noise dominated data is calculated using 1-second bins in cleaned event files. If a bin has >2000 counts, and if more than 50% of those come from <1% of pixels, then it is considered to be noise-dominated and hence unusable.
| Quadrant | # 1 sec bins | Bins with >0 counts | Bins with >2000 counts | High rate bins dominated by noise | Noise dominated (total time) | Noise dominated (detector-on time) | Marked lightcurve |
|---|---|---|---|---|---|---|---|
| A | 22680 | 18901 | 0 | 0 | 0.00% | 0.00% | 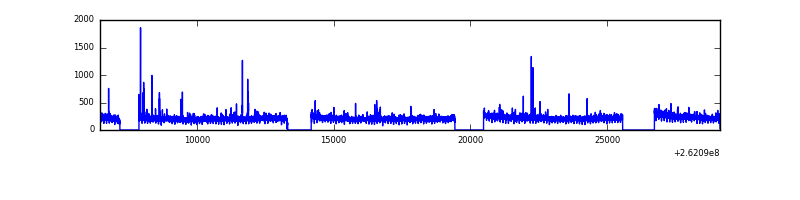 |
| B | 22679 | 18900 | 0 | 0 | 0.00% | 0.00% |  |
| C | 22680 | 18901 | 0 | 0 | 0.00% | 0.00% |  |
| D | 22680 | 18895 | 0 | 0 | 0.00% | 0.00% |  |
Top three noisy pixels from each quadrant. If the there are fewer than three noisy pixels in the level2.evt file, extra rows are filled as -1
| Pixel properties | Quadrant properties | ||||||
|---|---|---|---|---|---|---|---|
| Quadrant | DetID | PixID | Counts | Sigma | Mean | Median | Sigma |
| A | 14 | 188 | 1162 | 11.69 | 294 | 275 | 75.9 |
| A | 0 | 29 | 1121 | 11.15 | 294 | 275 | 75.9 |
| A | 14 | 204 | 1040 | 10.08 | 294 | 275 | 75.9 |
| B | 2 | 9 | 907 | 10.74 | 284 | 270 | 59.3 |
| B | 12 | 226 | 761 | 8.28 | 284 | 270 | 59.3 |
| B | 5 | 128 | 745 | 8.01 | 284 | 270 | 59.3 |
| C | 12 | 250 | 818 | 6.81 | 297 | 277 | 79.5 |
| C | 1 | 65 | 774 | 6.25 | 297 | 277 | 79.5 |
| C | 12 | 241 | 772 | 6.23 | 297 | 277 | 79.5 |
| D | 15 | 46 | 699 | 6.11 | 271 | 247 | 74.0 |
| D | 7 | 3 | 698 | 6.1 | 271 | 247 | 74.0 |
| D | 10 | 189 | 695 | 6.06 | 271 | 247 | 74.0 |
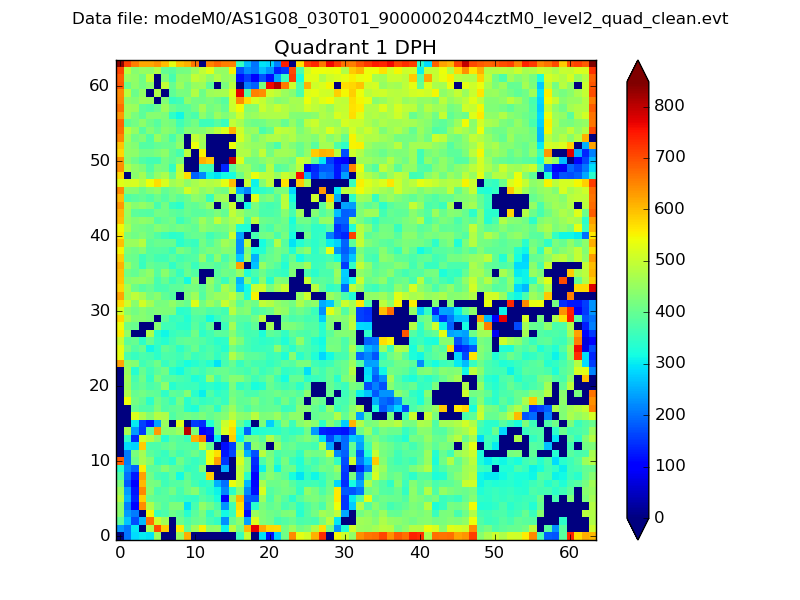
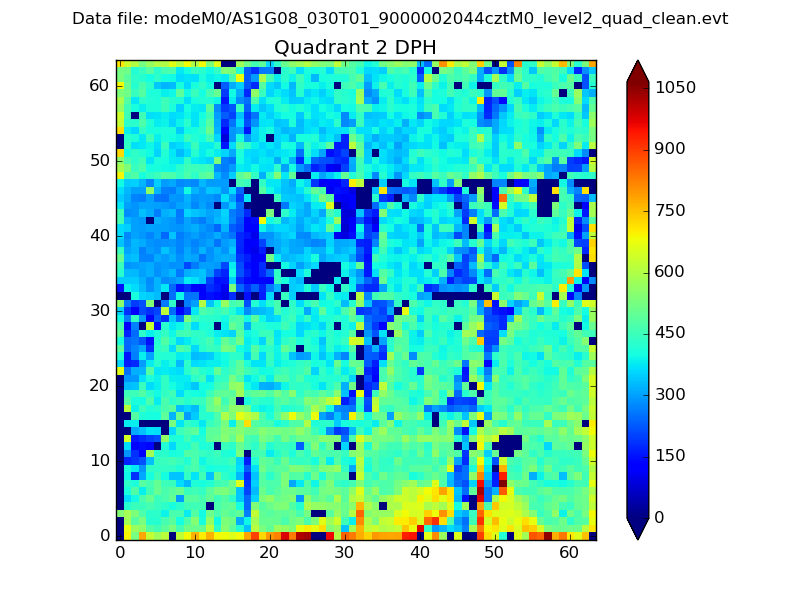
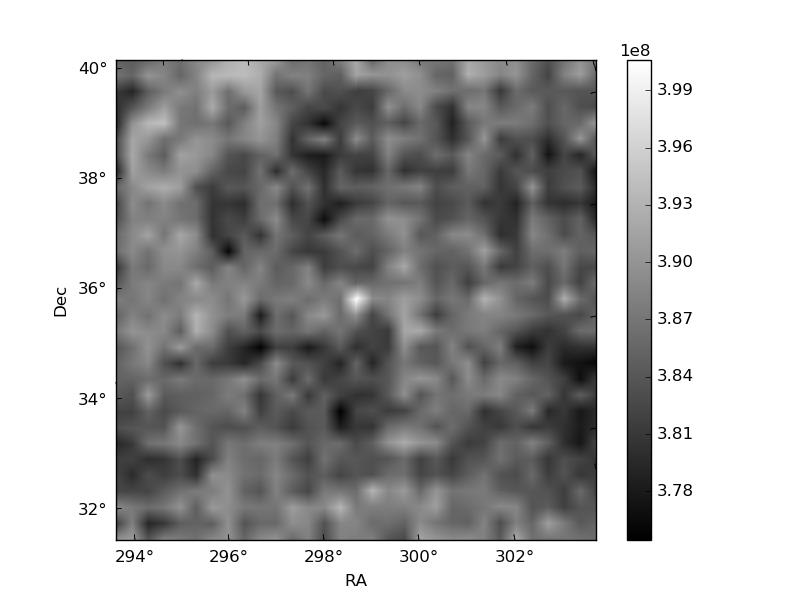
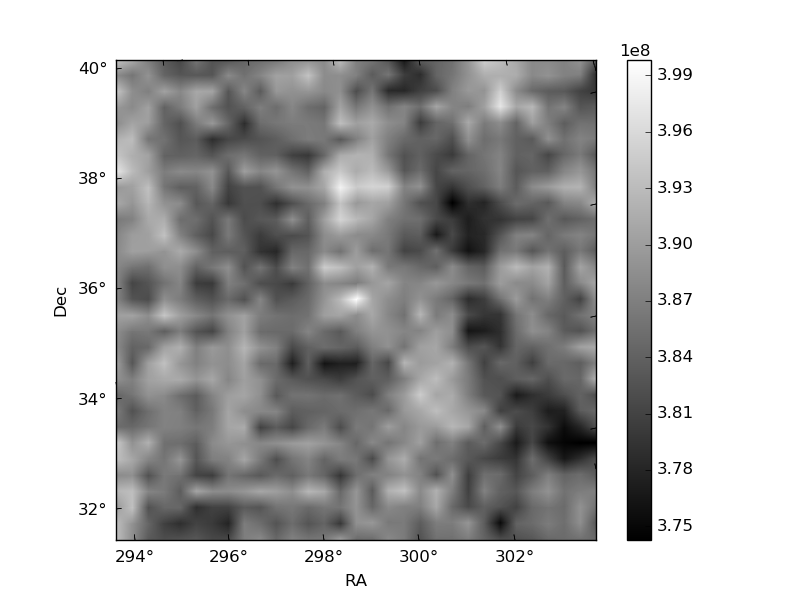
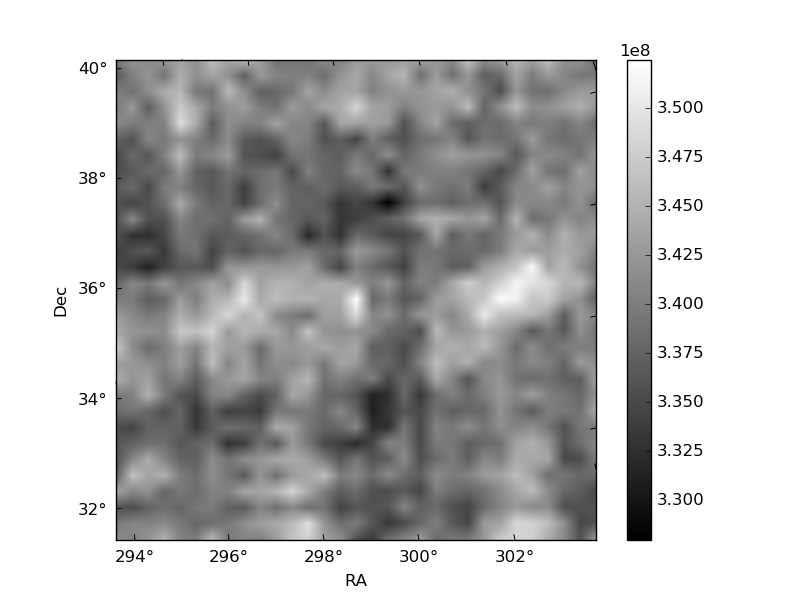
Histogram calculated using DETX and DETY for each event in the final _common_clean file
| Quadrant A |  |
 |
Quadrant B |
|---|---|---|---|
| Quadrant D |  |
 |
Quadrant C |
| Plot type | Count rate plots | Images |
|---|---|---|
| Comparison with Poisson distribution Blue bars denote a histogram of data divided into 1 sec bins. Red curve is a Poisson curve with rate = median count rate of data. |
 |
 |
| Quadrant-wise count rates Data is divided into 100 sec bins |
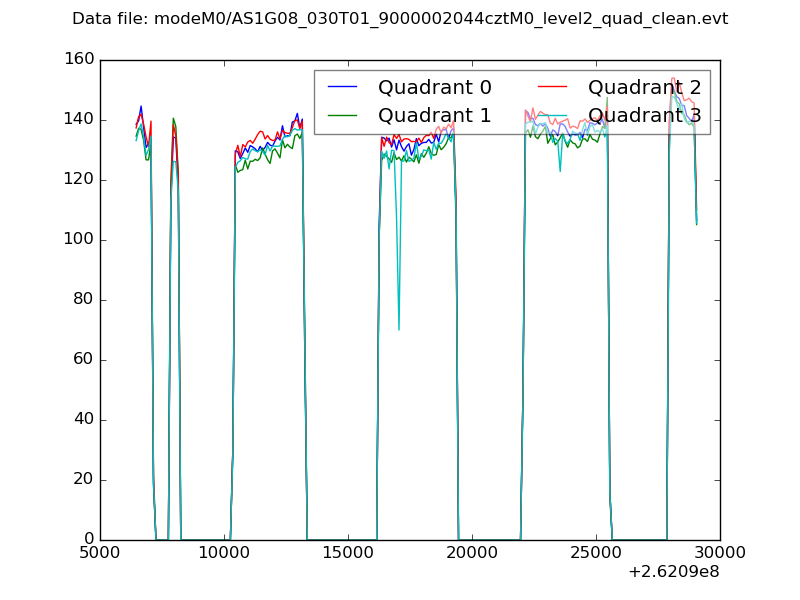 |
|
| Module-wise count rates for Quadrant A Data is divided into 100 sec bins |
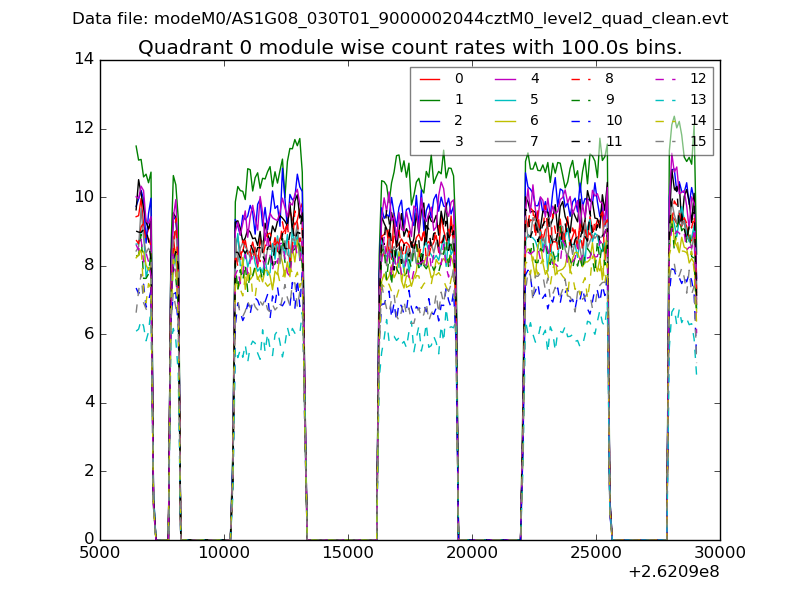 |
 |
| Module-wise count rates for Quadrant B Data is divided into 100 sec bins |
 |
 |
| Module-wise count rates for Quadrant C Data is divided into 100 sec bins |
 |
 |
| Module-wise count rates for Quadrant D Data is divided into 100 sec bins |
 |
 |
| Parameter | Plot |
|---|---|
| CZT HV Monitor |  |
| D_VDD | 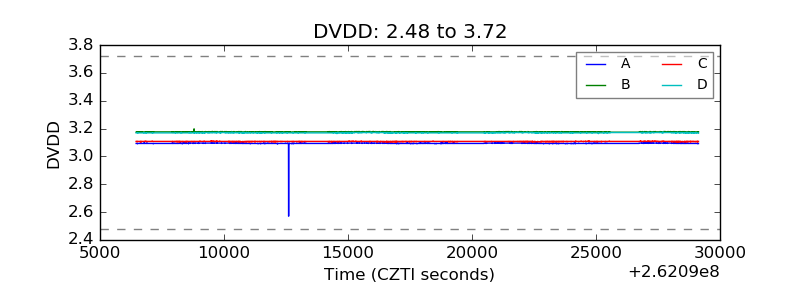 |
| Temperature 1 | 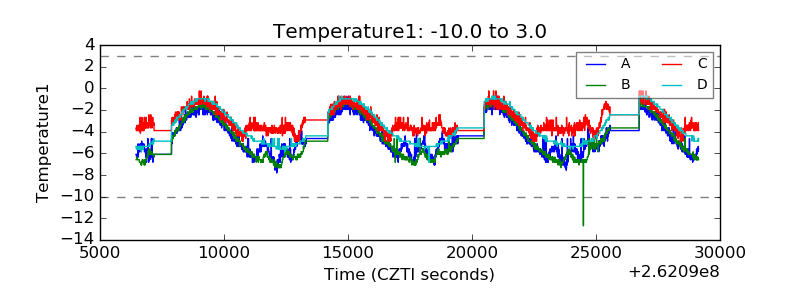 |
| Veto HV Monitor | 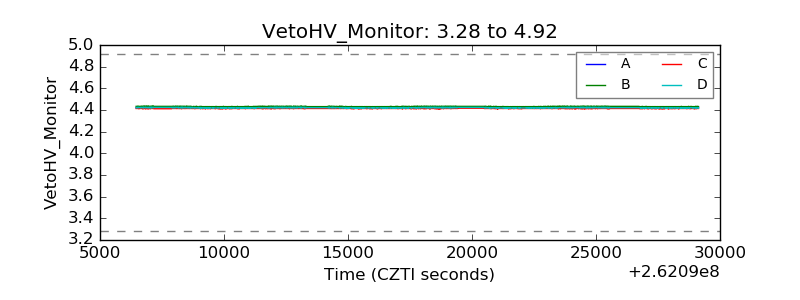 |
| Veto LLD | 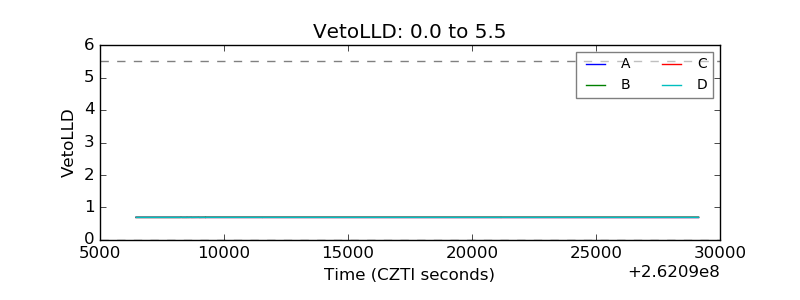 |
| Alpha Counter |  |
| _CPM_Rate | 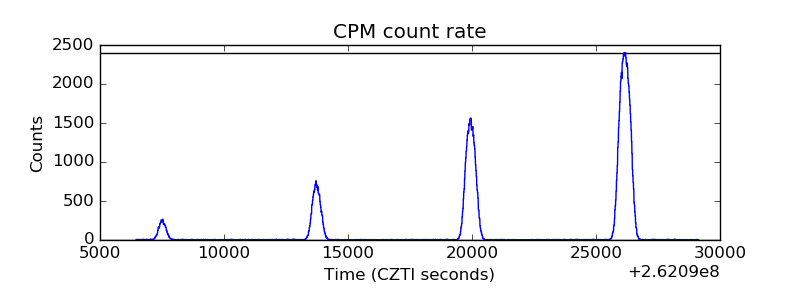 |
| CZT Counter |  |
| +2.5 Volts monitor |  |
| +5 Volts monitor |  |
| _ROLL_ROT | 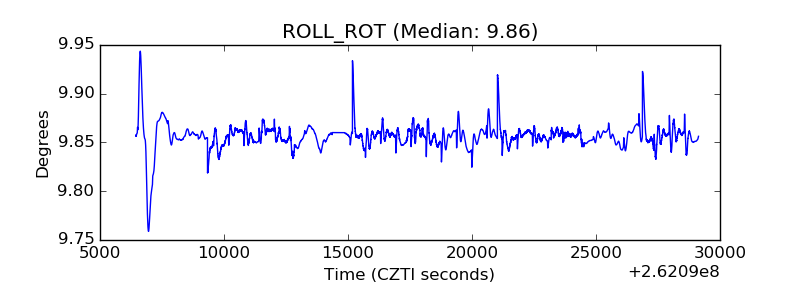 |
| _Roll_DEC |  |
| _Roll_RA |  |
| Veto Counter |  |