| Param | Original file | Final file |
|---|---|---|
| Filename | modeM0/AS1G08_030T01_9000002044_13875cztM0_level2.evt | modeM0/AS1G08_030T01_9000002044_13875cztM0_level2_quad_clean.evt |
| Size (bytes) | 500,065,920 | 72,380,160 |
| Size | 476.9 MB | 69.0 MB |
| Events in quadrant A | 3,334,125 | 431,151 |
| Events in quadrant B | 3,583,281 | 421,716 |
| Events in quadrant C | 3,226,350 | 437,712 |
| Events in quadrant D | 4,536,986 | 425,018 |
| Mode M0 | |||
|---|---|---|---|
| Quadrant | BADHDUFLAG | Total packets | Discarded packets |
| A | 0 | 14126 | 3 |
| B | 0 | 14885 | 2 |
| C | 0 | 13965 | 2 |
| D | 0 | 17875 | 2 |
| Mode M9 | |||
|---|---|---|---|
| Quadrant | BADHDUFLAG | Total packets | Discarded packets |
| A | 0 | 9 | 0 |
| B | 0 | 9 | 0 |
| C | 0 | 9 | 0 |
| D | 0 | 10 | 0 |
| Mode SS | |||
|---|---|---|---|
| Quadrant | BADHDUFLAG | Total packets | Discarded packets |
| A | 0 | 140 | 0 |
| B | 0 | 140 | 0 |
| C | 0 | 140 | 0 |
| D | 0 | 140 | 0 |
| Quadrant | Total seconds | Saturated seconds | Saturation percentage |
|---|---|---|---|
| A | 6825 | 91 | 1.333333% |
| B | 6825 | 122 | 1.787546% |
| C | 6825 | 68 | 0.996337% |
| D | 6825 | 380 | 5.567766% |
Noise dominated data is calculated using 1-second bins in cleaned event files. If a bin has >2000 counts, and if more than 50% of those come from <1% of pixels, then it is considered to be noise-dominated and hence unusable.
| Quadrant | # 1 sec bins | Bins with >0 counts | Bins with >2000 counts | High rate bins dominated by noise | Noise dominated (total time) | Noise dominated (detector-on time) | Marked lightcurve |
|---|---|---|---|---|---|---|---|
| A | 7686 | 6826 | 1 | 1 | 0.01% | 0.01% | 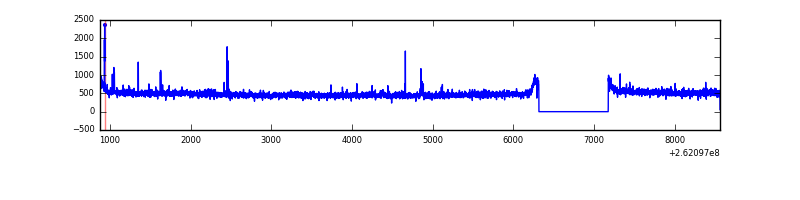 |
| B | 7686 | 6826 | 26 | 26 | 0.34% | 0.38% | 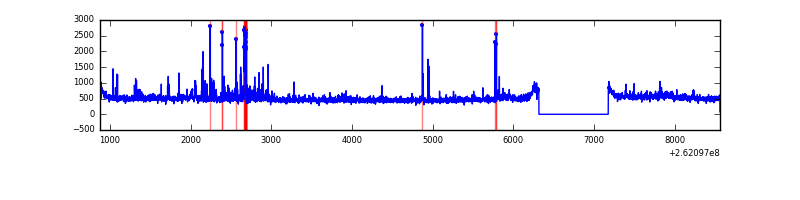 |
| C | 7686 | 6826 | 0 | 0 | 0.00% | 0.00% | 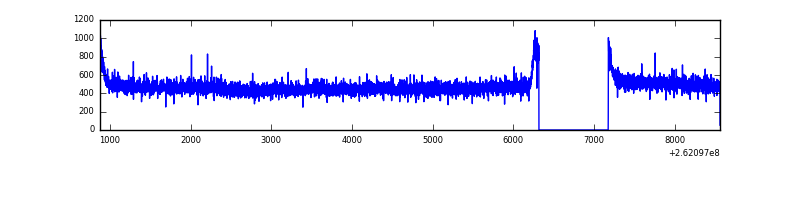 |
| D | 7686 | 6826 | 241 | 241 | 3.14% | 3.53% | 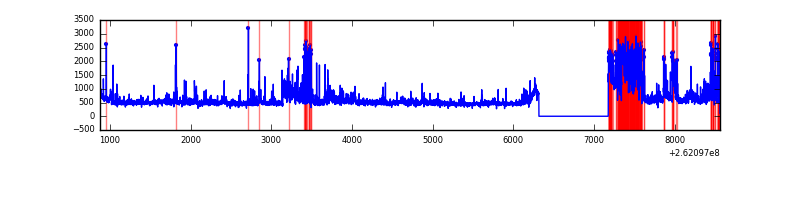 |
Top three noisy pixels from each quadrant. If the there are fewer than three noisy pixels in the level2.evt file, extra rows are filled as -1
| Pixel properties | Quadrant properties | ||||||
|---|---|---|---|---|---|---|---|
| Quadrant | DetID | PixID | Counts | Sigma | Mean | Median | Sigma |
| A | 4 | 2 | 31186 | 176.94 | 845 | 827 | 171.6 |
| A | 0 | 23 | 21730 | 121.83 | 845 | 827 | 171.6 |
| A | 1 | 162 | 17519 | 97.28 | 845 | 827 | 171.6 |
| B | 10 | 245 | 139387 | 859.44 | 835 | 813 | 161.2 |
| B | 3 | 209 | 46315 | 282.21 | 835 | 813 | 161.2 |
| B | 0 | 230 | 44467 | 270.74 | 835 | 813 | 161.2 |
| C | 3 | 233 | 30114 | 152.45 | 820 | 826 | 192.1 |
| C | 13 | 61 | 5940 | 26.62 | 820 | 826 | 192.1 |
| C | 14 | 234 | 2056 | 6.4 | 820 | 826 | 192.1 |
| D | 13 | 122 | 701644 | 3524.74 | 803 | 782 | 198.8 |
| D | 5 | 222 | 437990 | 2198.79 | 803 | 782 | 198.8 |
| D | 10 | 157 | 121919 | 609.22 | 803 | 782 | 198.8 |
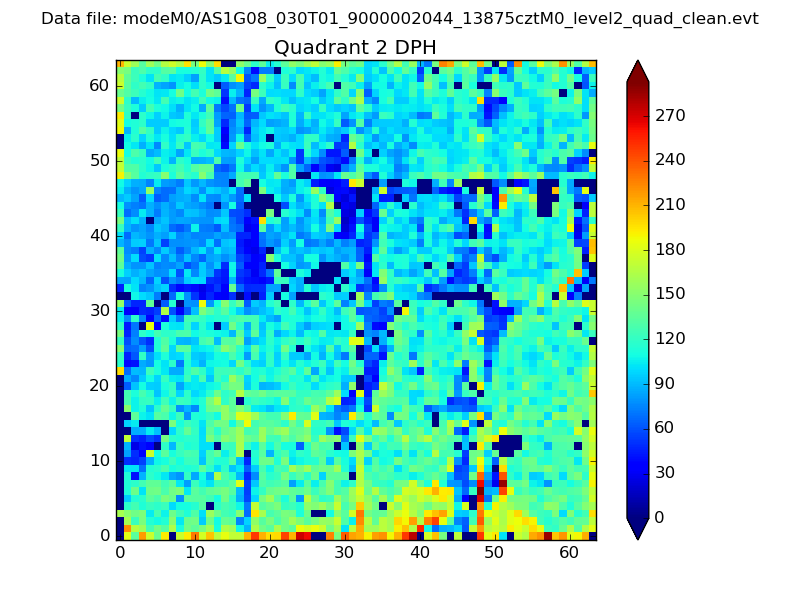
Histogram calculated using DETX and DETY for each event in the final _common_clean file
| Quadrant A | 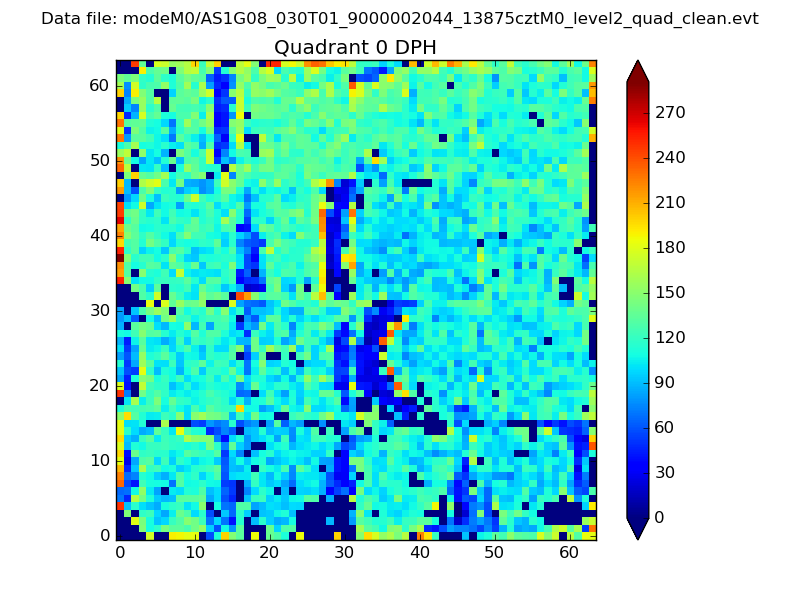 |
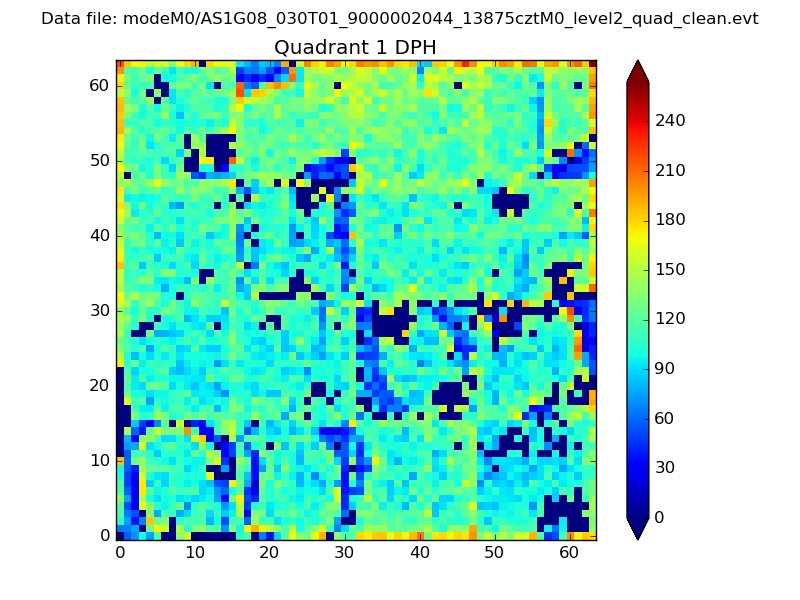 |
Quadrant B |
|---|---|---|---|
| Quadrant D | 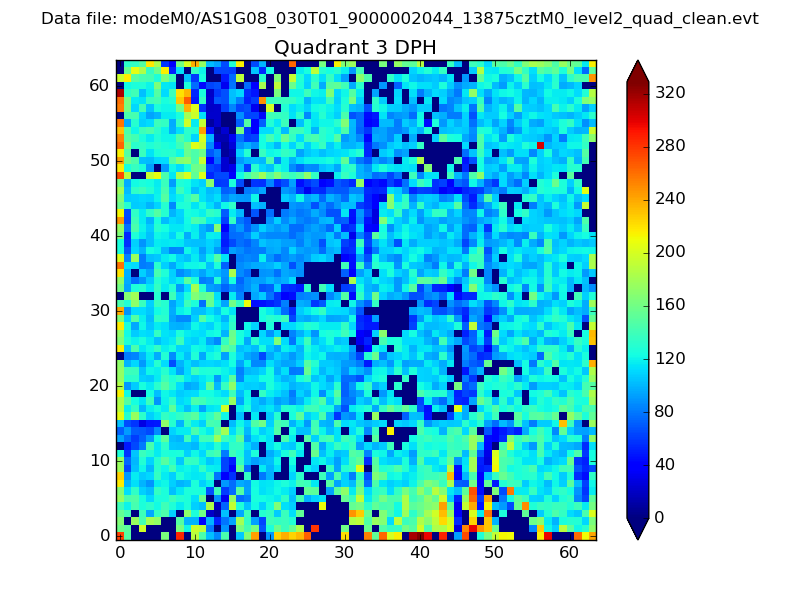 |
 |
Quadrant C |
| Plot type | Count rate plots | Images |
|---|---|---|
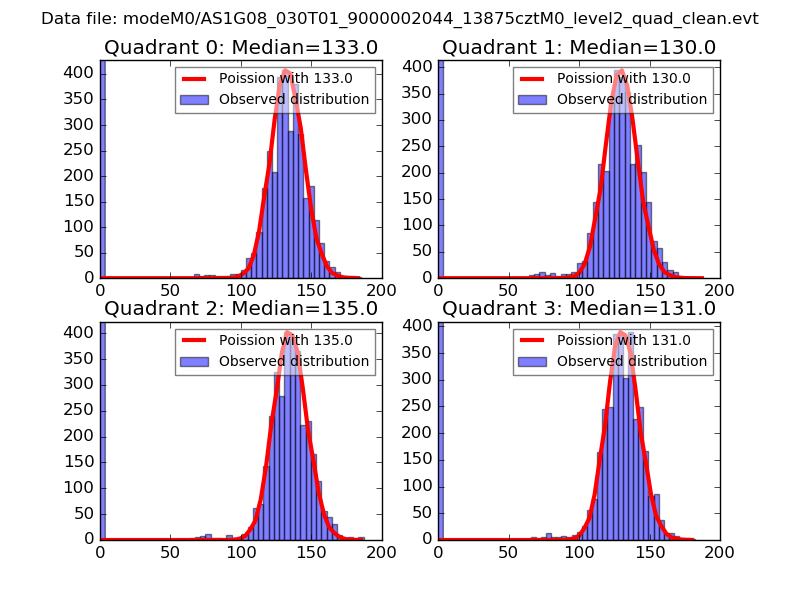
| Comparison with Poisson distribution Blue bars denote a histogram of data divided into 1 sec bins. Red curve is a Poisson curve with rate = median count rate of data. |
 |
 |
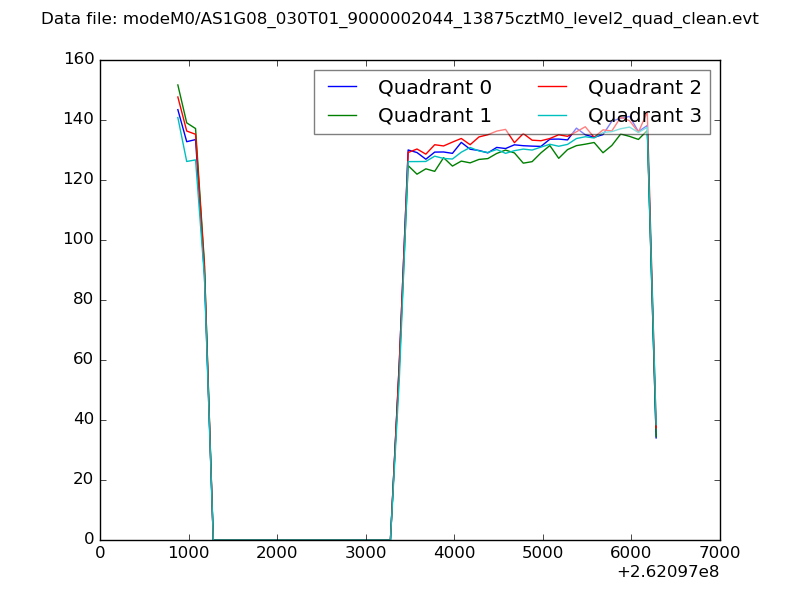
| Quadrant-wise count rates Data is divided into 100 sec bins |
 |
|
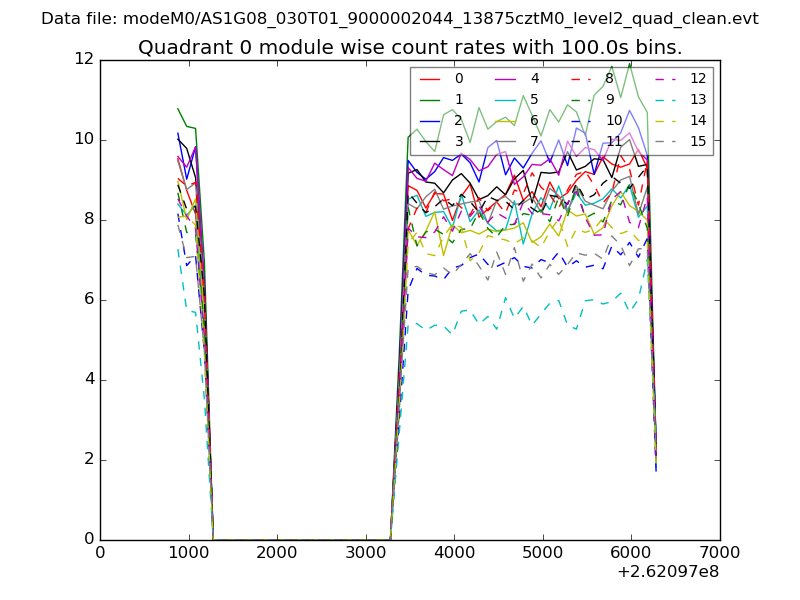
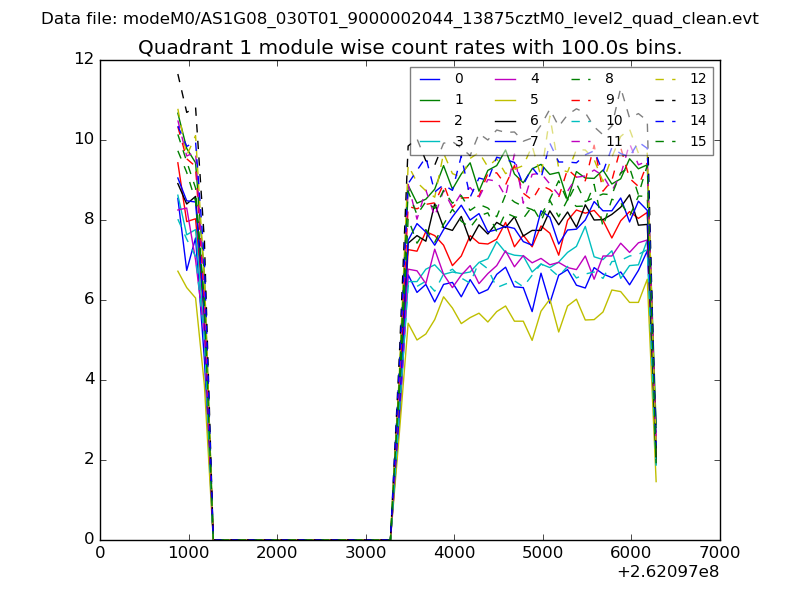
| Module-wise count rates for Quadrant A Data is divided into 100 sec bins |
 |
 |
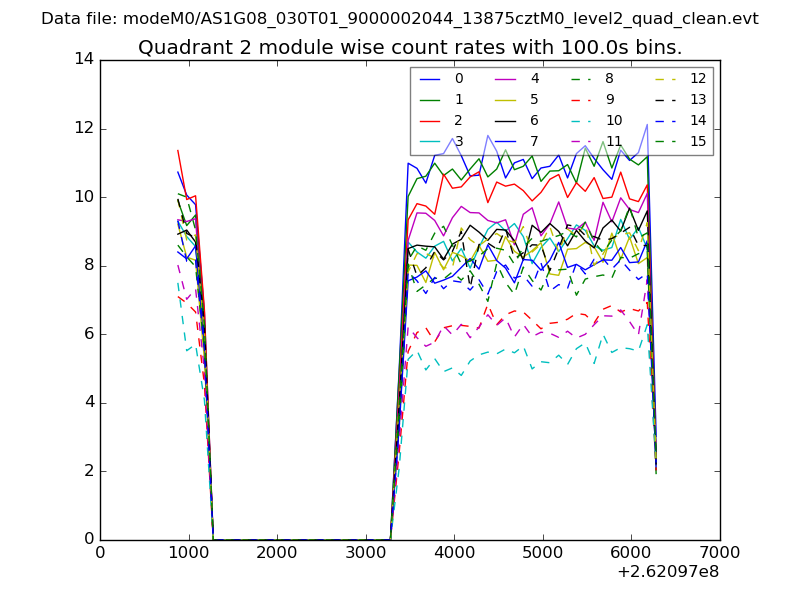
| Module-wise count rates for Quadrant B Data is divided into 100 sec bins |
 |
 |
| Module-wise count rates for Quadrant C Data is divided into 100 sec bins |
 |
 |
| Module-wise count rates for Quadrant D Data is divided into 100 sec bins |
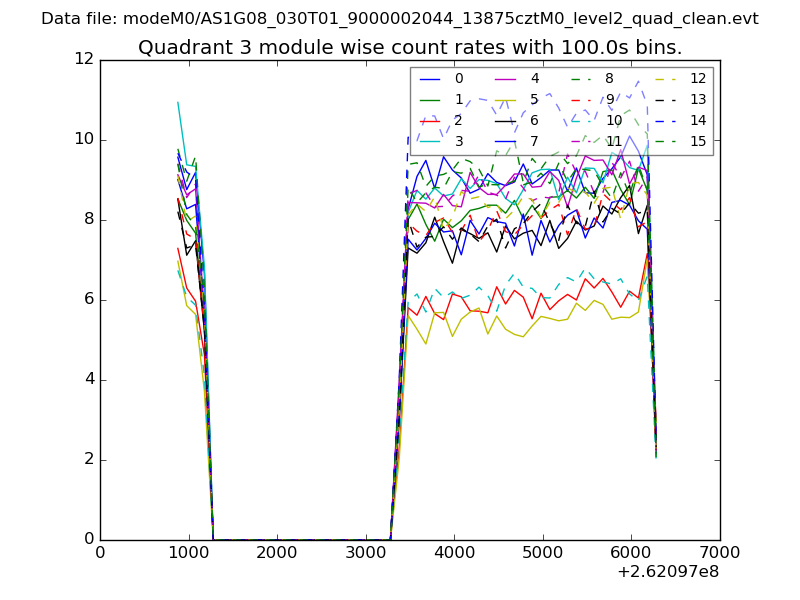 |
 |
| Parameter | Plot |
|---|---|
| CZT HV Monitor | 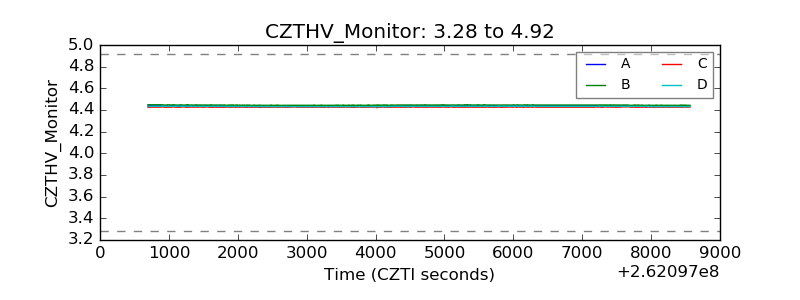 |
| D_VDD | 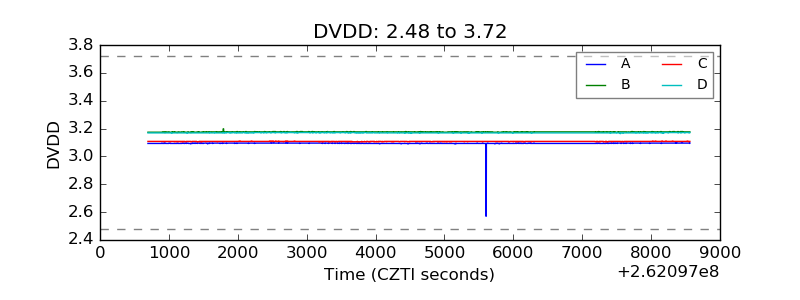 |
| Temperature 1 | 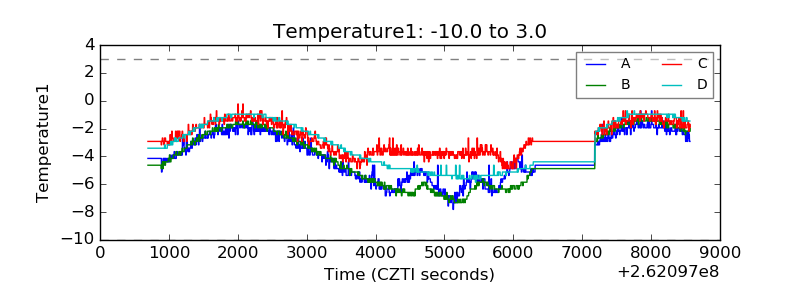 |
| Veto HV Monitor | 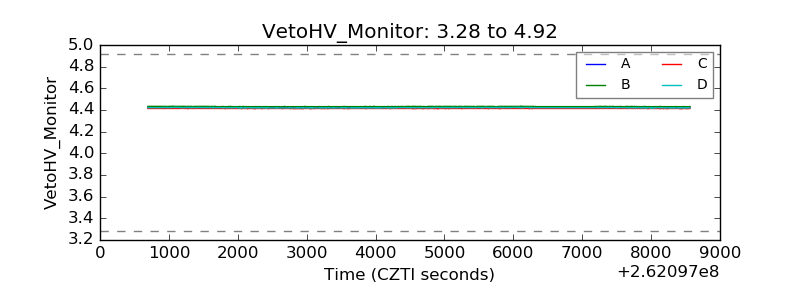 |
| Veto LLD | 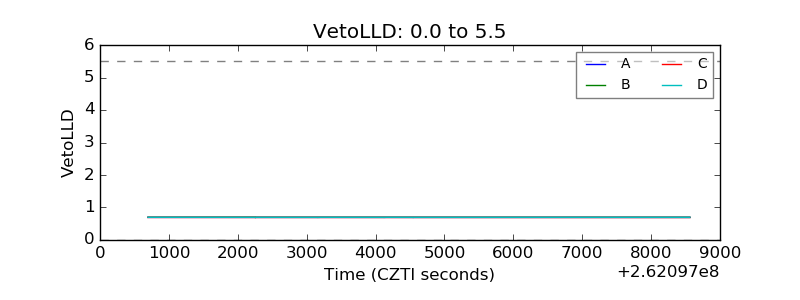 |
| Alpha Counter | 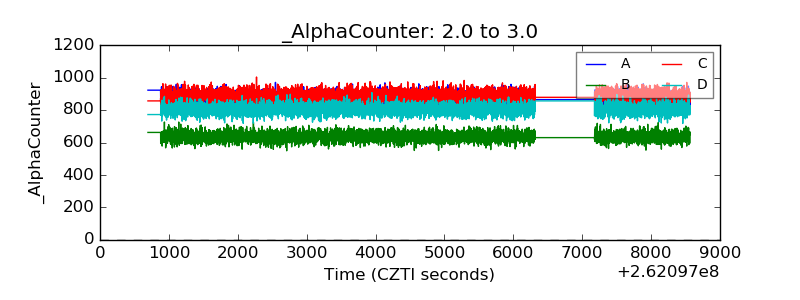 |
| _CPM_Rate | 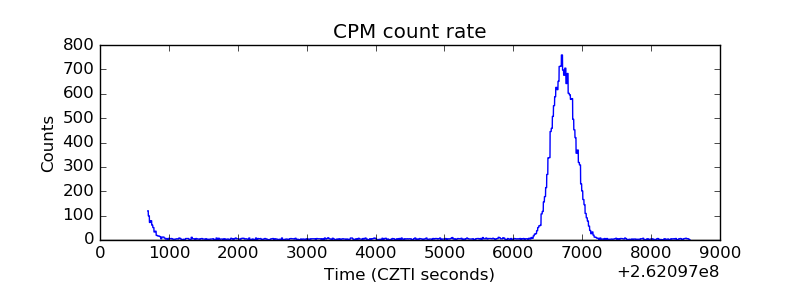 |
| CZT Counter | 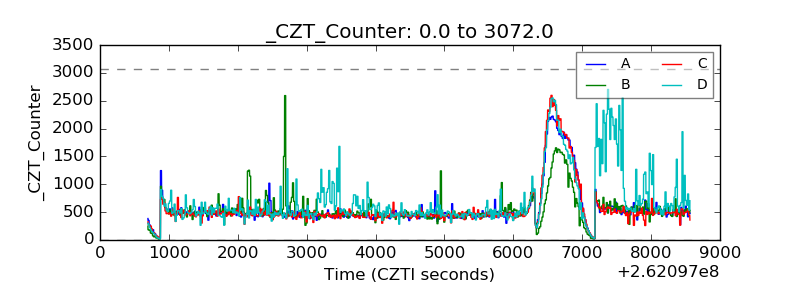 |
| +2.5 Volts monitor | 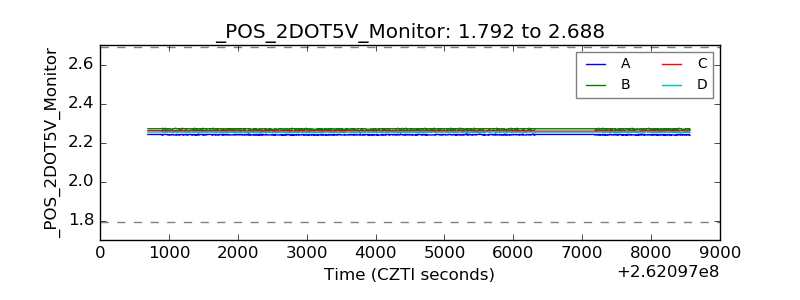 |
| +5 Volts monitor |  |
| _ROLL_ROT | 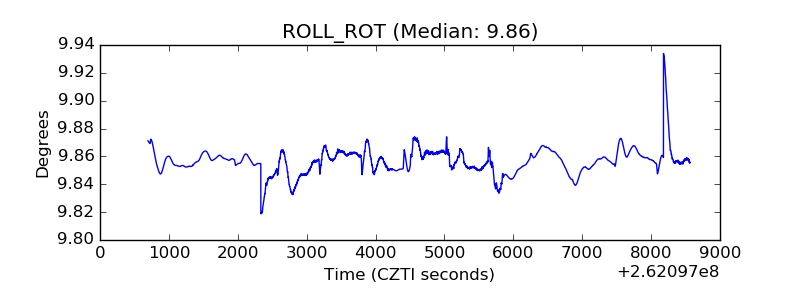 |
| _Roll_DEC | 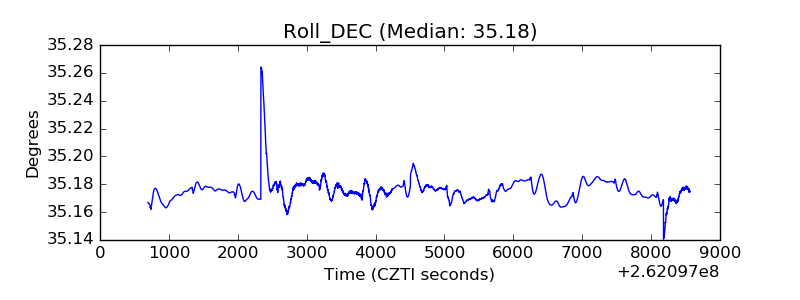 |
| _Roll_RA | 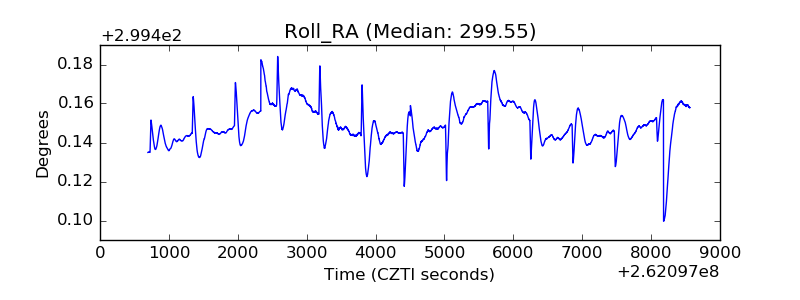 |
| Veto Counter | 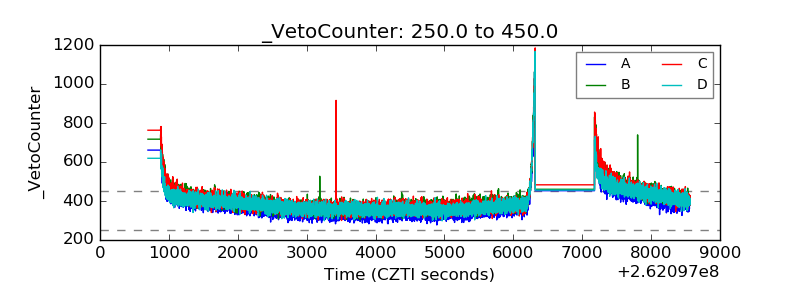 |