| Param | Original file | Final file |
|---|---|---|
| Filename | modeM0/AS1G08_030T01_9000002044_13876cztM0_level2.evt | modeM0/AS1G08_030T01_9000002044_13876cztM0_level2_quad_clean.evt |
| Size (bytes) | 973,535,040 | 153,345,600 |
| Size | 928.4 MB | 146.2 MB |
| Events in quadrant A | 6,215,253 | 949,598 |
| Events in quadrant B | 6,647,714 | 924,548 |
| Events in quadrant C | 6,139,571 | 962,044 |
| Events in quadrant D | 9,614,677 | 922,287 |
| Mode M0 | |||
|---|---|---|---|
| Quadrant | BADHDUFLAG | Total packets | Discarded packets |
| A | 0 | 26580 | 4 |
| B | 0 | 27730 | 3 |
| C | 0 | 26399 | 3 |
| D | 0 | 37044 | 3 |
| Mode M9 | |||
|---|---|---|---|
| Quadrant | BADHDUFLAG | Total packets | Discarded packets |
| A | 0 | 25 | 0 |
| B | 0 | 25 | 0 |
| C | 0 | 25 | 0 |
| D | 0 | 25 | 0 |
| Mode SS | |||
|---|---|---|---|
| Quadrant | BADHDUFLAG | Total packets | Discarded packets |
| A | 0 | 264 | 0 |
| B | 0 | 264 | 0 |
| C | 0 | 264 | 0 |
| D | 0 | 264 | 0 |
| Quadrant | Total seconds | Saturated seconds | Saturation percentage |
|---|---|---|---|
| A | 12805 | 191 | 1.491605% |
| B | 12805 | 234 | 1.827411% |
| C | 12805 | 153 | 1.194846% |
| D | 12805 | 956 | 7.465834% |
Noise dominated data is calculated using 1-second bins in cleaned event files. If a bin has >2000 counts, and if more than 50% of those come from <1% of pixels, then it is considered to be noise-dominated and hence unusable.
| Quadrant | # 1 sec bins | Bins with >0 counts | Bins with >2000 counts | High rate bins dominated by noise | Noise dominated (total time) | Noise dominated (detector-on time) | Marked lightcurve |
|---|---|---|---|---|---|---|---|
| A | 15416 | 12806 | 1 | 1 | 0.01% | 0.01% | 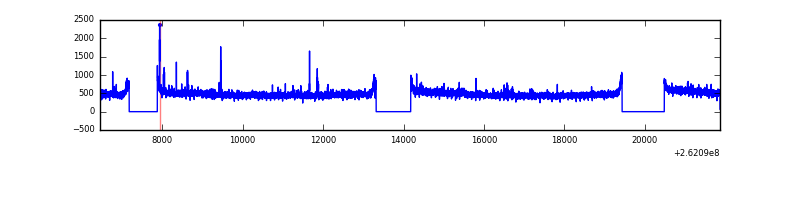 |
| B | 15416 | 12806 | 31 | 31 | 0.20% | 0.24% | 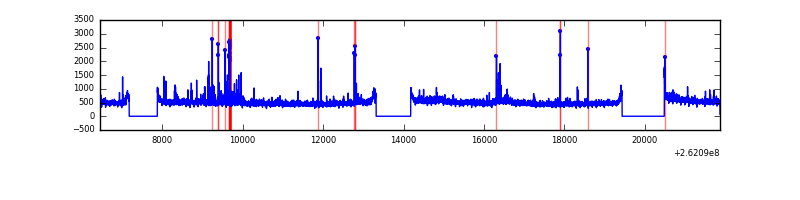 |
| C | 15416 | 12806 | 0 | 0 | 0.00% | 0.00% | 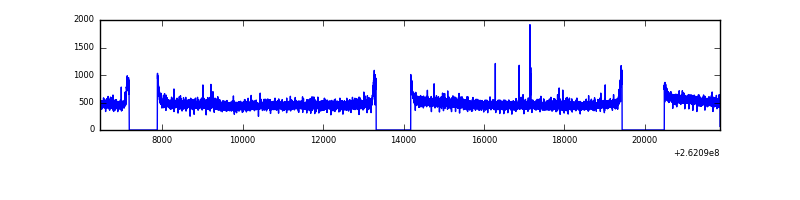 |
| D | 15416 | 12806 | 652 | 652 | 4.23% | 5.09% | 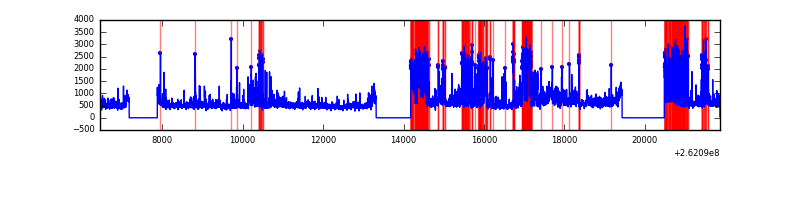 |
Top three noisy pixels from each quadrant. If the there are fewer than three noisy pixels in the level2.evt file, extra rows are filled as -1
| Pixel properties | Quadrant properties | ||||||
|---|---|---|---|---|---|---|---|
| Quadrant | DetID | PixID | Counts | Sigma | Mean | Median | Sigma |
| A | 4 | 2 | 34624 | 103.1 | 1590 | 1560 | 320.7 |
| A | 0 | 23 | 29532 | 87.22 | 1590 | 1560 | 320.7 |
| A | 1 | 162 | 25400 | 74.34 | 1590 | 1560 | 320.7 |
| B | 10 | 245 | 142071 | 468.67 | 1573 | 1535 | 299.9 |
| B | 10 | 244 | 84501 | 276.68 | 1573 | 1535 | 299.9 |
| B | 3 | 209 | 69005 | 225.0 | 1573 | 1535 | 299.9 |
| C | 3 | 233 | 89387 | 242.49 | 1550 | 1560 | 362.2 |
| C | 13 | 61 | 11145 | 26.46 | 1550 | 1560 | 362.2 |
| C | 12 | 4 | 7182 | 15.52 | 1550 | 1560 | 362.2 |
| D | 13 | 122 | 2212972 | 5982.15 | 1503 | 1465 | 369.7 |
| D | 5 | 222 | 725457 | 1958.41 | 1503 | 1465 | 369.7 |
| D | 1 | 52 | 514374 | 1387.42 | 1503 | 1465 | 369.7 |
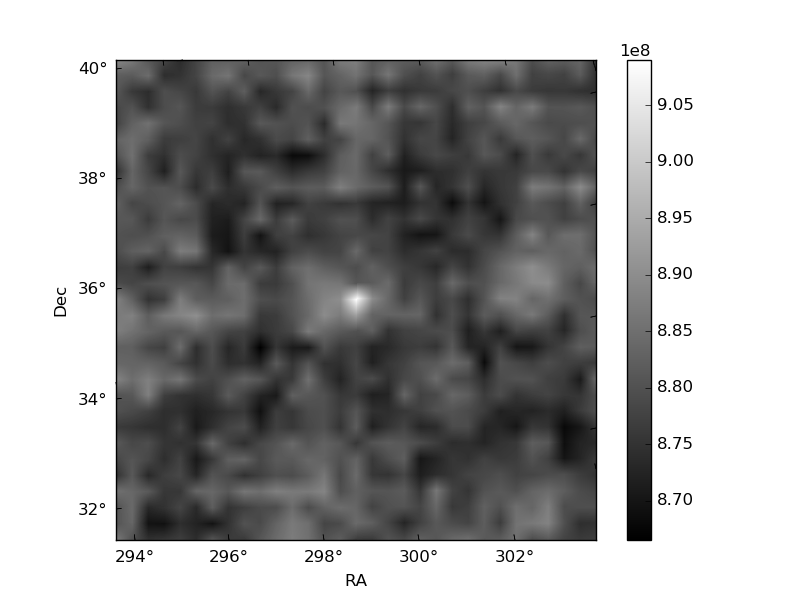
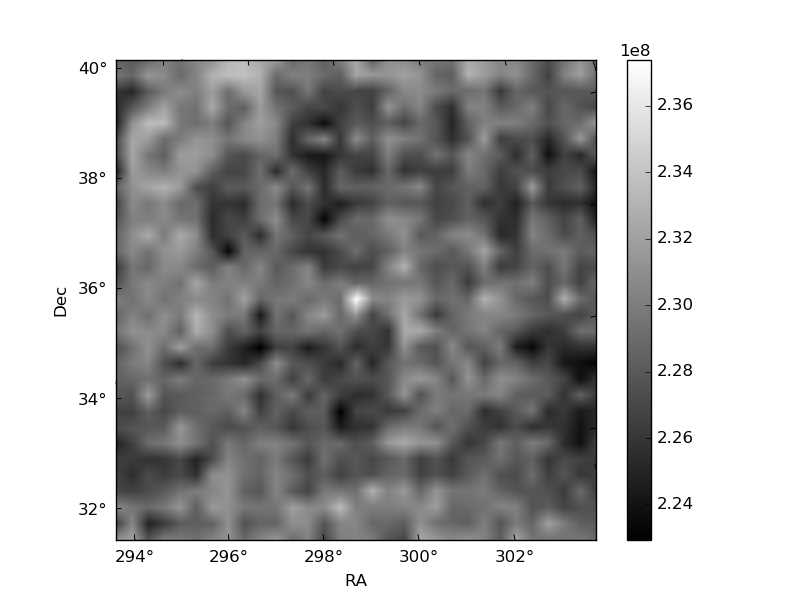
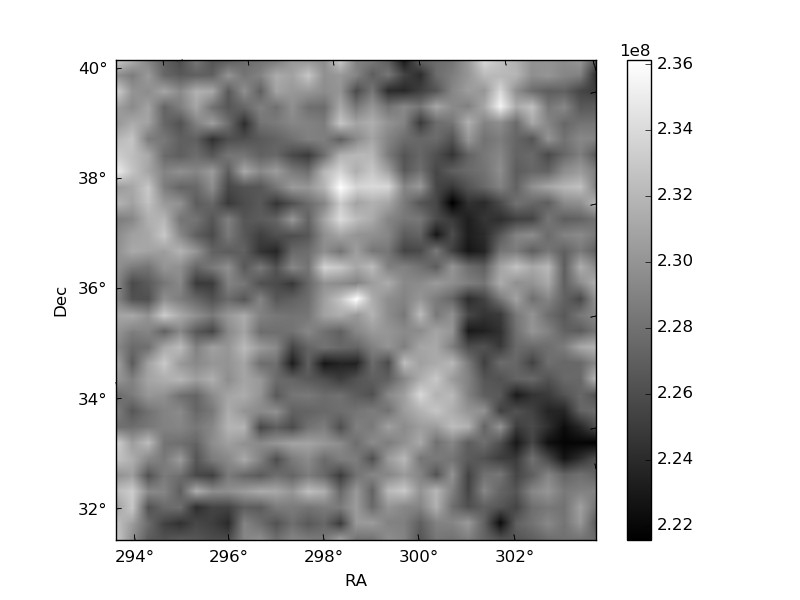
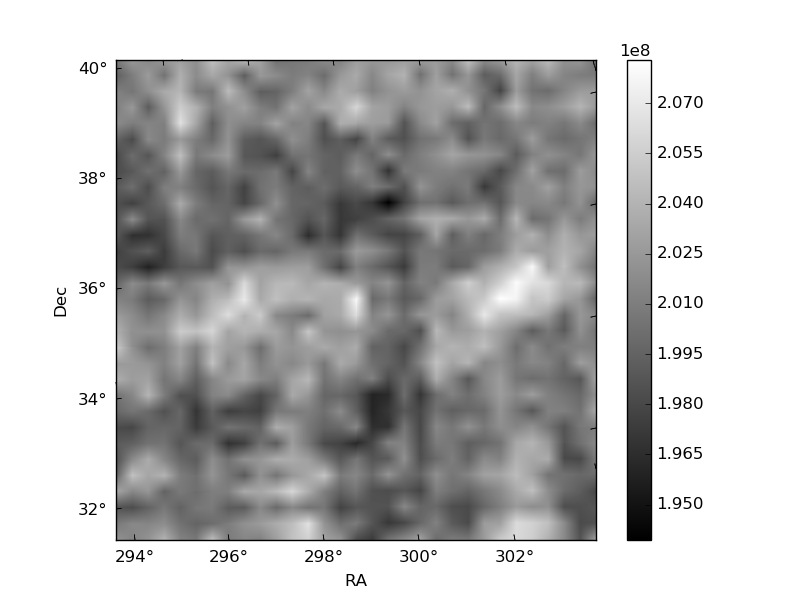
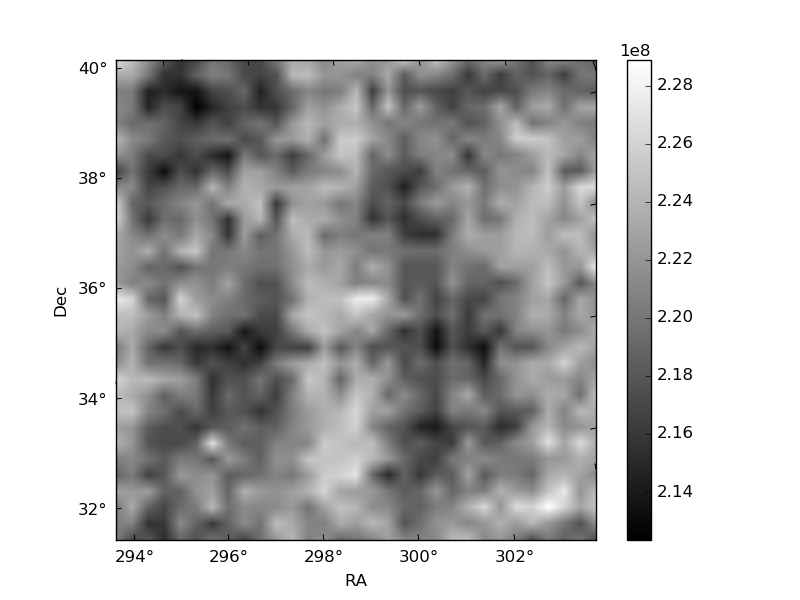
Histogram calculated using DETX and DETY for each event in the final _common_clean file
| Quadrant A | 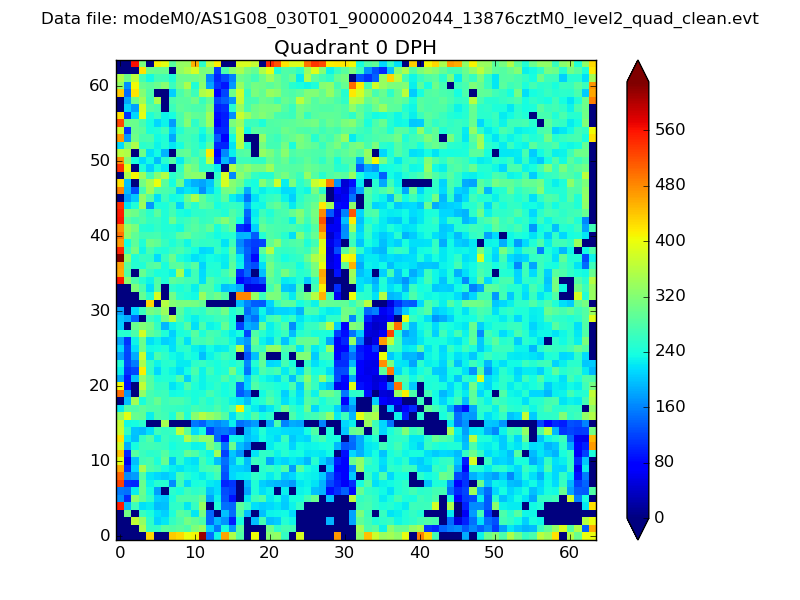 |
 |
Quadrant B |
|---|---|---|---|
| Quadrant D | 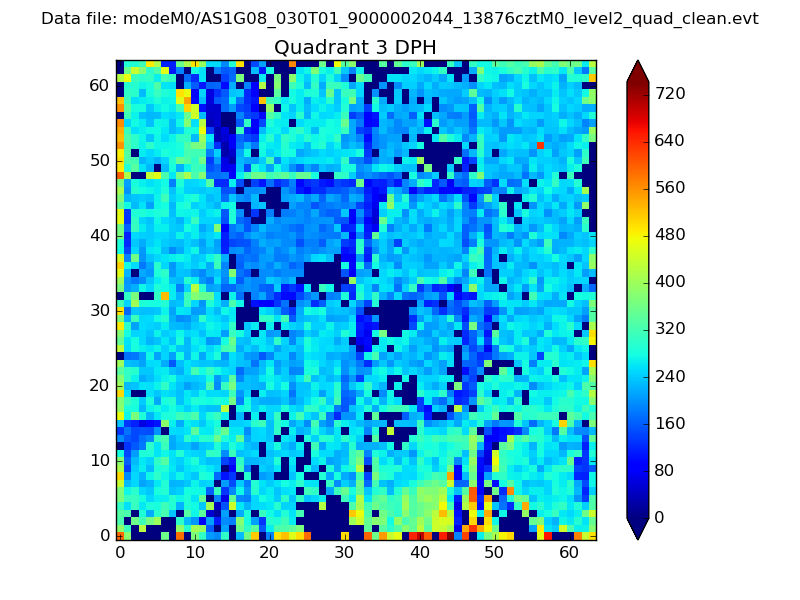 |
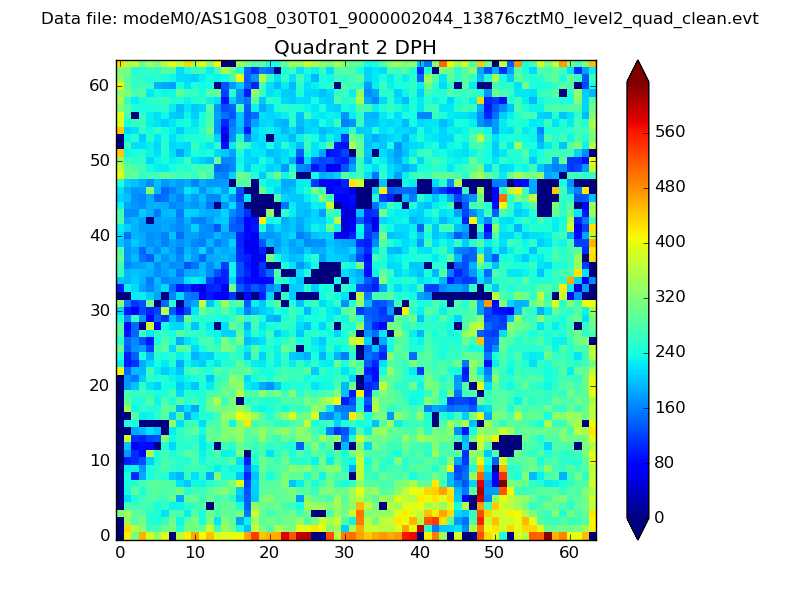 |
Quadrant C |
| Plot type | Count rate plots | Images |
|---|---|---|
| Comparison with Poisson distribution Blue bars denote a histogram of data divided into 1 sec bins. Red curve is a Poisson curve with rate = median count rate of data. |
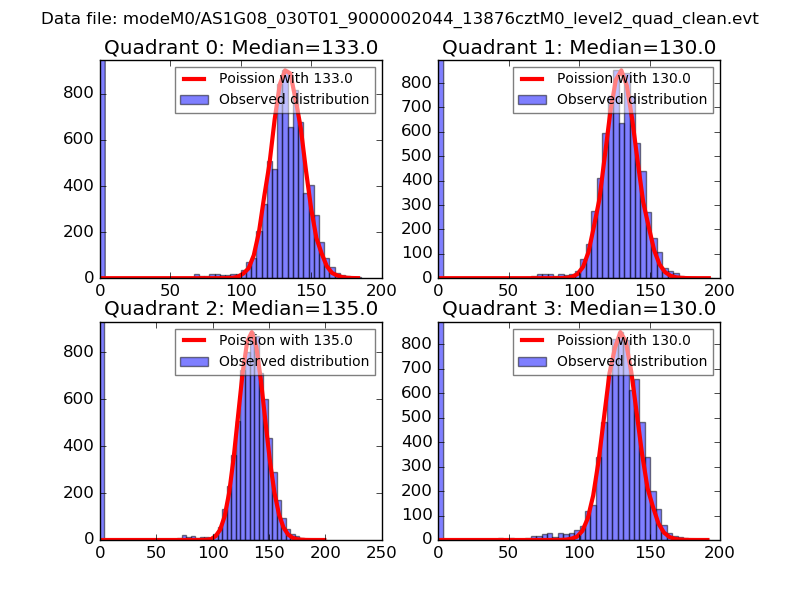 |
 |
| Quadrant-wise count rates Data is divided into 100 sec bins |
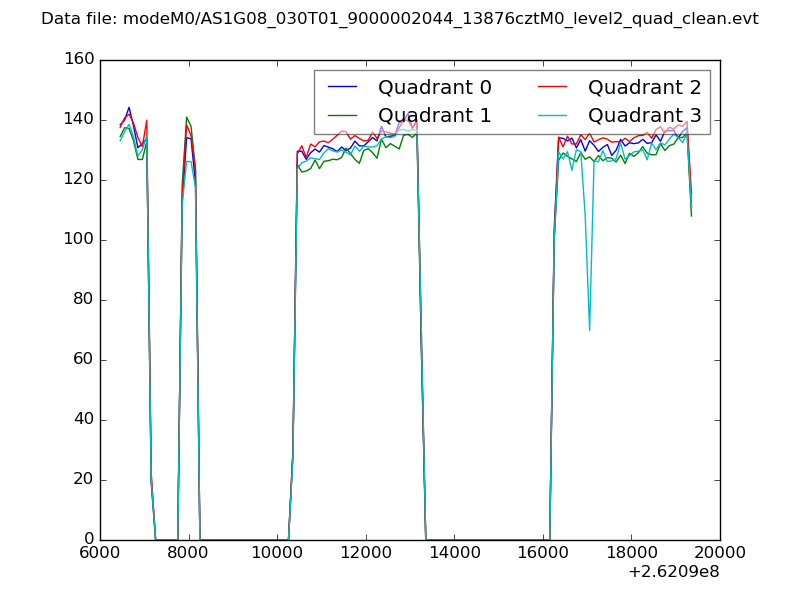 |
|
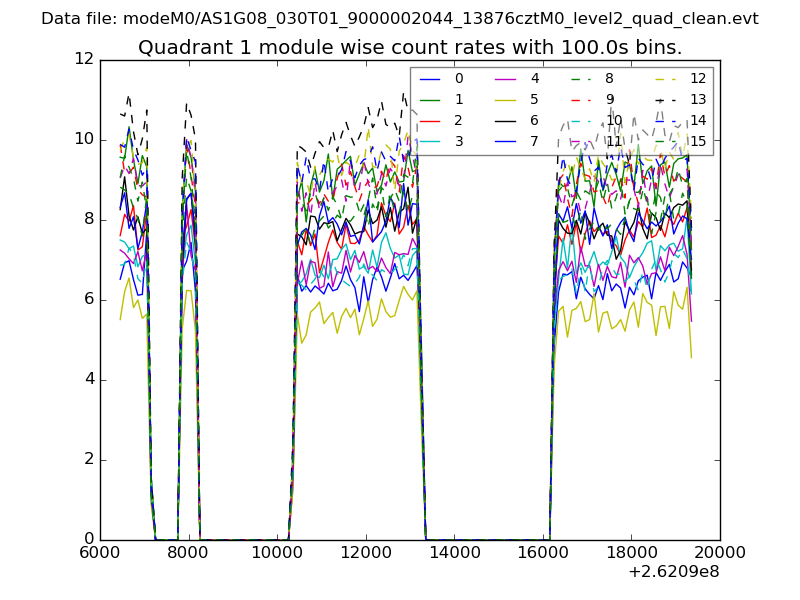
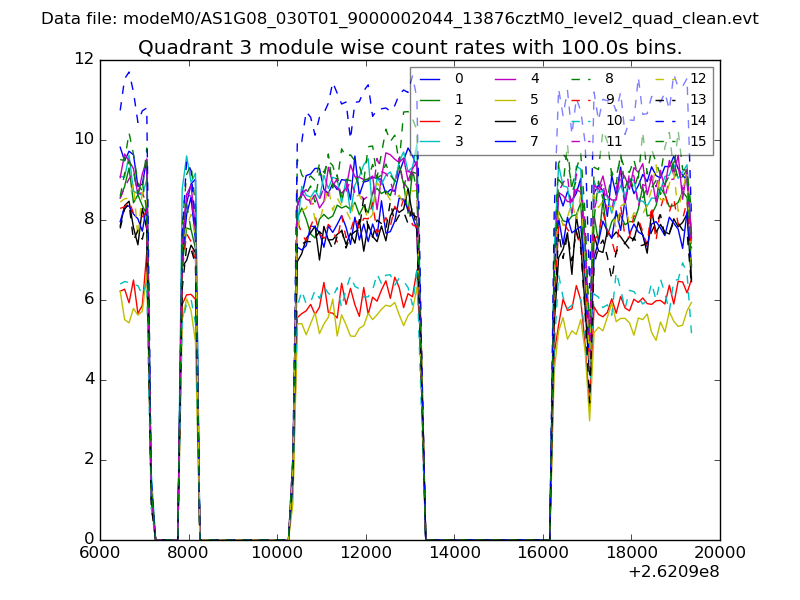
| Module-wise count rates for Quadrant A Data is divided into 100 sec bins |
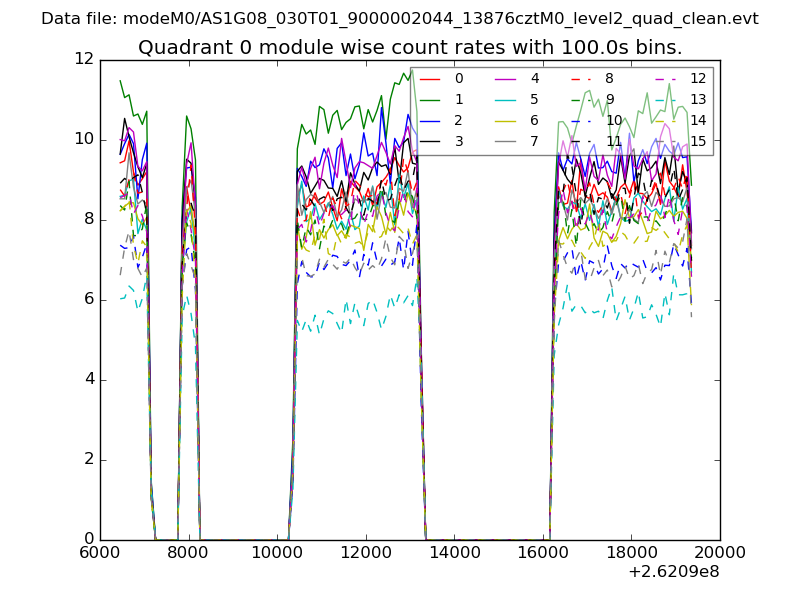 |
 |
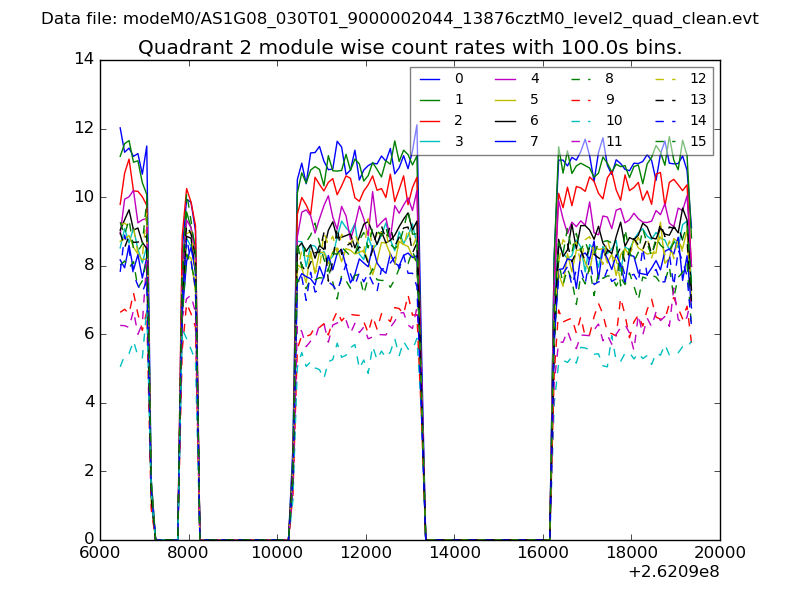
| Module-wise count rates for Quadrant B Data is divided into 100 sec bins |
 |
 |
| Module-wise count rates for Quadrant C Data is divided into 100 sec bins |
 |
 |
| Module-wise count rates for Quadrant D Data is divided into 100 sec bins |
 |
 |
| Parameter | Plot |
|---|---|
| CZT HV Monitor | 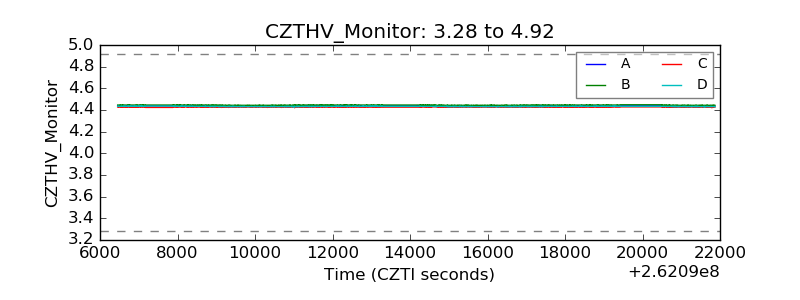 |
| D_VDD | 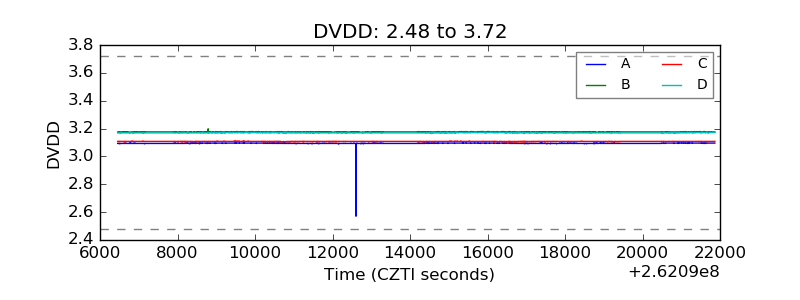 |
| Temperature 1 | 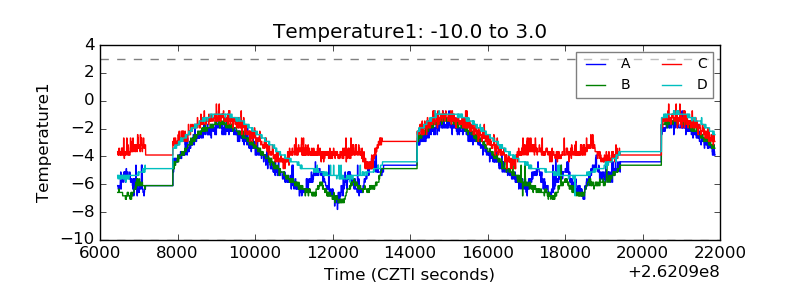 |
| Veto HV Monitor | 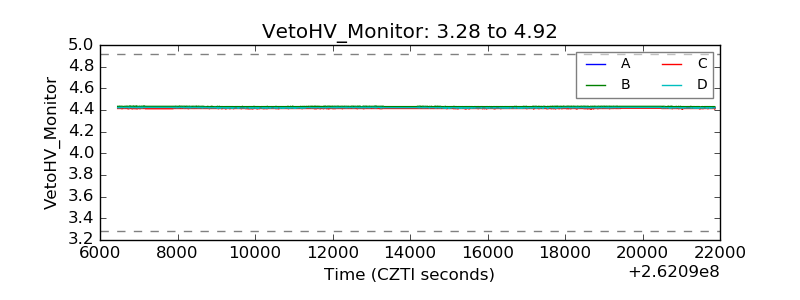 |
| Veto LLD | 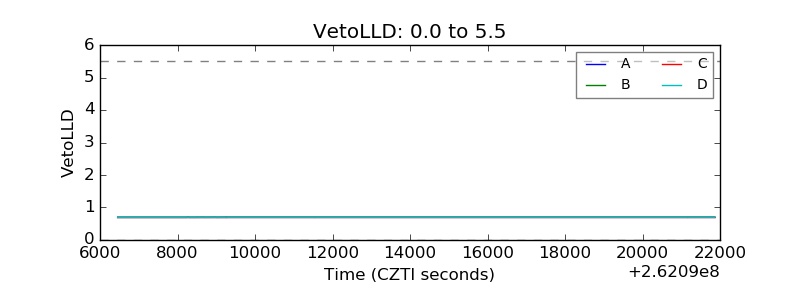 |
| Alpha Counter | 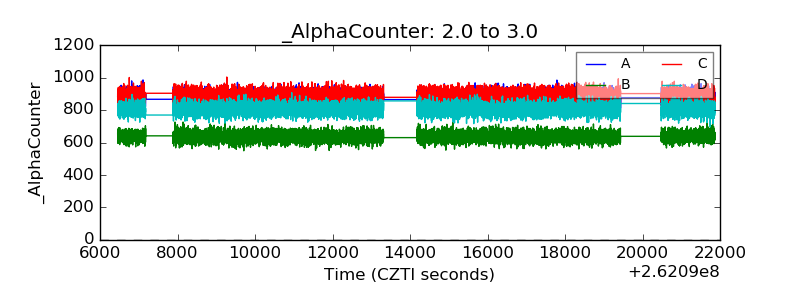 |
| _CPM_Rate | 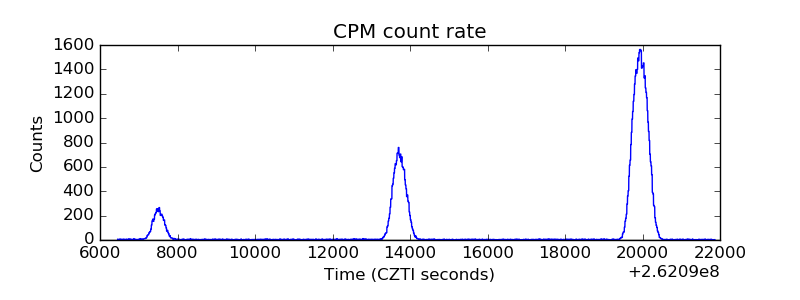 |
| CZT Counter | 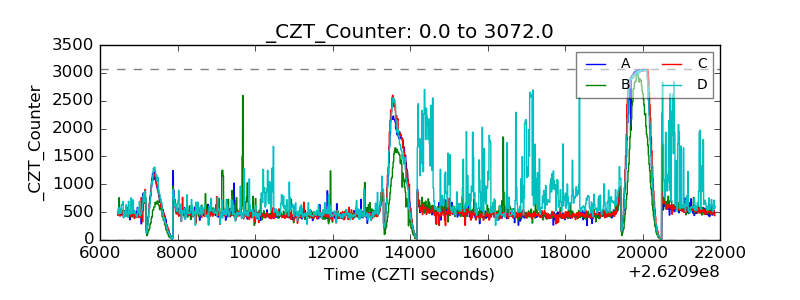 |
| +2.5 Volts monitor |  |
| +5 Volts monitor | 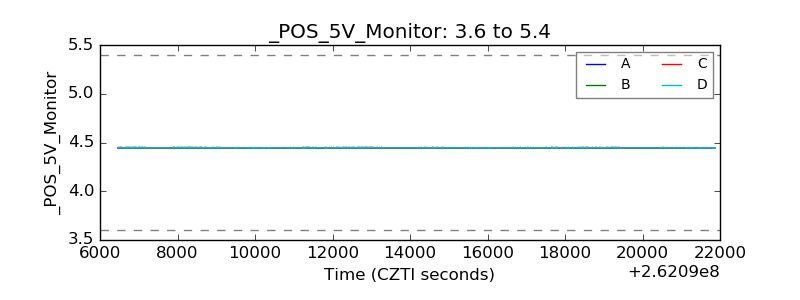 |
| _ROLL_ROT | 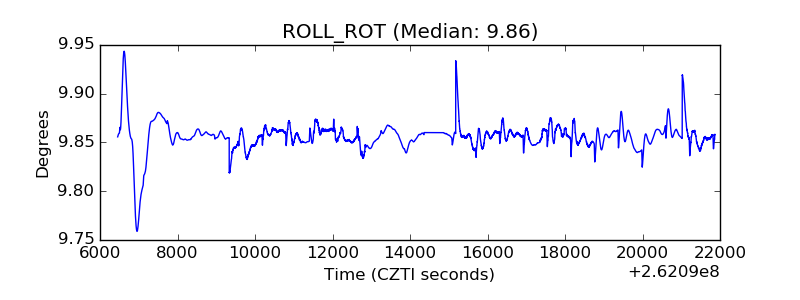 |
| _Roll_DEC | 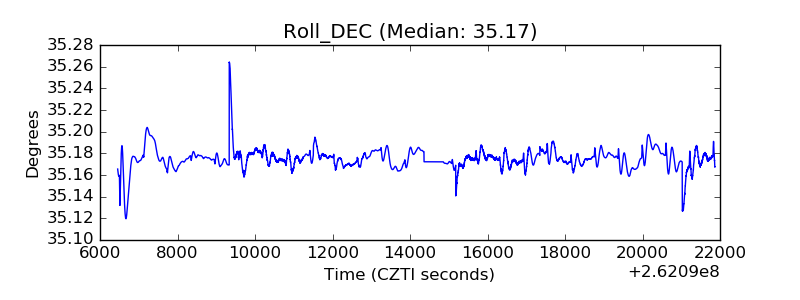 |
| _Roll_RA | 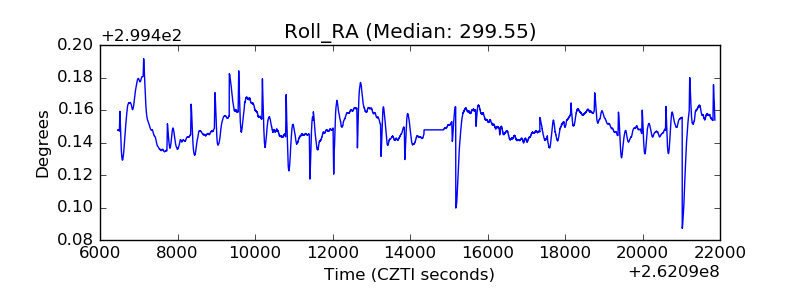 |
| Veto Counter | 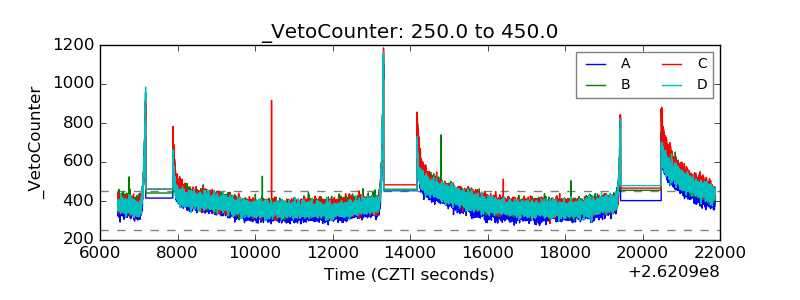 |