| Param | Original file | Final file |
|---|---|---|
| Filename | modeM0/AS1G08_030T01_9000002044_13878cztM0_level2.evt | modeM0/AS1G08_030T01_9000002044_13878cztM0_level2_quad_clean.evt |
| Size (bytes) | 489,562,560 | 79,122,240 |
| Size | 466.9 MB | 75.5 MB |
| Events in quadrant A | 3,238,039 | 490,121 |
| Events in quadrant B | 3,386,857 | 477,905 |
| Events in quadrant C | 3,261,766 | 498,391 |
| Events in quadrant D | 4,504,584 | 482,308 |
| Mode M0 | |||
|---|---|---|---|
| Quadrant | BADHDUFLAG | Total packets | Discarded packets |
| A | 0 | 13754 | 3 |
| B | 0 | 14170 | 2 |
| C | 0 | 13696 | 2 |
| D | 0 | 17766 | 2 |
| Mode M9 | |||
|---|---|---|---|
| Quadrant | BADHDUFLAG | Total packets | Discarded packets |
| A | 0 | 18 | 0 |
| B | 0 | 18 | 0 |
| C | 0 | 18 | 0 |
| D | 0 | 19 | 0 |
| Mode SS | |||
|---|---|---|---|
| Quadrant | BADHDUFLAG | Total packets | Discarded packets |
| A | 0 | 130 | 0 |
| B | 0 | 130 | 0 |
| C | 0 | 130 | 0 |
| D | 0 | 130 | 0 |
| Quadrant | Total seconds | Saturated seconds | Saturation percentage |
|---|---|---|---|
| A | 6411 | 38 | 0.592731% |
| B | 6411 | 53 | 0.826704% |
| C | 6411 | 26 | 0.405553% |
| D | 6411 | 354 | 5.521759% |
Noise dominated data is calculated using 1-second bins in cleaned event files. If a bin has >2000 counts, and if more than 50% of those come from <1% of pixels, then it is considered to be noise-dominated and hence unusable.
| Quadrant | # 1 sec bins | Bins with >0 counts | Bins with >2000 counts | High rate bins dominated by noise | Noise dominated (total time) | Noise dominated (detector-on time) | Marked lightcurve |
|---|---|---|---|---|---|---|---|
| A | 7577 | 6412 | 0 | 0 | 0.00% | 0.00% | 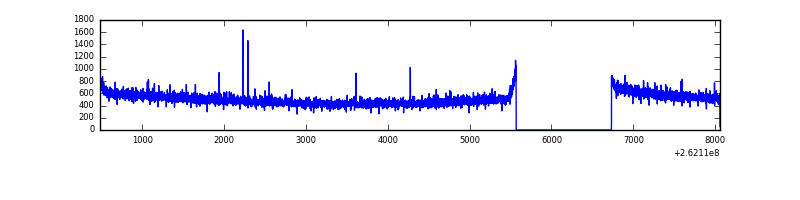 |
| B | 7577 | 6412 | 6 | 6 | 0.08% | 0.09% | 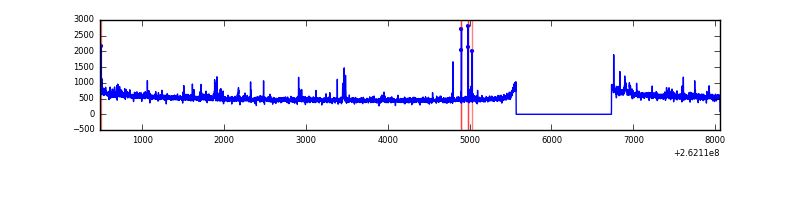 |
| C | 7577 | 6412 | 0 | 0 | 0.00% | 0.00% | 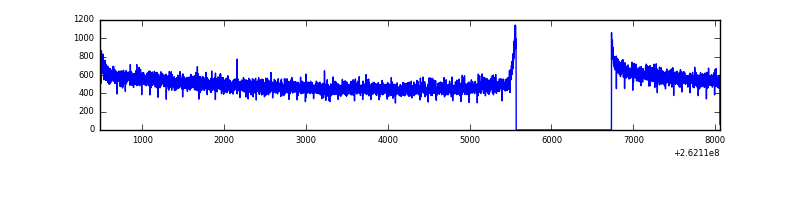 |
| D | 7577 | 6412 | 262 | 262 | 3.46% | 4.09% | 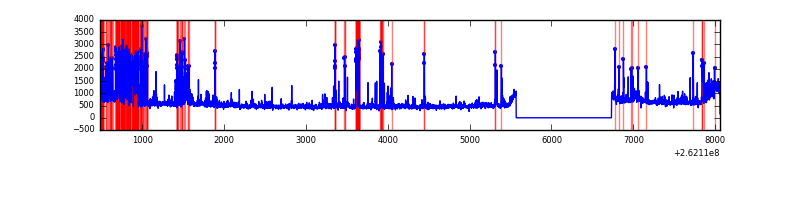 |
Top three noisy pixels from each quadrant. If the there are fewer than three noisy pixels in the level2.evt file, extra rows are filled as -1
| Pixel properties | Quadrant properties | ||||||
|---|---|---|---|---|---|---|---|
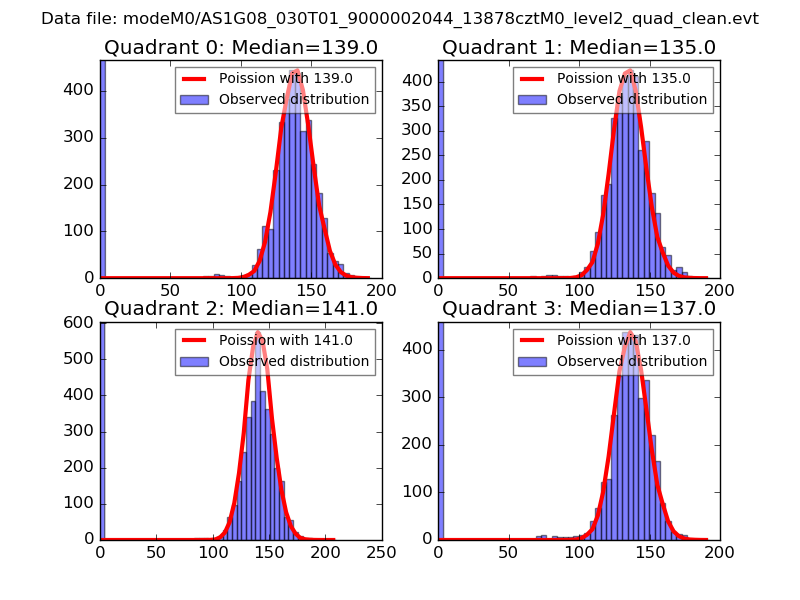
| Quadrant | DetID | PixID | Counts | Sigma | Mean | Median | Sigma |
| A | 4 | 2 | 9998 | 54.75 | 836 | 821 | 167.6 |
| A | 1 | 162 | 8452 | 45.53 | 836 | 821 | 167.6 |
| A | 0 | 226 | 7831 | 41.82 | 836 | 821 | 167.6 |
| B | 3 | 209 | 36914 | 230.96 | 829 | 810 | 156.3 |
| B | 4 | 80 | 18778 | 114.94 | 829 | 810 | 156.3 |
| B | 10 | 244 | 17206 | 104.89 | 829 | 810 | 156.3 |
| C | 3 | 233 | 60555 | 313.6 | 821 | 824 | 190.5 |
| C | 13 | 61 | 5882 | 26.56 | 821 | 824 | 190.5 |
| C | 3 | 202 | 1915 | 5.73 | 821 | 824 | 190.5 |
| D | 1 | 52 | 561440 | 2813.98 | 799 | 781 | 199.2 |
| D | 13 | 122 | 314615 | 1575.15 | 799 | 781 | 199.2 |
| D | 13 | 189 | 165852 | 828.5 | 799 | 781 | 199.2 |
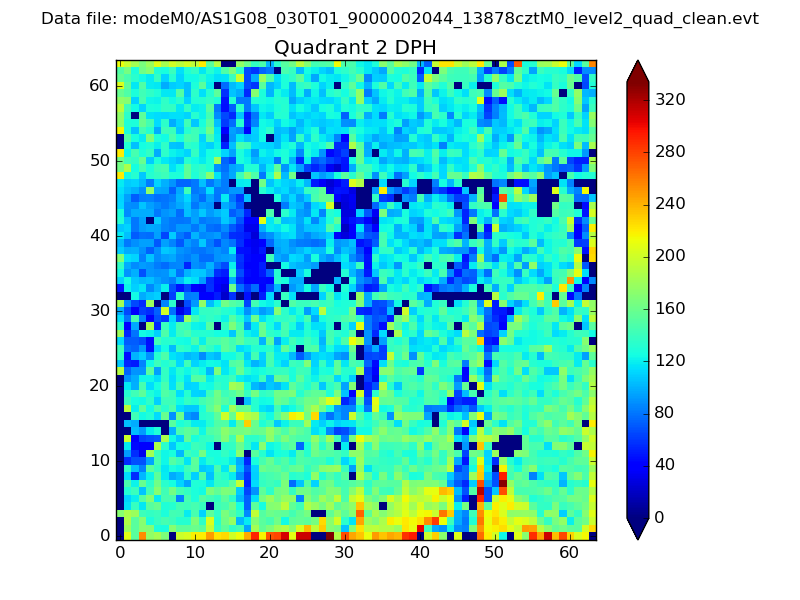
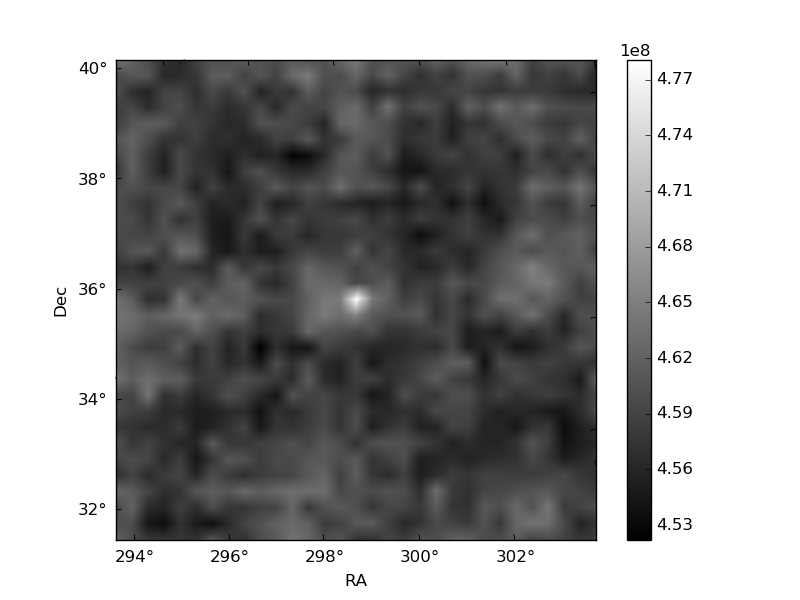
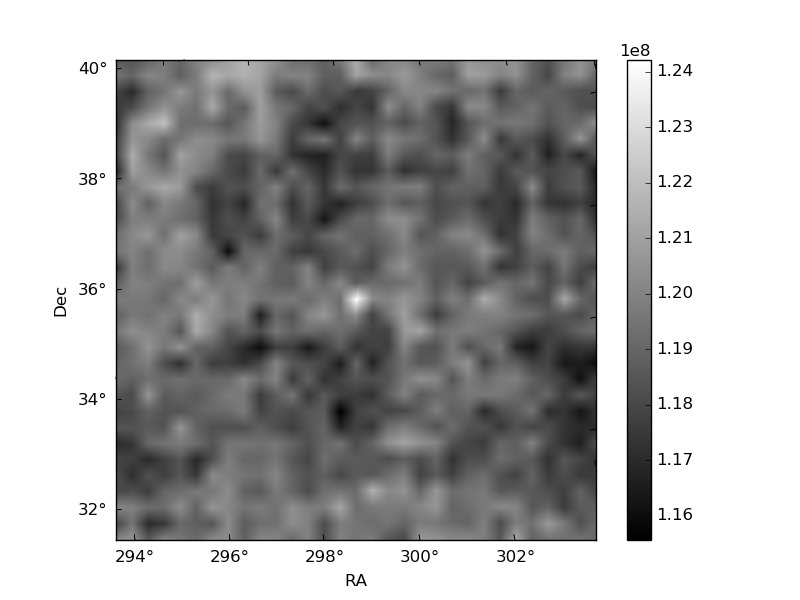
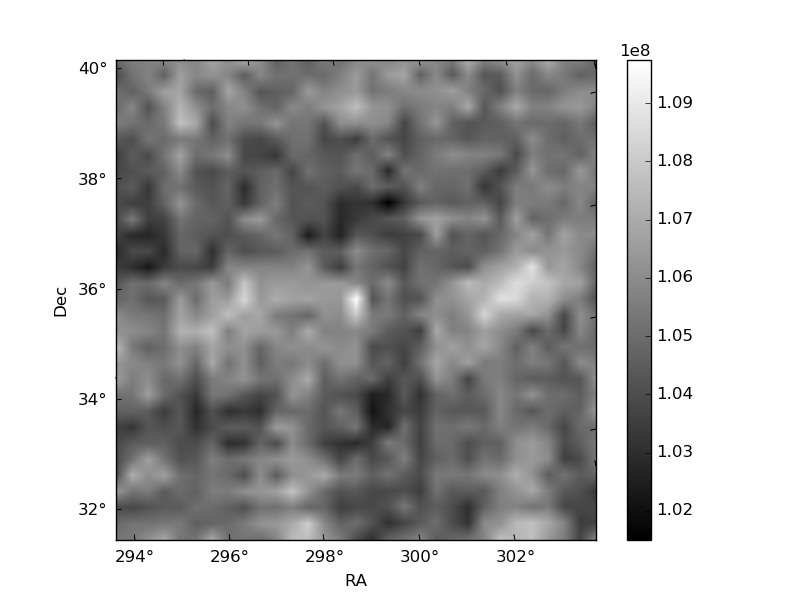
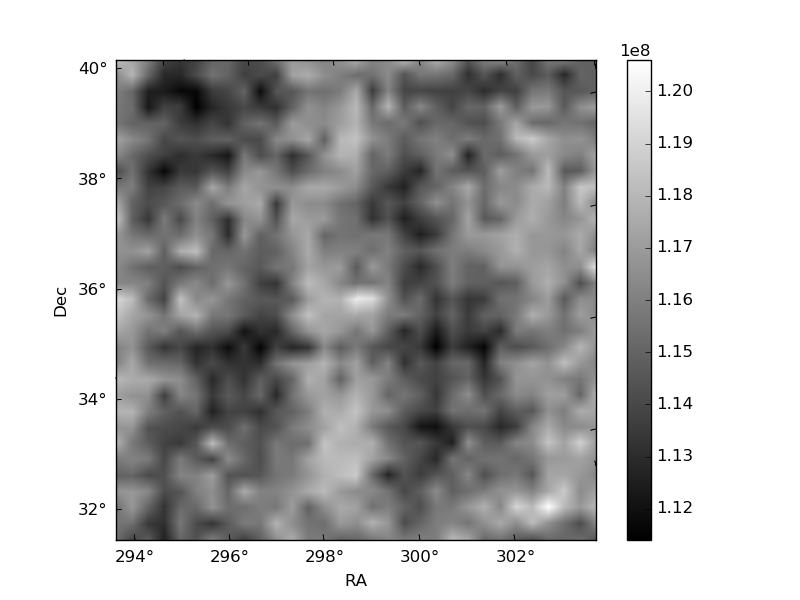
Histogram calculated using DETX and DETY for each event in the final _common_clean file
| Quadrant A | 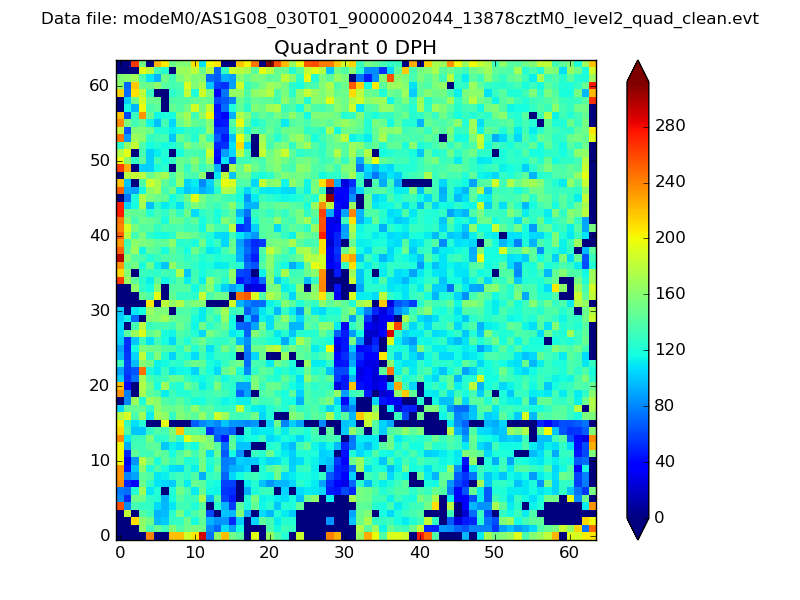 |
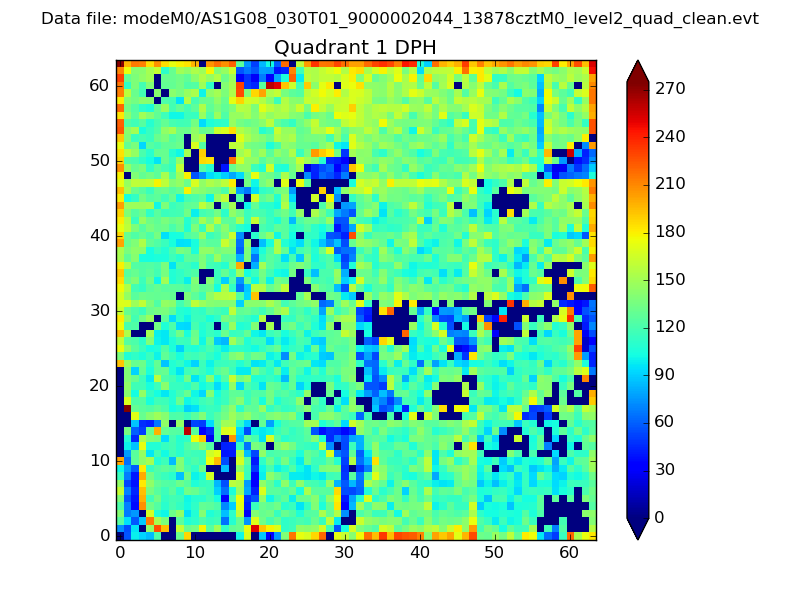 |
Quadrant B |
|---|---|---|---|
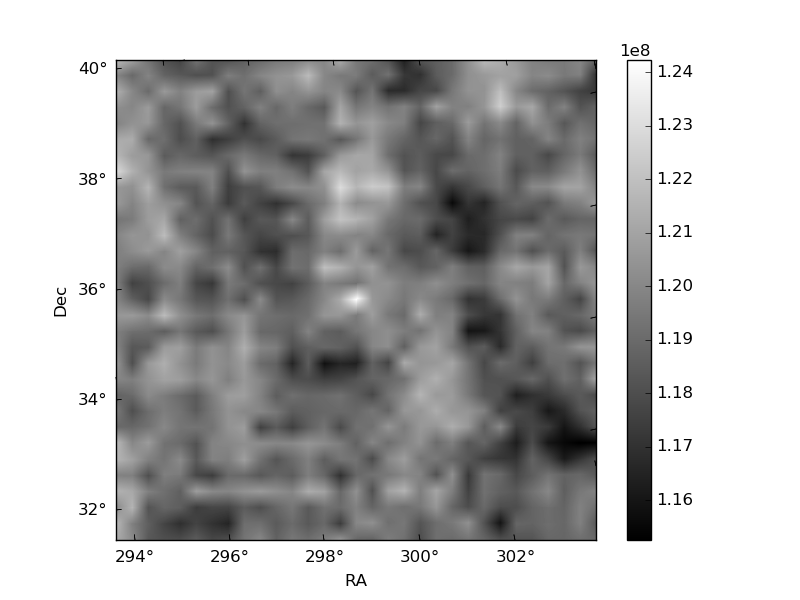
| Quadrant D | 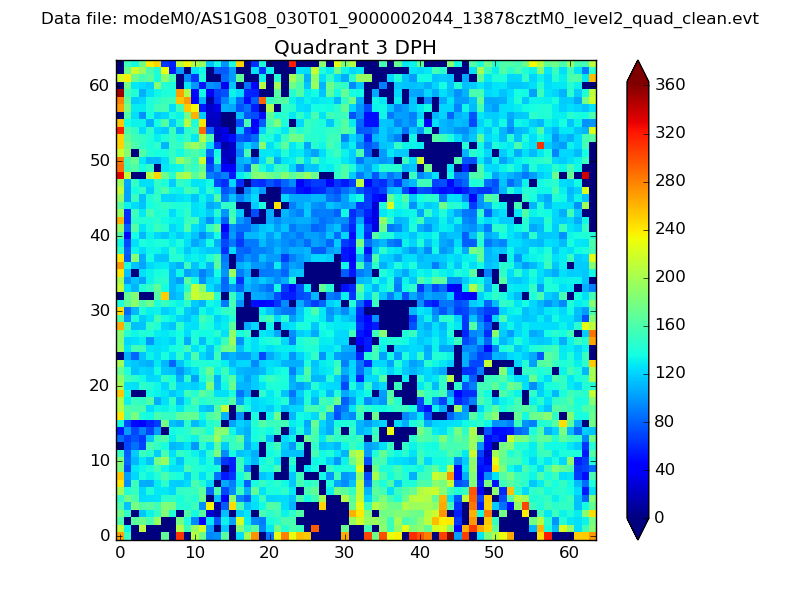 |
 |
Quadrant C |
| Plot type | Count rate plots | Images |
|---|---|---|
| Comparison with Poisson distribution Blue bars denote a histogram of data divided into 1 sec bins. Red curve is a Poisson curve with rate = median count rate of data. |
 |
 |
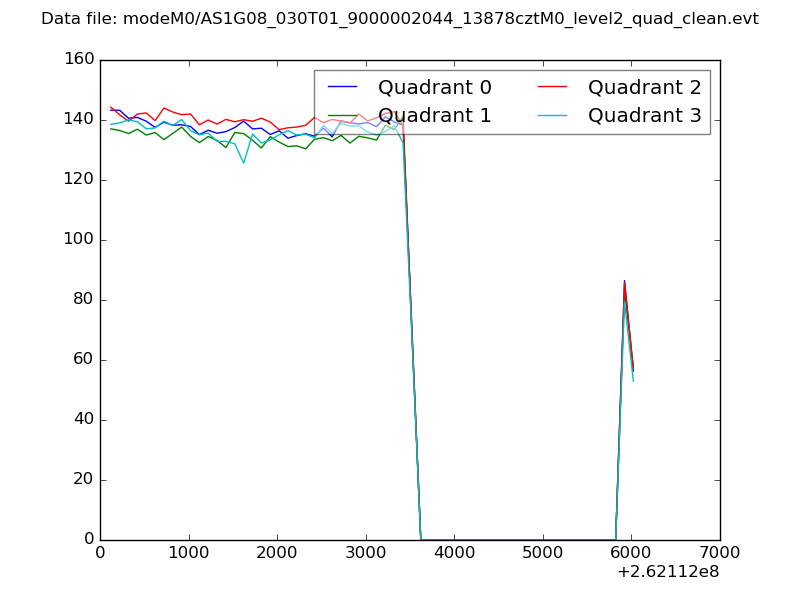
| Quadrant-wise count rates Data is divided into 100 sec bins |
 |
|
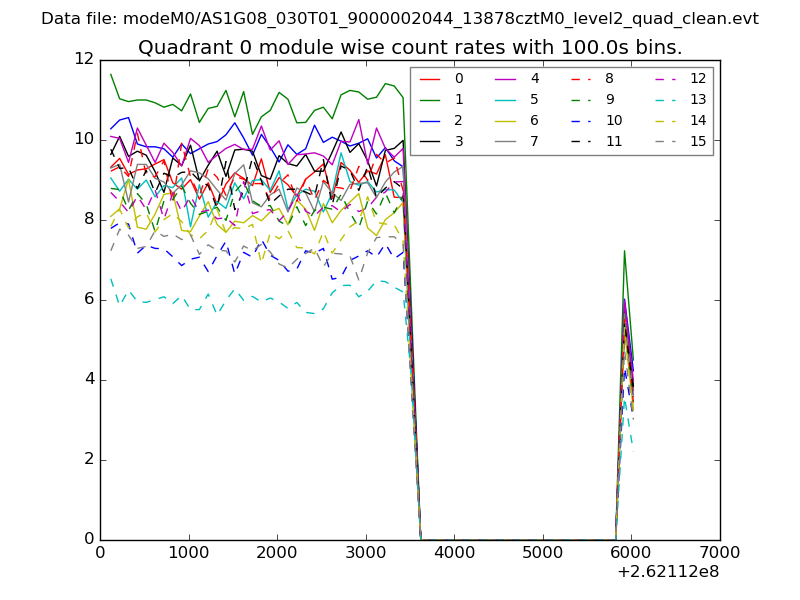
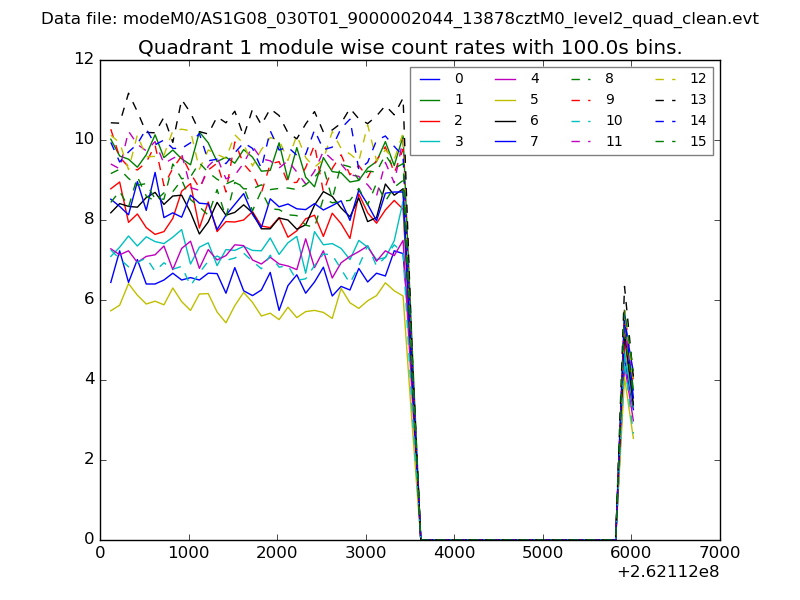
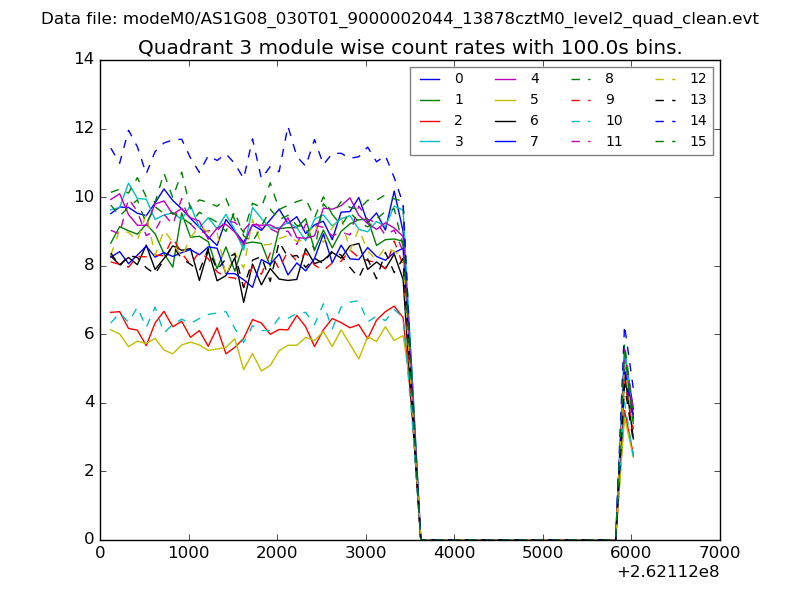
| Module-wise count rates for Quadrant A Data is divided into 100 sec bins |
 |
 |
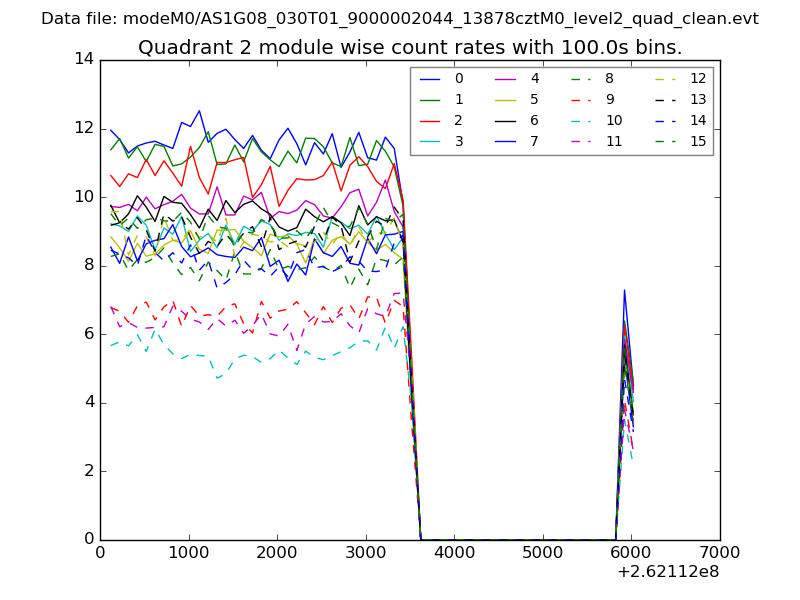
| Module-wise count rates for Quadrant B Data is divided into 100 sec bins |
 |
 |
| Module-wise count rates for Quadrant C Data is divided into 100 sec bins |
 |
 |
| Module-wise count rates for Quadrant D Data is divided into 100 sec bins |
 |
 |
| Parameter | Plot |
|---|---|
| CZT HV Monitor | 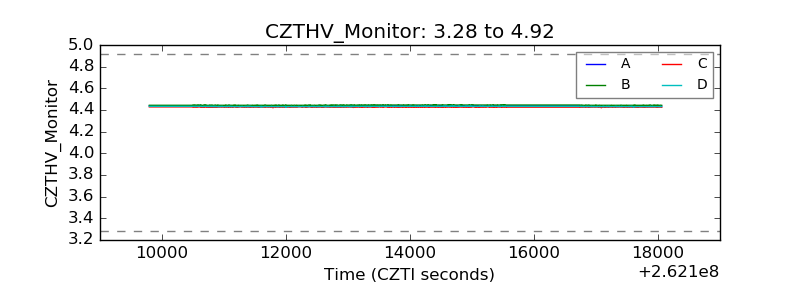 |
| D_VDD | 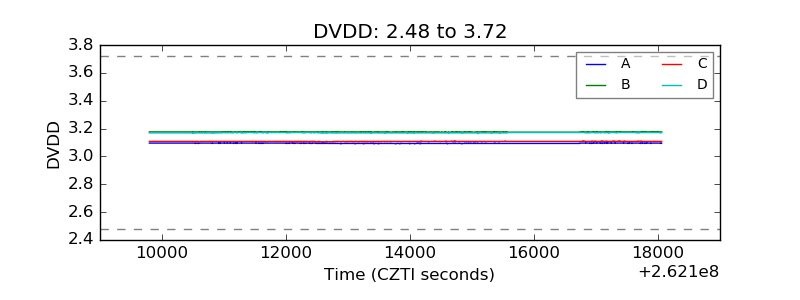 |
| Temperature 1 | 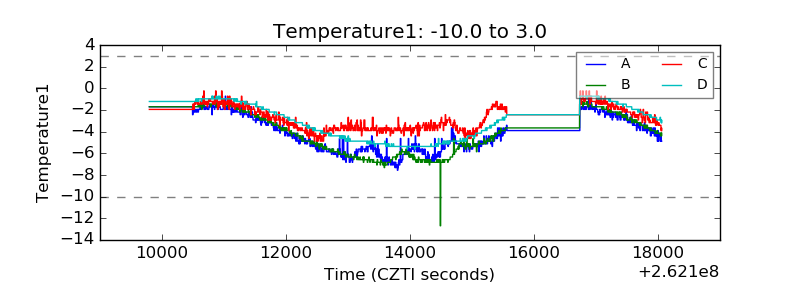 |
| Veto HV Monitor |  |
| Veto LLD | 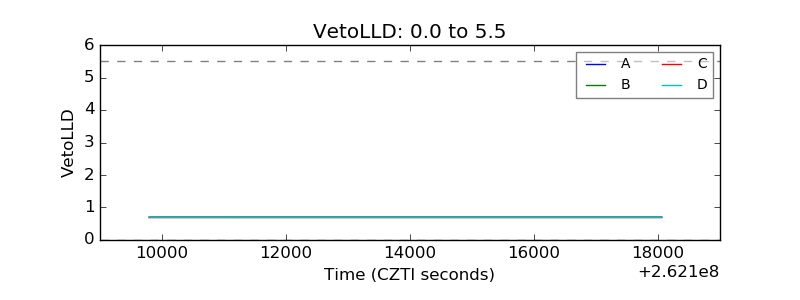 |
| Alpha Counter | 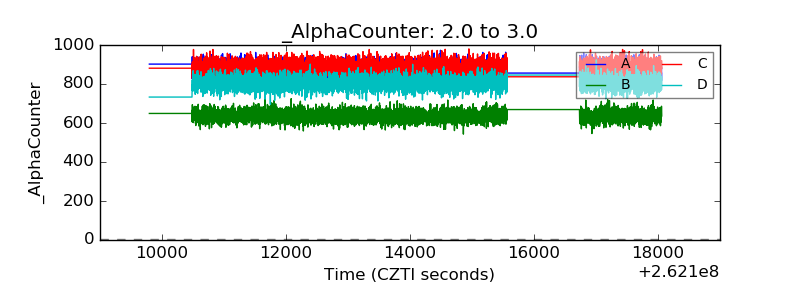 |
| _CPM_Rate | 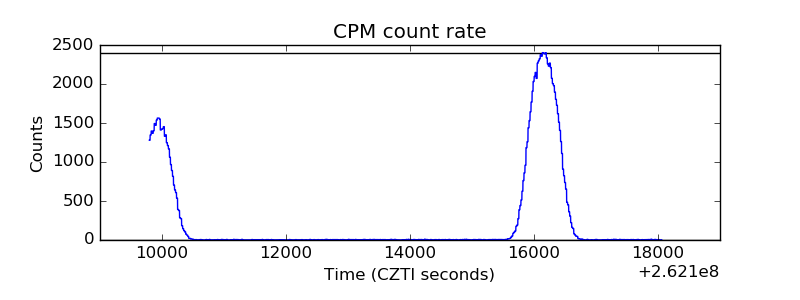 |
| CZT Counter | 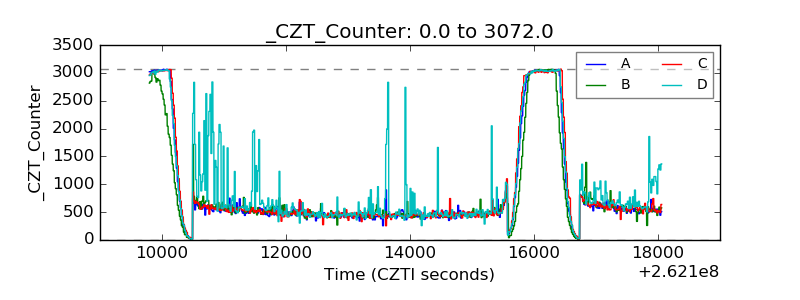 |
| +2.5 Volts monitor |  |
| +5 Volts monitor |  |
| _ROLL_ROT | 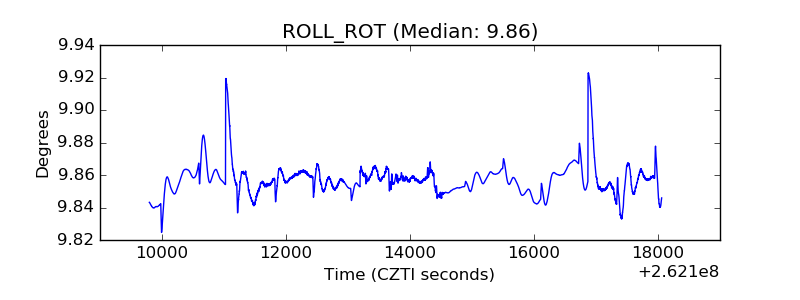 |
| _Roll_DEC | 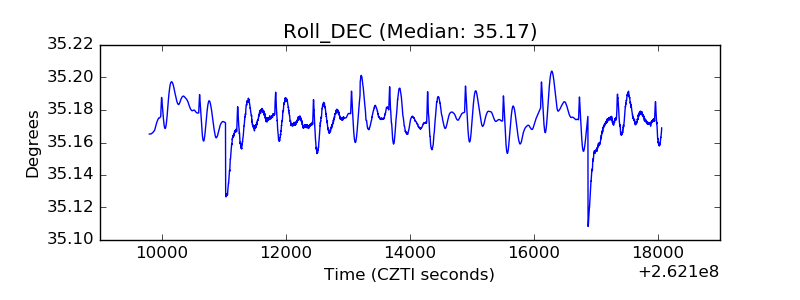 |
| _Roll_RA | 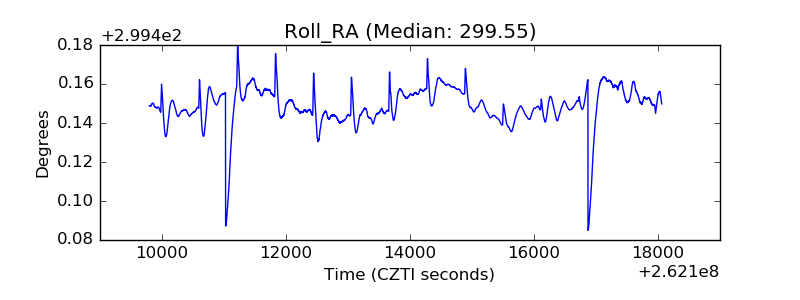 |
| Veto Counter | 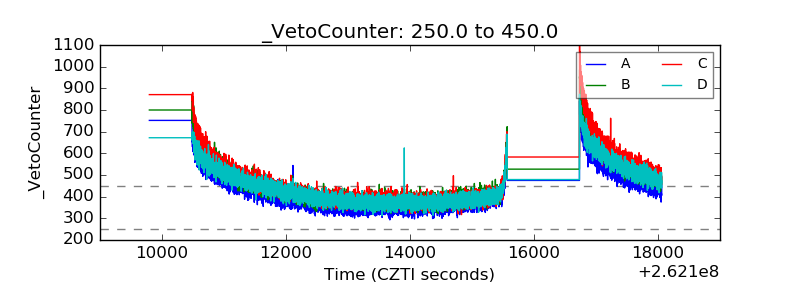 |