| Param | Original file | Final file |
|---|---|---|
| Filename | modeM0/AS1G08_030T01_9000002044_13879cztM0_level2.evt | modeM0/AS1G08_030T01_9000002044_13879cztM0_level2_quad_clean.evt |
| Size (bytes) | 193,302,720 | 28,082,880 |
| Size | 184.3 MB | 26.8 MB |
| Events in quadrant A | 1,267,993 | 169,797 |
| Events in quadrant B | 1,341,006 | 166,915 |
| Events in quadrant C | 1,299,277 | 174,397 |
| Events in quadrant D | 1,780,883 | 165,916 |
| Mode M0 | |||
|---|---|---|---|
| Quadrant | BADHDUFLAG | Total packets | Discarded packets |
| A | 0 | 5323 | 1 |
| B | 0 | 5501 | 1 |
| C | 0 | 5341 | 1 |
| D | 0 | 7080 | 1 |
| Mode M9 | |||
|---|---|---|---|
| Quadrant | BADHDUFLAG | Total packets | Discarded packets |
| A | 0 | 8 | 0 |
| B | 0 | 8 | 0 |
| C | 0 | 8 | 0 |
| D | 0 | 9 | 0 |
| Mode SS | |||
|---|---|---|---|
| Quadrant | BADHDUFLAG | Total packets | Discarded packets |
| A | 0 | 48 | 0 |
| B | 0 | 48 | 0 |
| C | 0 | 48 | 0 |
| D | 0 | 48 | 0 |
| Quadrant | Total seconds | Saturated seconds | Saturation percentage |
|---|---|---|---|
| A | 2400 | 8 | 0.333333% |
| B | 2400 | 12 | 0.500000% |
| C | 2400 | 8 | 0.333333% |
| D | 2400 | 36 | 1.500000% |
Noise dominated data is calculated using 1-second bins in cleaned event files. If a bin has >2000 counts, and if more than 50% of those come from <1% of pixels, then it is considered to be noise-dominated and hence unusable.
| Quadrant | # 1 sec bins | Bins with >0 counts | Bins with >2000 counts | High rate bins dominated by noise | Noise dominated (total time) | Noise dominated (detector-on time) | Marked lightcurve |
|---|---|---|---|---|---|---|---|
| A | 2401 | 2401 | 0 | 0 | 0.00% | 0.00% | 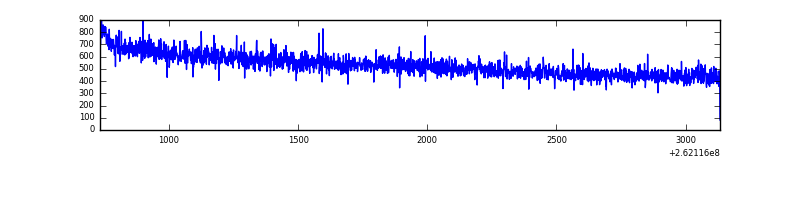 |
| B | 2401 | 2401 | 0 | 0 | 0.00% | 0.00% | 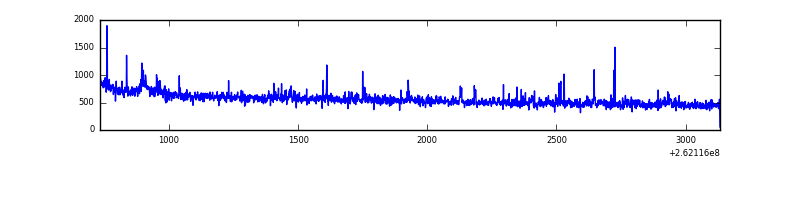 |
| C | 2401 | 2401 | 0 | 0 | 0.00% | 0.00% | 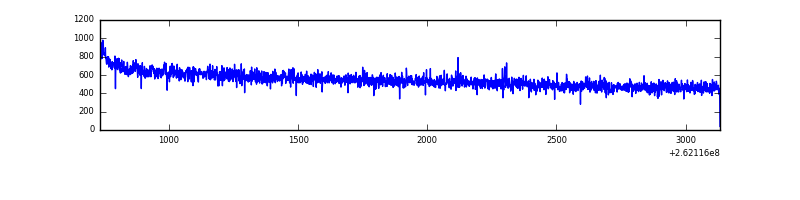 |
| D | 2401 | 2401 | 16 | 16 | 0.67% | 0.67% | 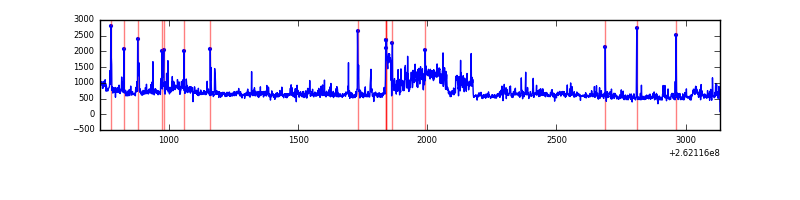 |
Top three noisy pixels from each quadrant. If the there are fewer than three noisy pixels in the level2.evt file, extra rows are filled as -1
| Pixel properties | Quadrant properties | ||||||
|---|---|---|---|---|---|---|---|
| Quadrant | DetID | PixID | Counts | Sigma | Mean | Median | Sigma |
| A | 1 | 162 | 4025 | 54.86 | 327 | 321 | 67.5 |
| A | 0 | 226 | 3164 | 42.11 | 327 | 321 | 67.5 |
| A | 12 | 194 | 2576 | 33.4 | 327 | 321 | 67.5 |
| B | 3 | 209 | 23210 | 366.9 | 326 | 320 | 62.4 |
| B | 10 | 244 | 13147 | 205.6 | 326 | 320 | 62.4 |
| B | 0 | 197 | 8294 | 127.81 | 326 | 320 | 62.4 |
| C | 3 | 233 | 22774 | 293.8 | 327 | 328 | 76.4 |
| C | 13 | 61 | 2387 | 26.95 | 327 | 328 | 76.4 |
| C | 12 | 4 | 1335 | 13.18 | 327 | 328 | 76.4 |
| D | 13 | 122 | 201990 | 2352.37 | 323 | 316 | 85.7 |
| D | 10 | 157 | 123159 | 1432.87 | 323 | 316 | 85.7 |
| D | 8 | 195 | 94579 | 1099.51 | 323 | 316 | 85.7 |
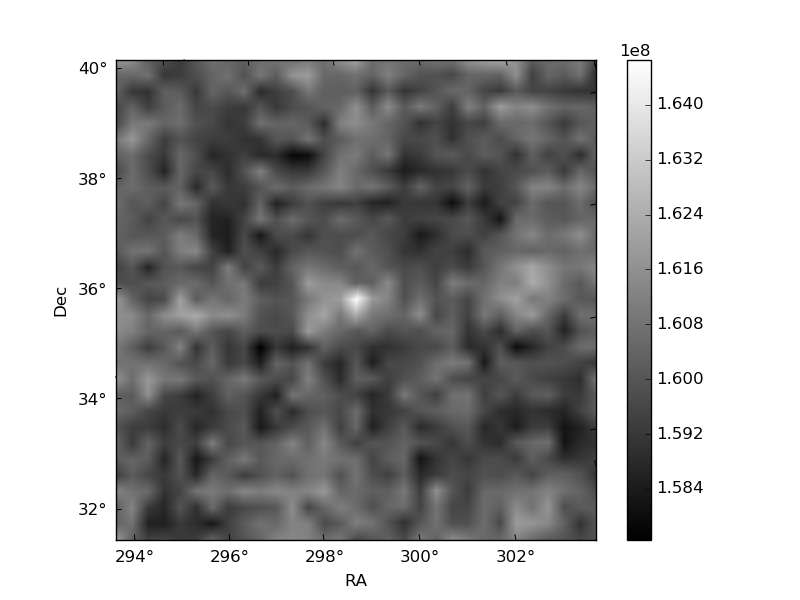
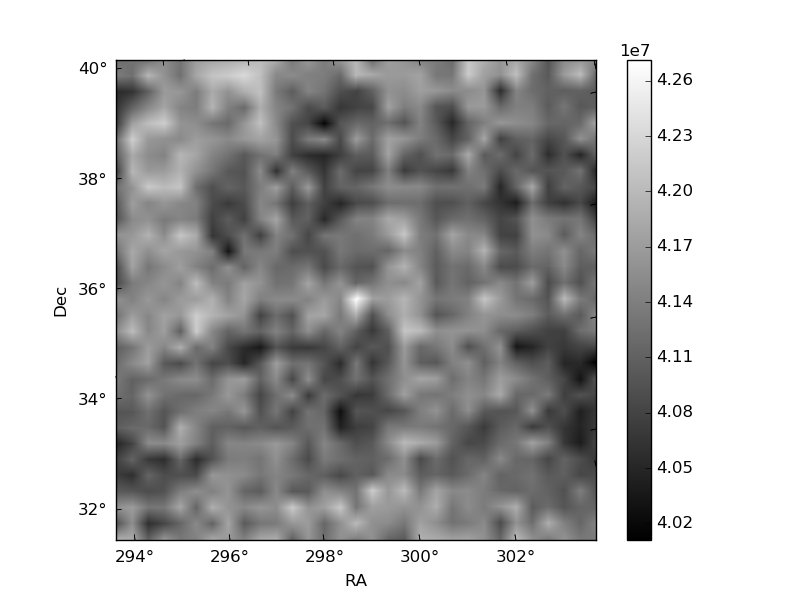
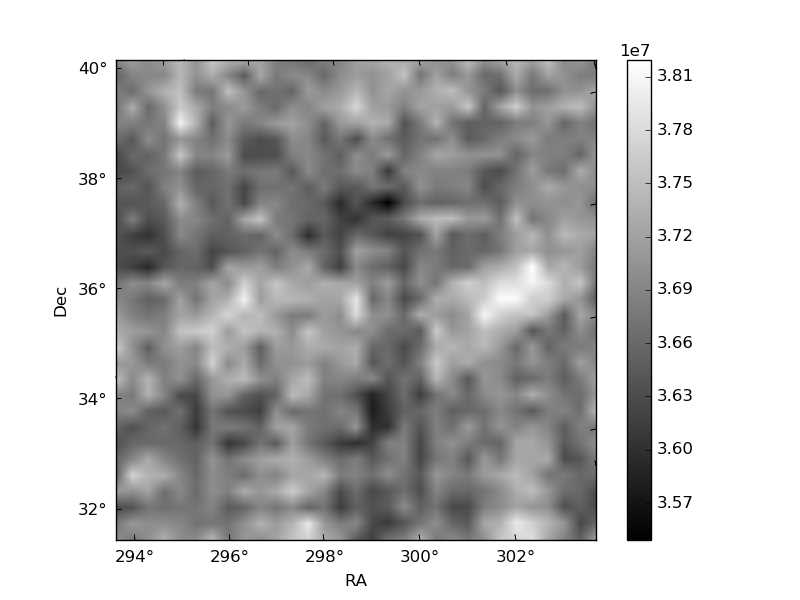
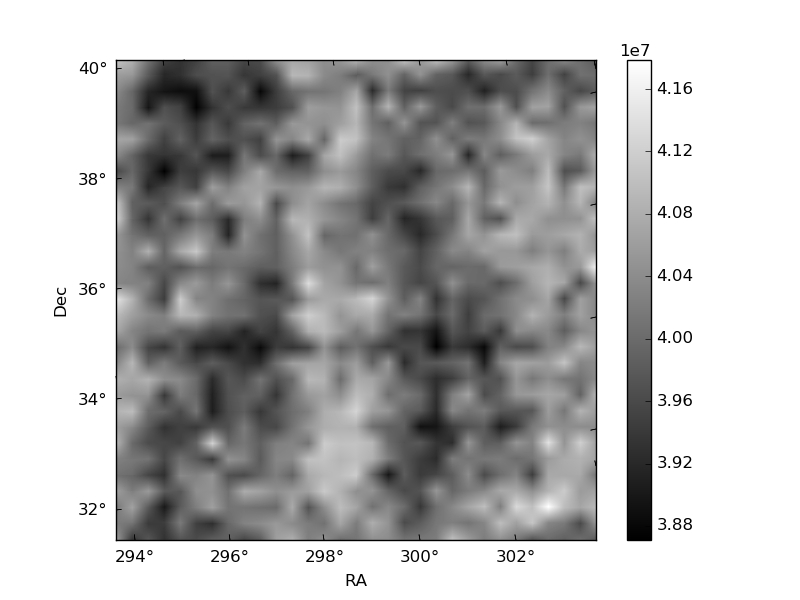
Histogram calculated using DETX and DETY for each event in the final _common_clean file
| Quadrant A | 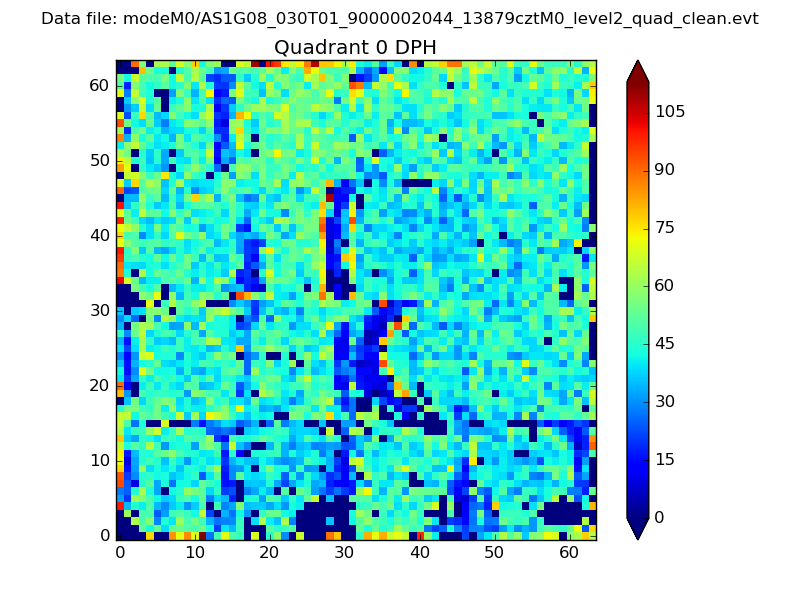 |
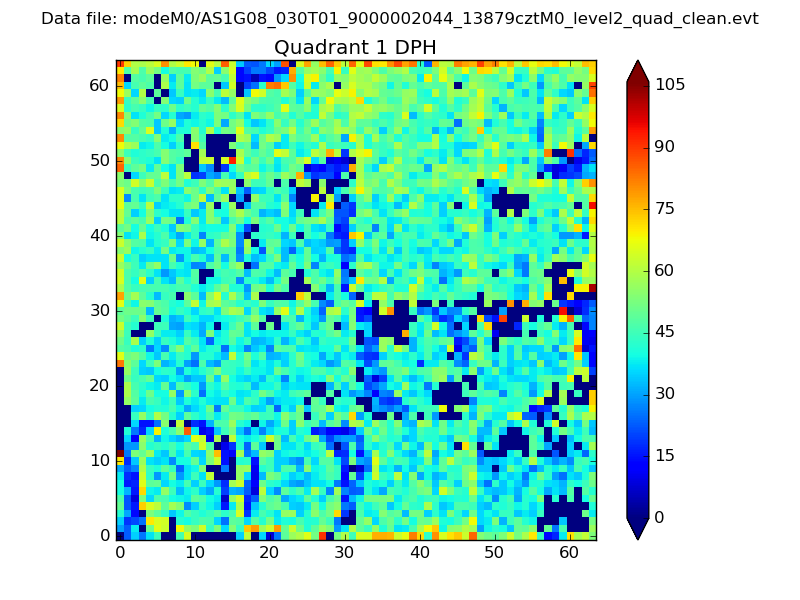 |
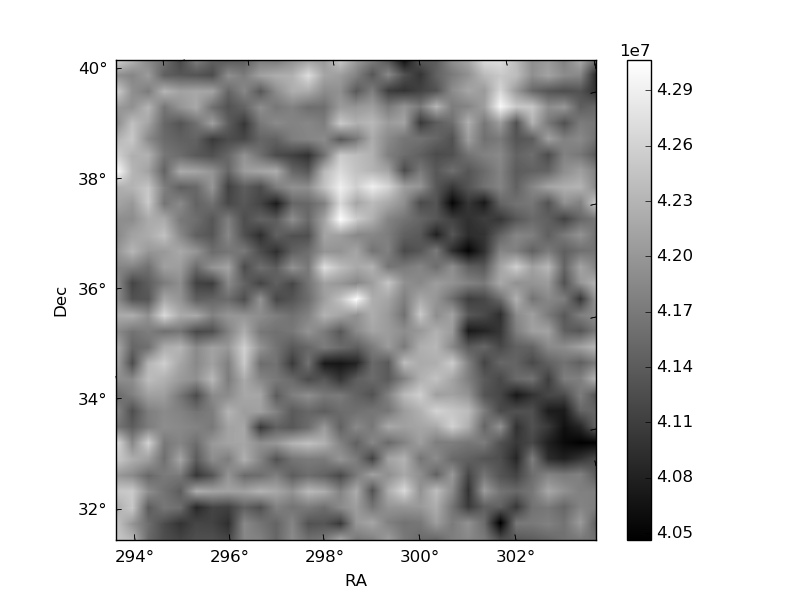
Quadrant B |
|---|---|---|---|
| Quadrant D | 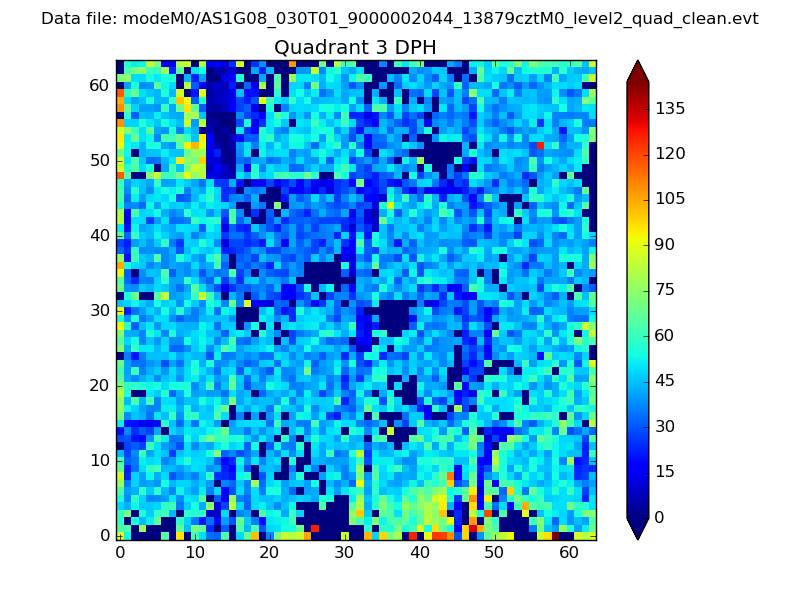 |
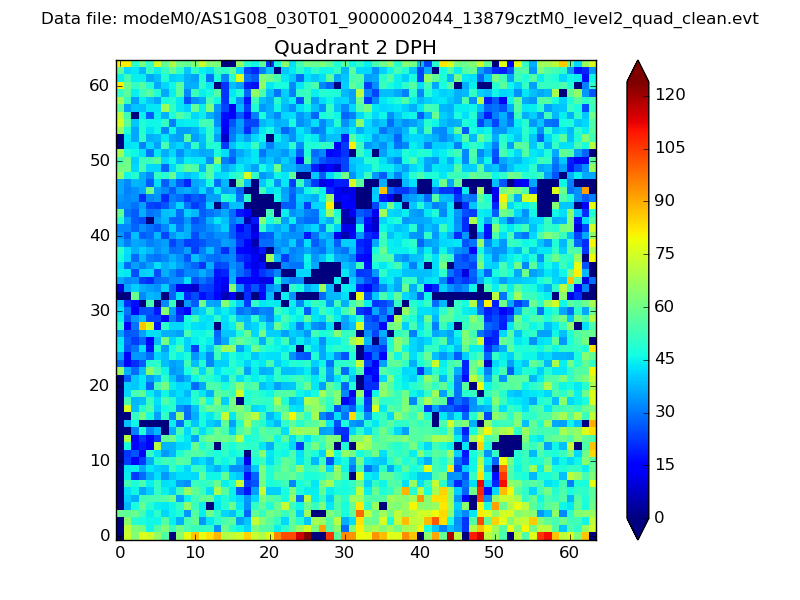 |
Quadrant C |
| Plot type | Count rate plots | Images |
|---|---|---|
| Comparison with Poisson distribution Blue bars denote a histogram of data divided into 1 sec bins. Red curve is a Poisson curve with rate = median count rate of data. |
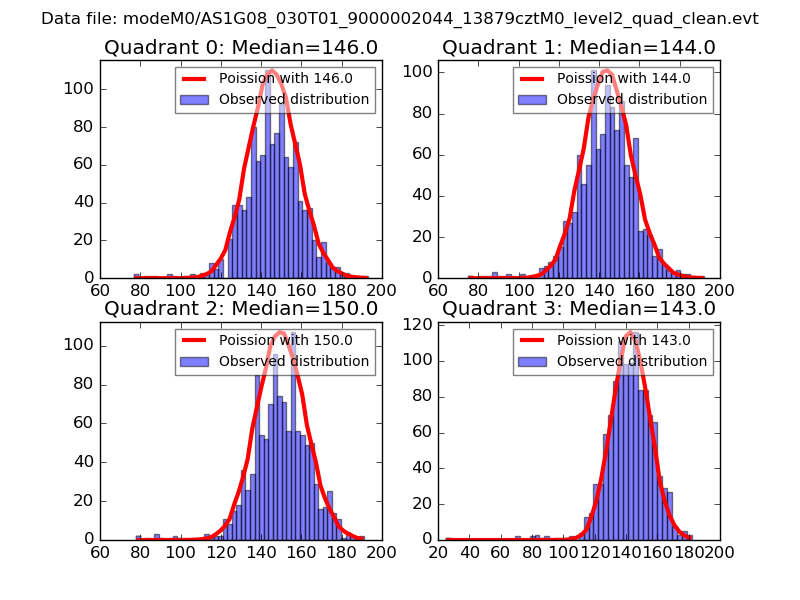 |
 |
| Quadrant-wise count rates Data is divided into 100 sec bins |
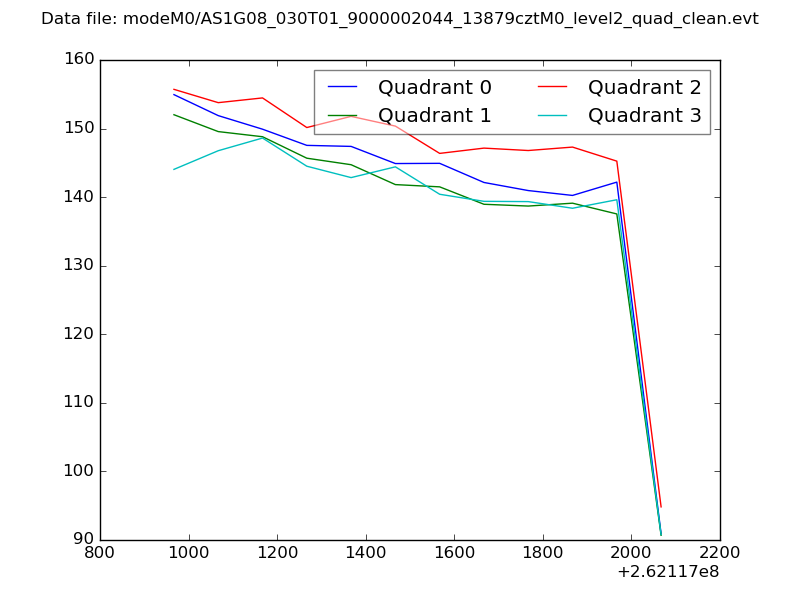 |
|
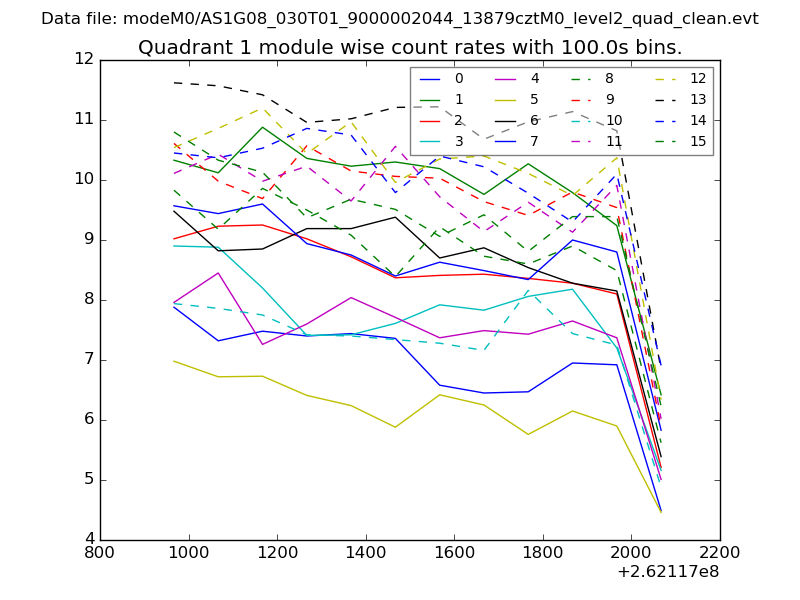
| Module-wise count rates for Quadrant A Data is divided into 100 sec bins |
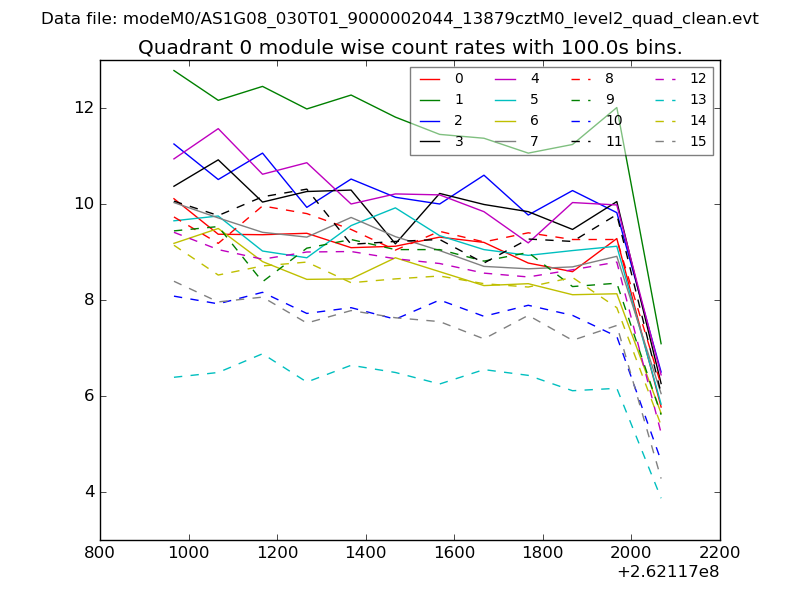 |
 |
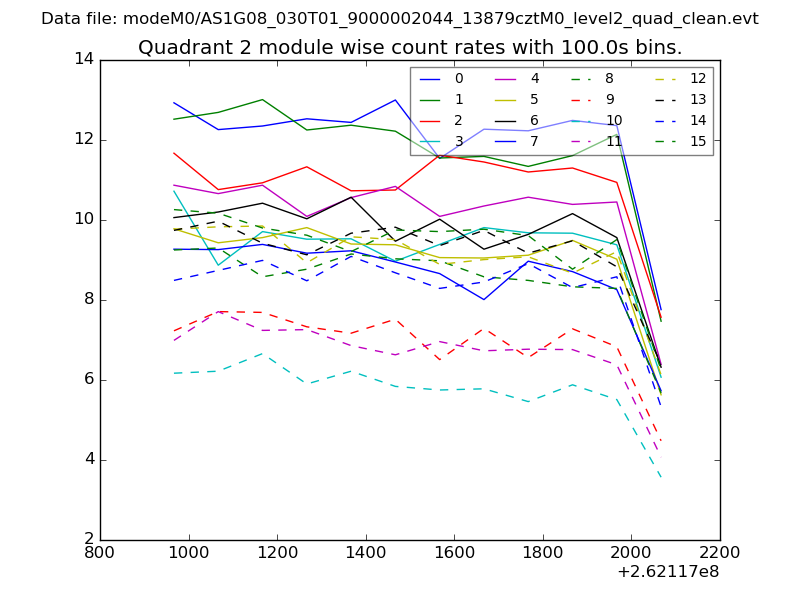
| Module-wise count rates for Quadrant B Data is divided into 100 sec bins |
 |
 |
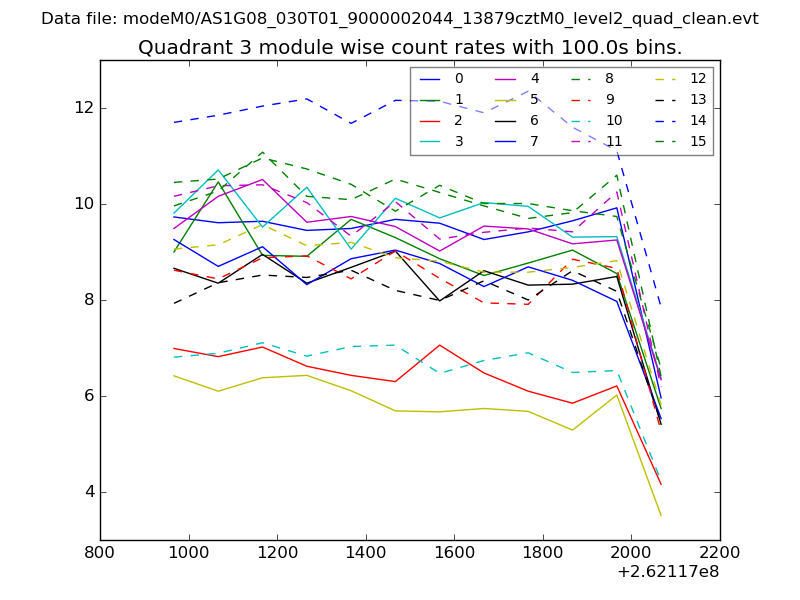
| Module-wise count rates for Quadrant C Data is divided into 100 sec bins |
 |
 |
| Module-wise count rates for Quadrant D Data is divided into 100 sec bins |
 |
 |
| Parameter | Plot |
|---|---|
| CZT HV Monitor | 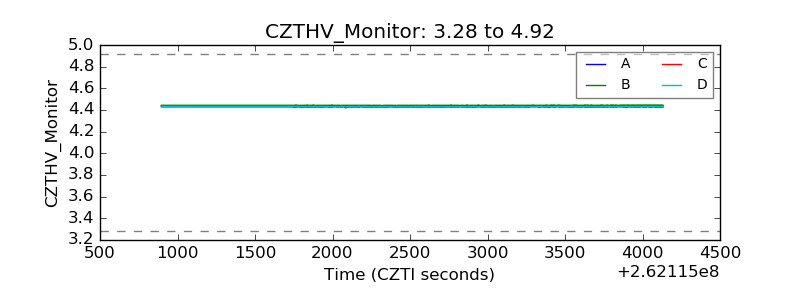 |
| D_VDD | 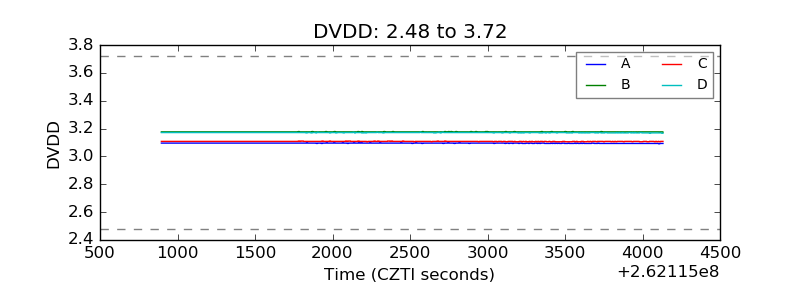 |
| Temperature 1 | 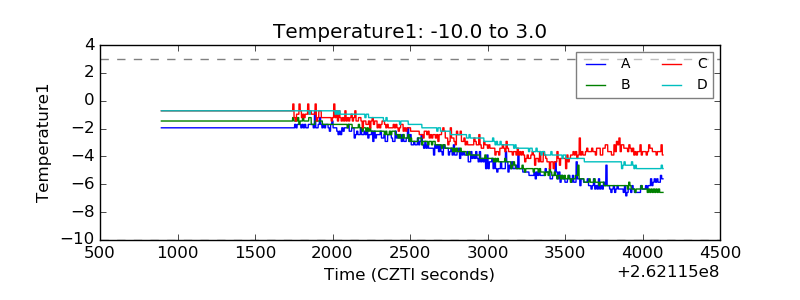 |
| Veto HV Monitor | 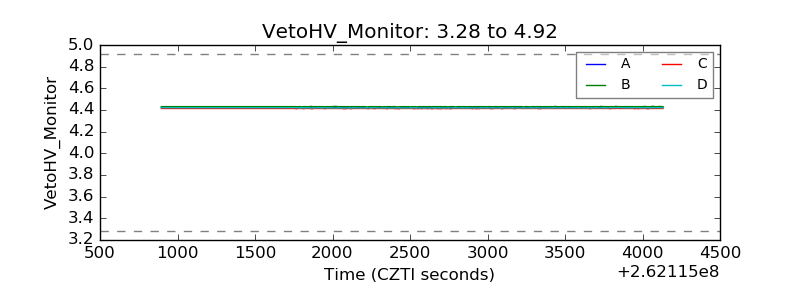 |
| Veto LLD | 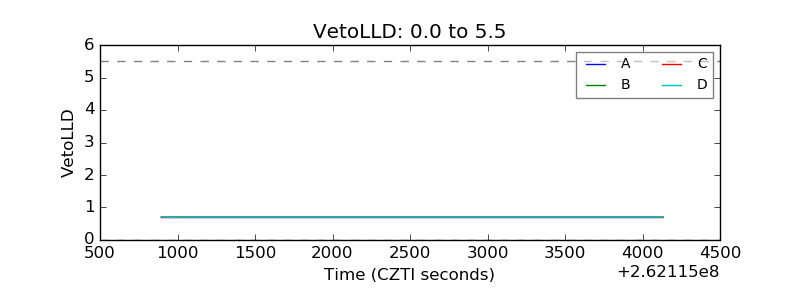 |
| Alpha Counter | 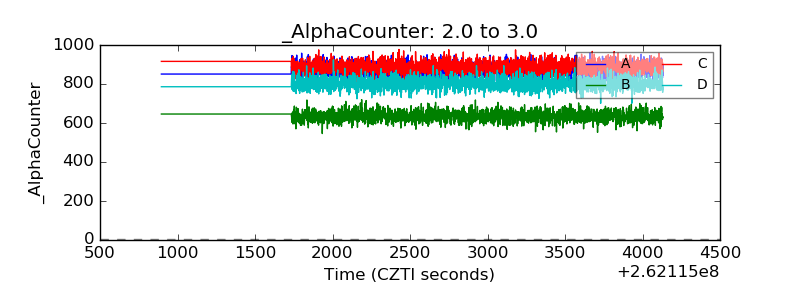 |
| _CPM_Rate | 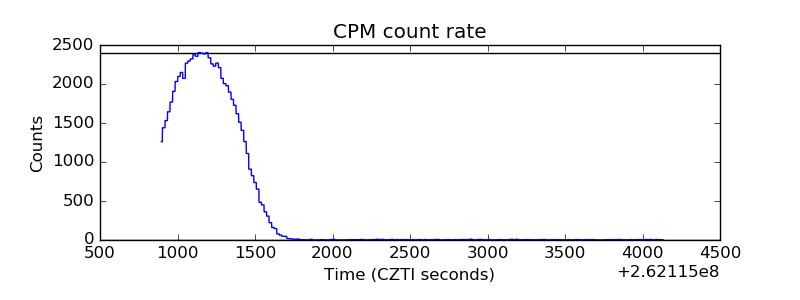 |
| CZT Counter | 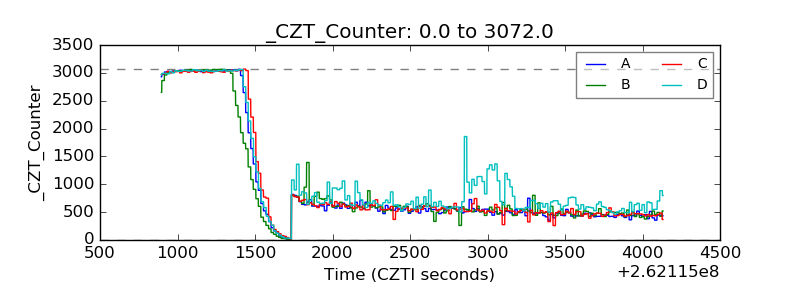 |
| +2.5 Volts monitor | 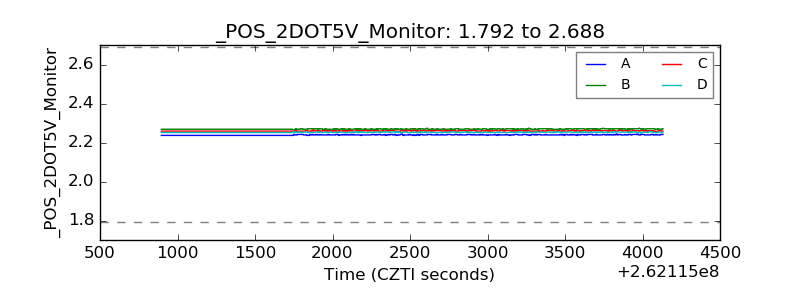 |
| +5 Volts monitor |  |
| _ROLL_ROT | 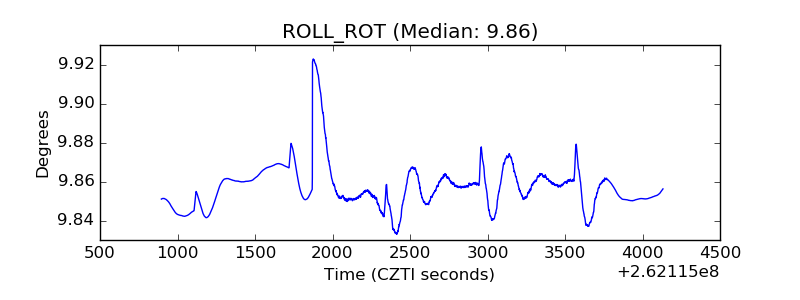 |
| _Roll_DEC | 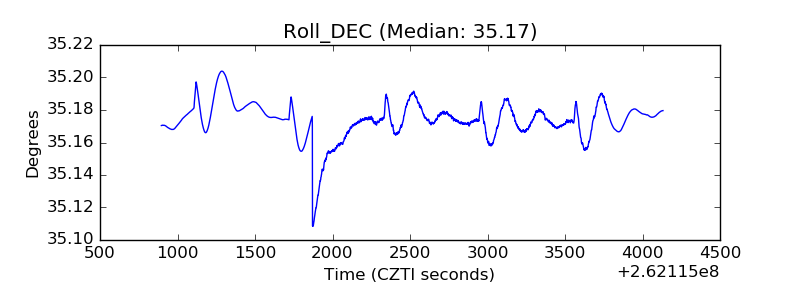 |
| _Roll_RA | 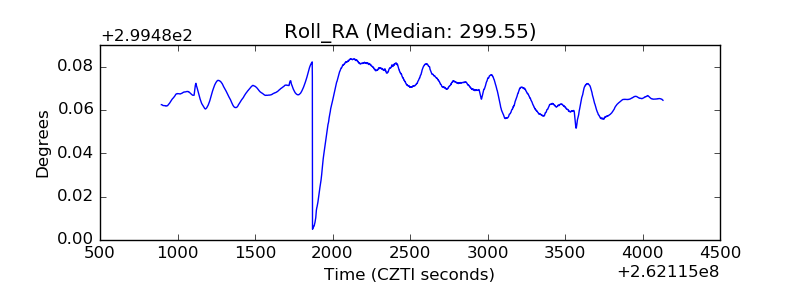 |
| Veto Counter | 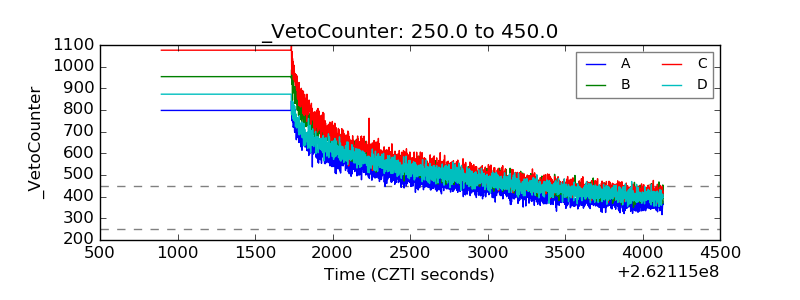 |