| Param | Original file | Final file |
|---|---|---|
| Filename | modeM0/AS1A04_010T02_9000002048cztM0_level2.fits | modeM0/AS1A04_010T02_9000002048cztM0_level2_quad_clean.evt |
| Size (bytes) | 697,921,920 | 612,365,760 |
| Size | 665.6 MB | 584.0 MB |
| Events in quadrant A | 4,309,476 | 3,653,074 |
| Events in quadrant B | 4,174,938 | 3,628,271 |
| Events in quadrant C | 4,267,008 | 3,488,168 |
| Events in quadrant D | 3,243,104 | 2,639,120 |
| Mode M0 | |||
|---|---|---|---|
| Quadrant | BADHDUFLAG | Total packets | Discarded packets |
| A | 0 | 159893 | 0 |
| B | 0 | 158296 | 0 |
| C | 0 | 155500 | 0 |
| D | 0 | 261200 | 0 |
| Mode SS | |||
|---|---|---|---|
| Quadrant | BADHDUFLAG | Total packets | Discarded packets |
| A | 0 | 1532 | 0 |
| B | 0 | 1532 | 0 |
| C | 0 | 1532 | 0 |
| D | 0 | 1532 | 0 |
| Mode M9 | |||
|---|---|---|---|
| Quadrant | BADHDUFLAG | Total packets | Discarded packets |
| A | 0 | 117 | 0 |
| B | 0 | 117 | 0 |
| C | 0 | 117 | 0 |
| D | 0 | 117 | 0 |
| Quadrant | Total seconds | Saturated seconds | Saturation percentage |
|---|---|---|---|
| A | 74879 | 1383 | 1.846980% |
| B | 74879 | 1294 | 1.728121% |
| C | 74879 | 732 | 0.977577% |
| D | 74879 | 13254 | 17.700557% |
Noise dominated data is calculated using 1-second bins in cleaned event files. If a bin has >2000 counts, and if more than 50% of those come from <1% of pixels, then it is considered to be noise-dominated and hence unusable.
| Quadrant | # 1 sec bins | Bins with >0 counts | Bins with >2000 counts | High rate bins dominated by noise | Noise dominated (total time) | Noise dominated (detector-on time) | Marked lightcurve |
|---|---|---|---|---|---|---|---|
| A | 86909 | 74858 | 0 | 0 | 0.00% | 0.00% |  |
| B | 86909 | 74866 | 0 | 0 | 0.00% | 0.00% | 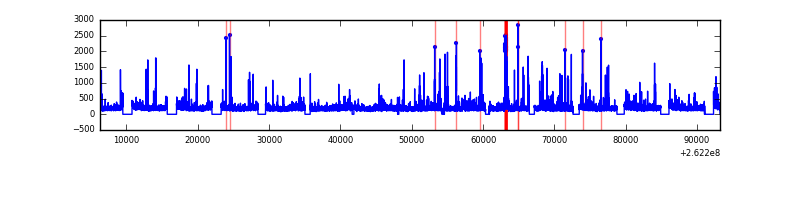 |
| C | 86909 | 74865 | 0 | 0 | 0.00% | 0.00% | 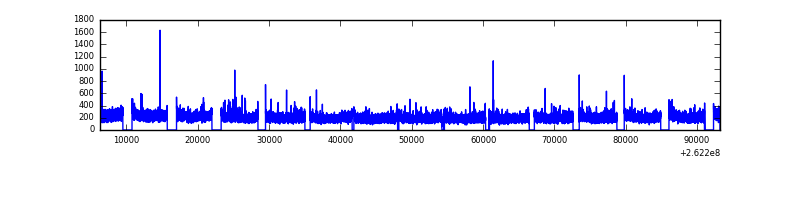 |
| D | 86909 | 73911 | 0 | 0 | 0.00% | 0.00% |  |
Top three noisy pixels from each quadrant. If the there are fewer than three noisy pixels in the level2.evt file, extra rows are filled as -1
| Pixel properties | Quadrant properties | ||||||
|---|---|---|---|---|---|---|---|
| Quadrant | DetID | PixID | Counts | Sigma | Mean | Median | Sigma |
| A | 0 | 29 | 4214 | 11.21 | 1121 | 1045 | 282.6 |
| A | 7 | 110 | 3451 | 8.51 | 1121 | 1045 | 282.6 |
| A | 9 | 19 | 3233 | 7.74 | 1121 | 1045 | 282.6 |
| B | 2 | 9 | 3627 | 11.73 | 1098 | 1040 | 220.6 |
| B | 3 | 17 | 2814 | 8.04 | 1098 | 1040 | 220.6 |
| B | 5 | 128 | 2756 | 7.78 | 1098 | 1040 | 220.6 |
| C | 1 | 80 | 3238 | 7.48 | 1125 | 1041 | 293.6 |
| C | 1 | 81 | 3054 | 6.86 | 1125 | 1041 | 293.6 |
| C | 12 | 241 | 2964 | 6.55 | 1125 | 1041 | 293.6 |
| D | 3 | 14 | 2343 | 5.95 | 924 | 836 | 253.1 |
| D | 7 | 5 | 2265 | 5.65 | 924 | 836 | 253.1 |
| D | 3 | 31 | 2262 | 5.63 | 924 | 836 | 253.1 |
Histogram calculated using DETX and DETY for each event in the final _common_clean file
| Quadrant A | 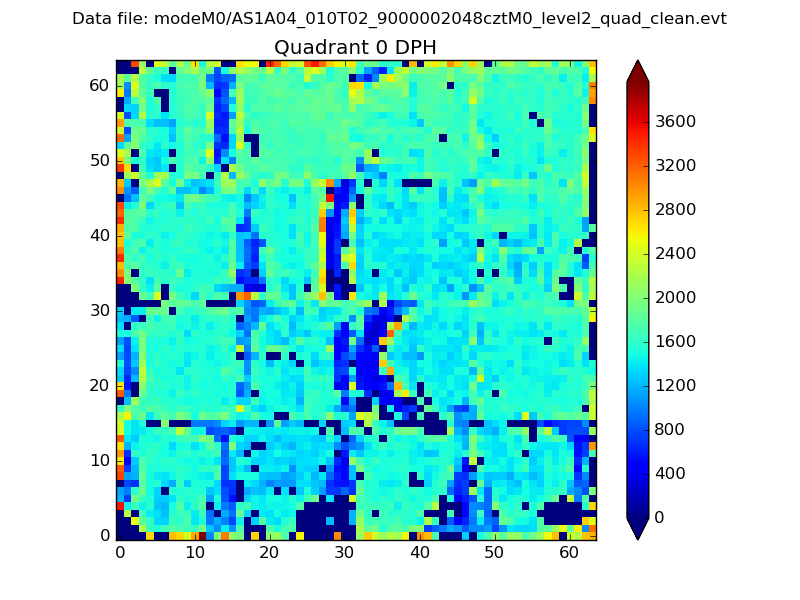 |
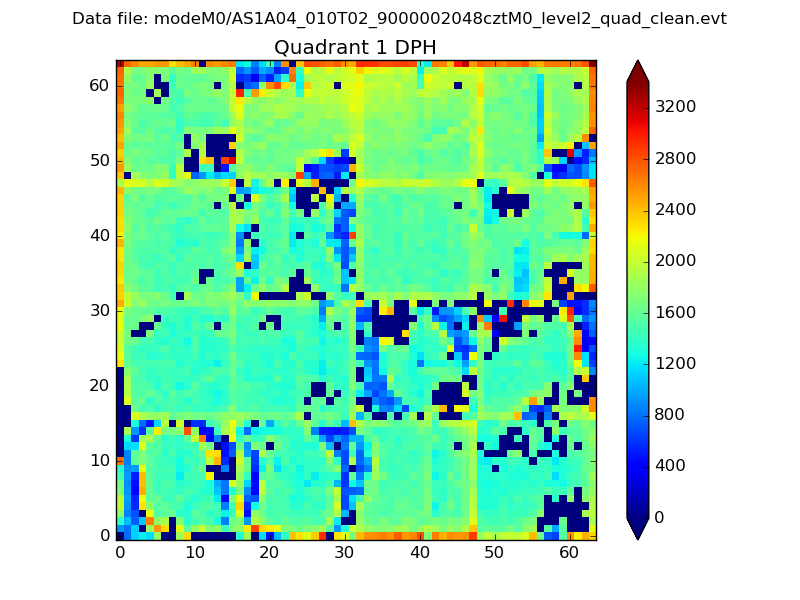 |
Quadrant B |
|---|---|---|---|
| Quadrant D | 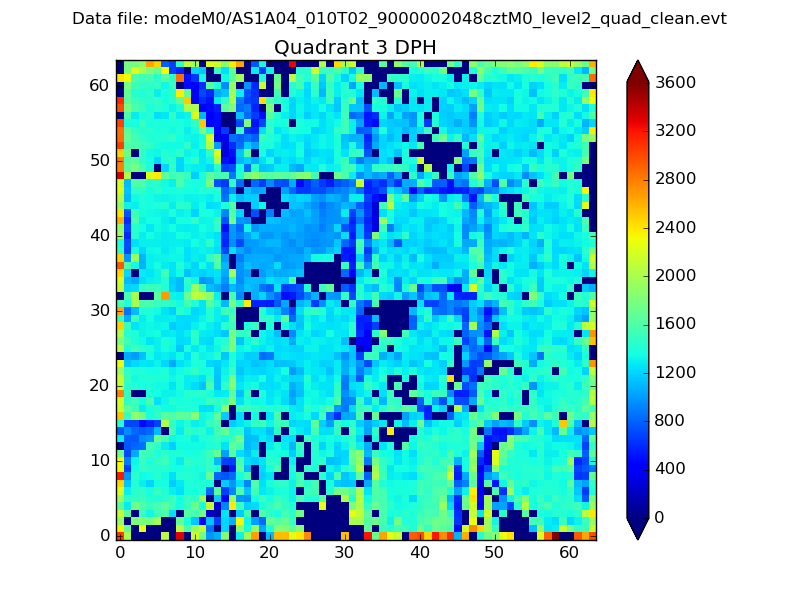 |
 |
Quadrant C |
| Plot type | Count rate plots | Images |
|---|---|---|
| Comparison with Poisson distribution Blue bars denote a histogram of data divided into 1 sec bins. Red curve is a Poisson curve with rate = median count rate of data. |
 |
 |
| Quadrant-wise count rates Data is divided into 100 sec bins |
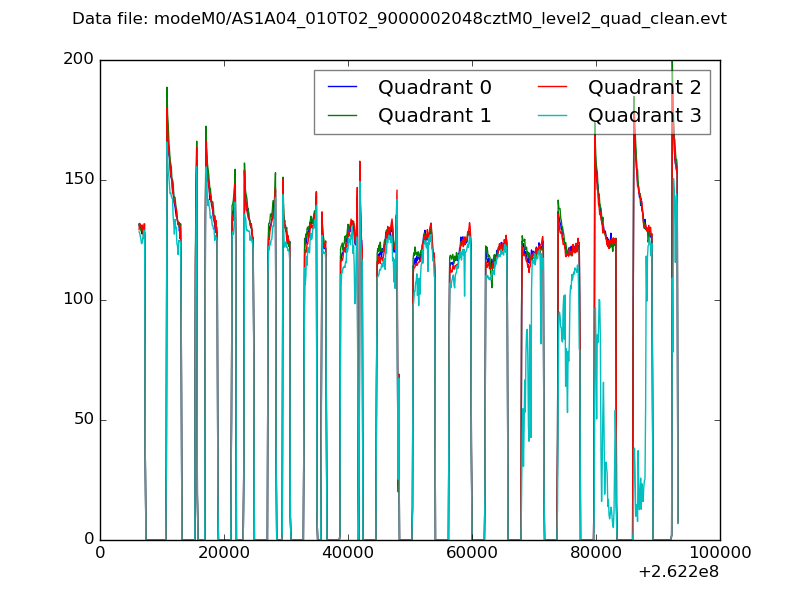 |
|
| Module-wise count rates for Quadrant A Data is divided into 100 sec bins |
 |
 |
| Module-wise count rates for Quadrant B Data is divided into 100 sec bins |
 |
 |
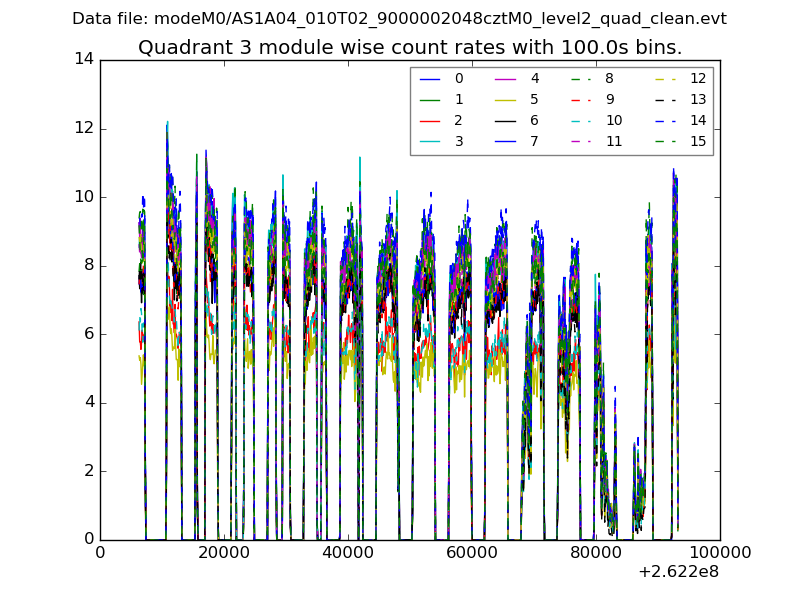
| Module-wise count rates for Quadrant C Data is divided into 100 sec bins |
 |
 |
| Module-wise count rates for Quadrant D Data is divided into 100 sec bins |
 |
 |
| Parameter | Plot |
|---|---|
| CZT HV Monitor |  |
| D_VDD | 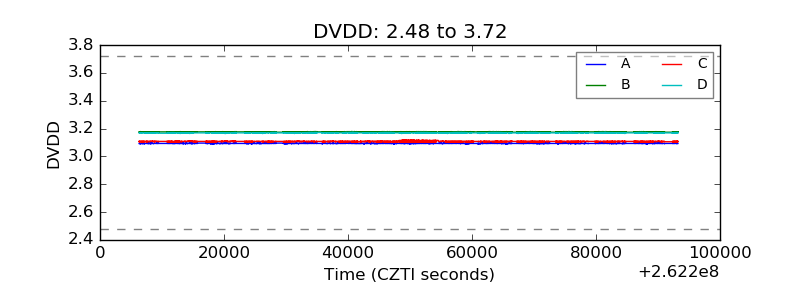 |
| Temperature 1 |  |
| Veto HV Monitor |  |
| Veto LLD | 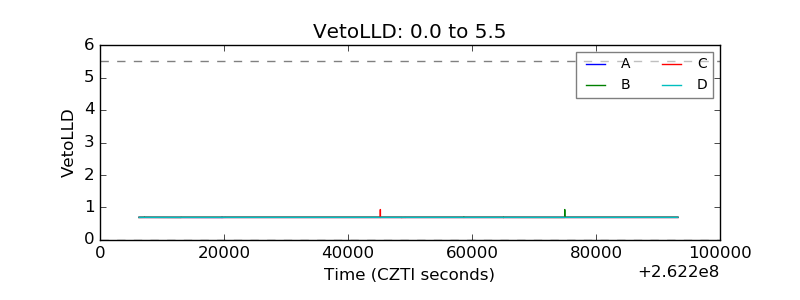 |
| Alpha Counter | 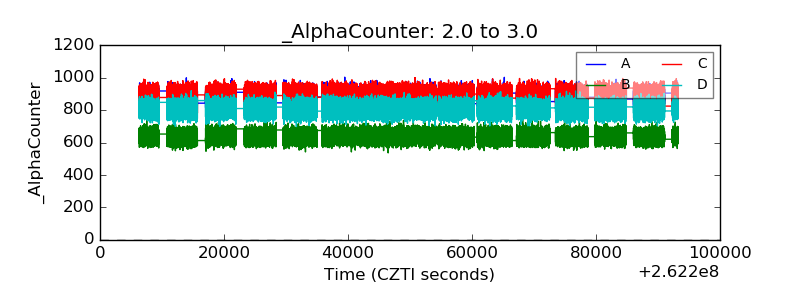 |
| _CPM_Rate |  |
| CZT Counter |  |
| +2.5 Volts monitor |  |
| +5 Volts monitor |  |
| _ROLL_ROT | 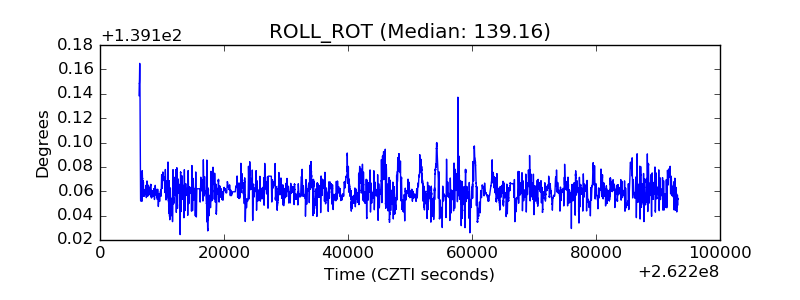 |
| _Roll_DEC |  |
| _Roll_RA |  |
| Veto Counter |  |