| Param | Original file | Final file |
|---|---|---|
| Filename | modeM0/AS1A04_010T02_9000002048_13894cztM0_level2.evt | modeM0/AS1A04_010T02_9000002048_13894cztM0_level2_quad_clean.evt |
| Size (bytes) | 322,606,080 | 52,657,920 |
| Size | 307.7 MB | 50.2 MB |
| Events in quadrant A | 2,133,092 | 323,558 |
| Events in quadrant B | 2,193,569 | 328,210 |
| Events in quadrant C | 2,330,409 | 324,258 |
| Events in quadrant D | 2,812,702 | 308,088 |
| Mode M0 | |||
|---|---|---|---|
| Quadrant | BADHDUFLAG | Total packets | Discarded packets |
| A | 0 | 9207 | 2 |
| B | 0 | 9294 | 1 |
| C | 0 | 9504 | 1 |
| D | 0 | 11443 | 1 |
| Mode SS | |||
|---|---|---|---|
| Quadrant | BADHDUFLAG | Total packets | Discarded packets |
| A | 0 | 90 | 0 |
| B | 0 | 90 | 0 |
| C | 0 | 90 | 0 |
| D | 0 | 90 | 0 |
| Mode M9 | |||
|---|---|---|---|
| Quadrant | BADHDUFLAG | Total packets | Discarded packets |
| A | 0 | 12 | 0 |
| B | 0 | 12 | 0 |
| C | 0 | 12 | 0 |
| D | 0 | 12 | 0 |
| Quadrant | Total seconds | Saturated seconds | Saturation percentage |
|---|---|---|---|
| A | 4408 | 52 | 1.179673% |
| B | 4408 | 54 | 1.225045% |
| C | 4408 | 40 | 0.907441% |
| D | 4408 | 122 | 2.767695% |
Noise dominated data is calculated using 1-second bins in cleaned event files. If a bin has >2000 counts, and if more than 50% of those come from <1% of pixels, then it is considered to be noise-dominated and hence unusable.
| Quadrant | # 1 sec bins | Bins with >0 counts | Bins with >2000 counts | High rate bins dominated by noise | Noise dominated (total time) | Noise dominated (detector-on time) | Marked lightcurve |
|---|---|---|---|---|---|---|---|
| A | 5694 | 4409 | 0 | 0 | 0.00% | 0.00% | 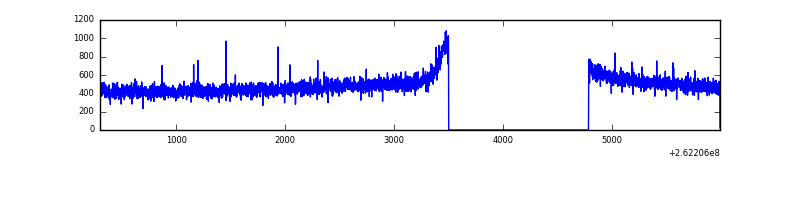 |
| B | 5694 | 4409 | 0 | 0 | 0.00% | 0.00% | 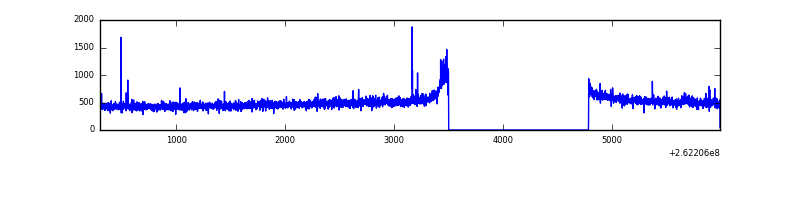 |
| C | 5694 | 4409 | 0 | 0 | 0.00% | 0.00% | 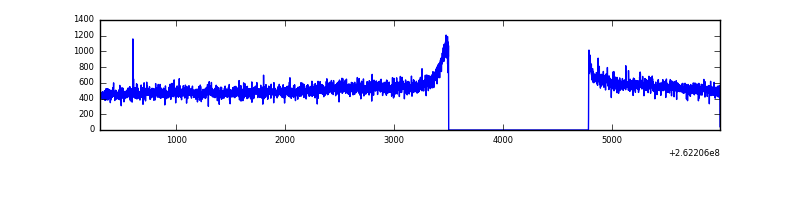 |
| D | 5694 | 4409 | 86 | 86 | 1.51% | 1.95% | 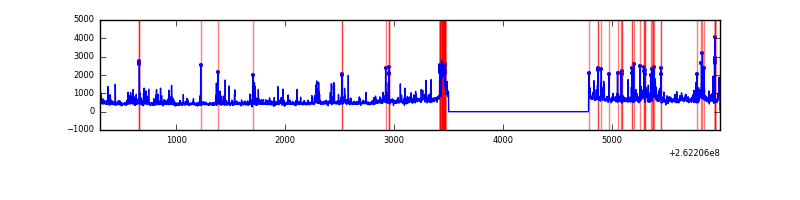 |
Top three noisy pixels from each quadrant. If the there are fewer than three noisy pixels in the level2.evt file, extra rows are filled as -1
| Pixel properties | Quadrant properties | ||||||
|---|---|---|---|---|---|---|---|
| Quadrant | DetID | PixID | Counts | Sigma | Mean | Median | Sigma |
| A | 1 | 162 | 6681 | 54.03 | 553 | 541 | 113.6 |
| A | 0 | 226 | 5059 | 39.76 | 553 | 541 | 113.6 |
| A | 12 | 194 | 4150 | 31.76 | 553 | 541 | 113.6 |
| B | 12 | 111 | 12116 | 110.07 | 551 | 539 | 105.2 |
| B | 0 | 214 | 11520 | 104.4 | 551 | 539 | 105.2 |
| B | 15 | 201 | 10652 | 96.15 | 551 | 539 | 105.2 |
| C | 3 | 233 | 219153 | 1724.75 | 540 | 545 | 126.7 |
| C | 13 | 61 | 3790 | 25.6 | 540 | 545 | 126.7 |
| C | 0 | 207 | 3584 | 23.98 | 540 | 545 | 126.7 |
| D | 1 | 52 | 483905 | 3836.81 | 526 | 517 | 126.0 |
| D | 13 | 122 | 137609 | 1088.14 | 526 | 517 | 126.0 |
| D | 5 | 222 | 43083 | 337.86 | 526 | 517 | 126.0 |
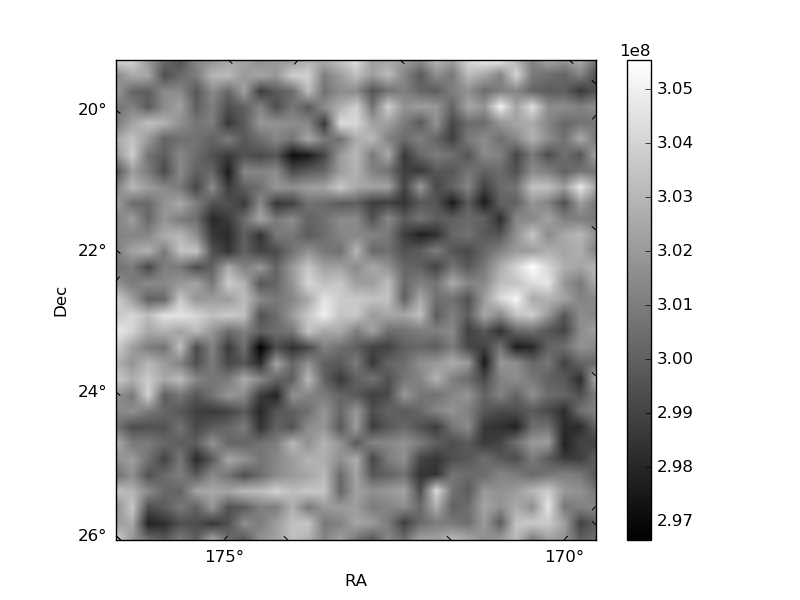
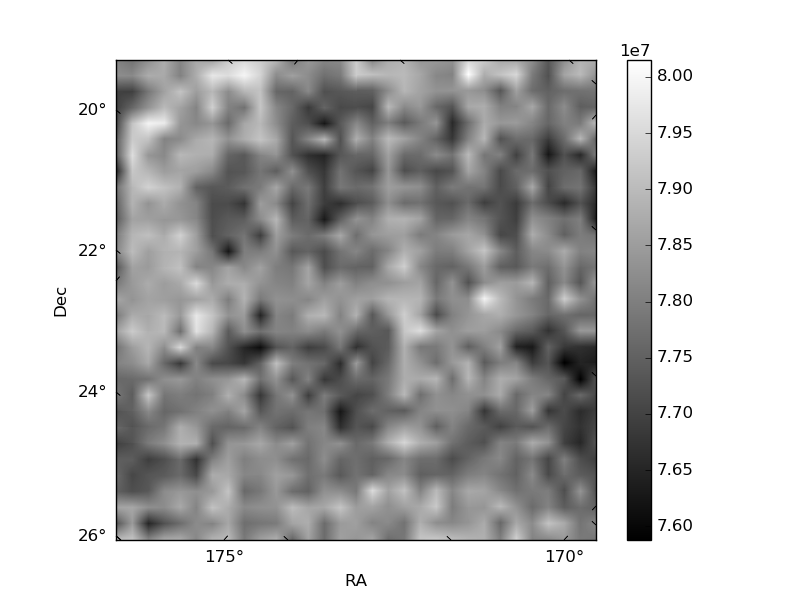
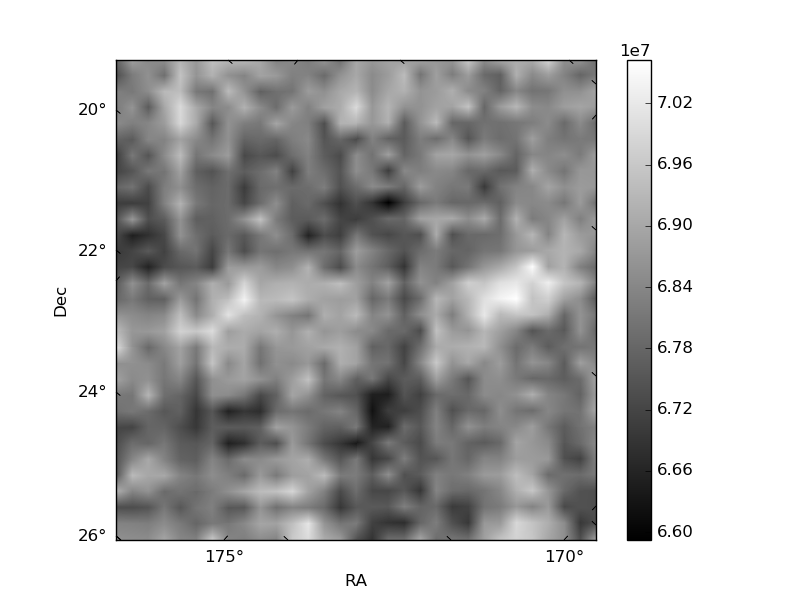
Histogram calculated using DETX and DETY for each event in the final _common_clean file
| Quadrant A | 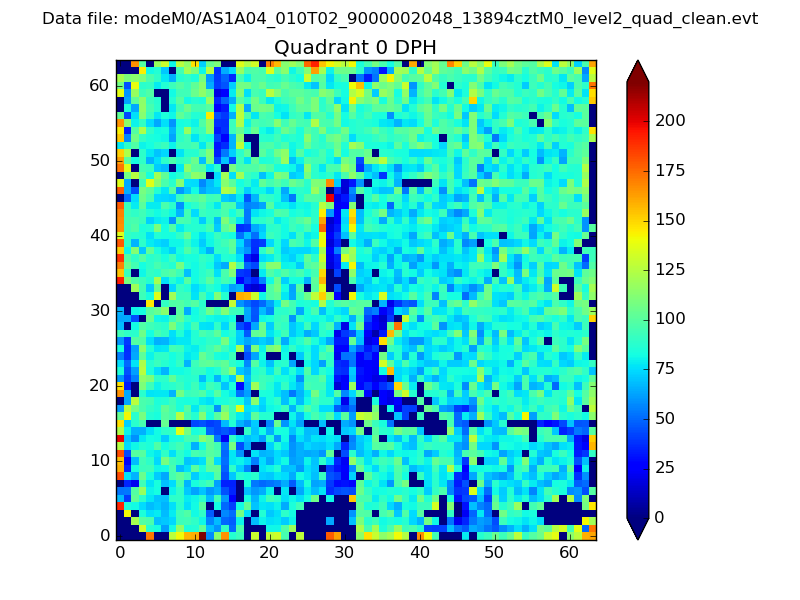 |
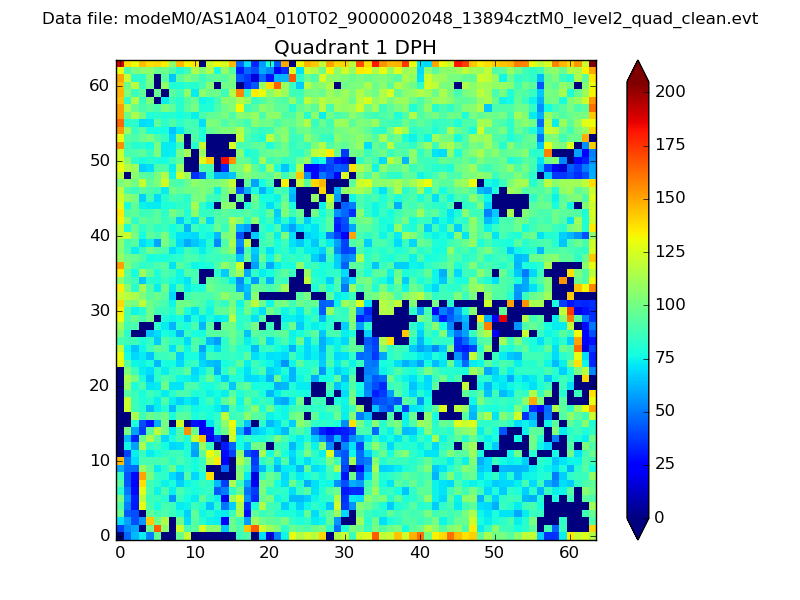 |
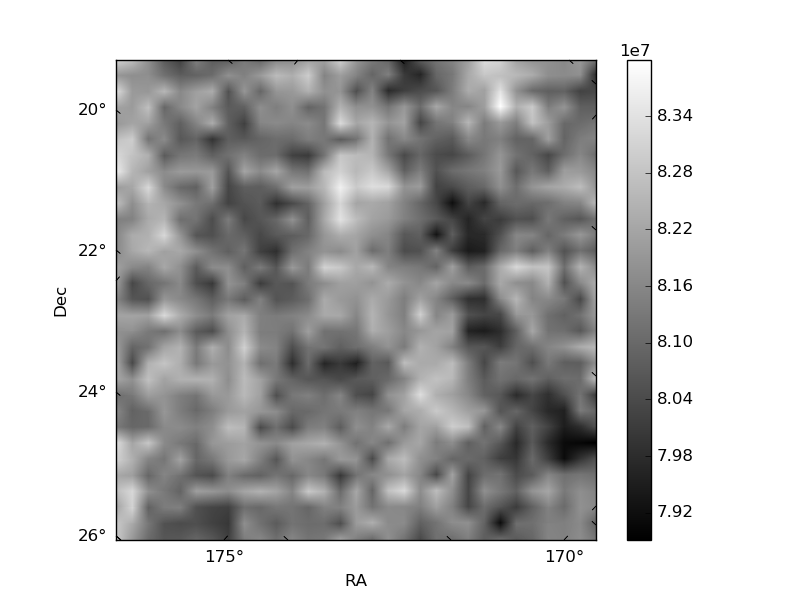
Quadrant B |
|---|---|---|---|
| Quadrant D | 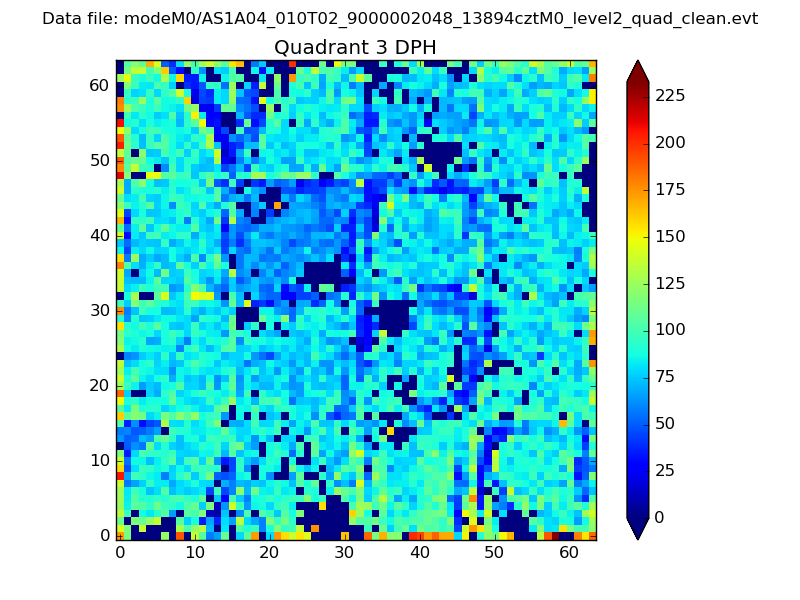 |
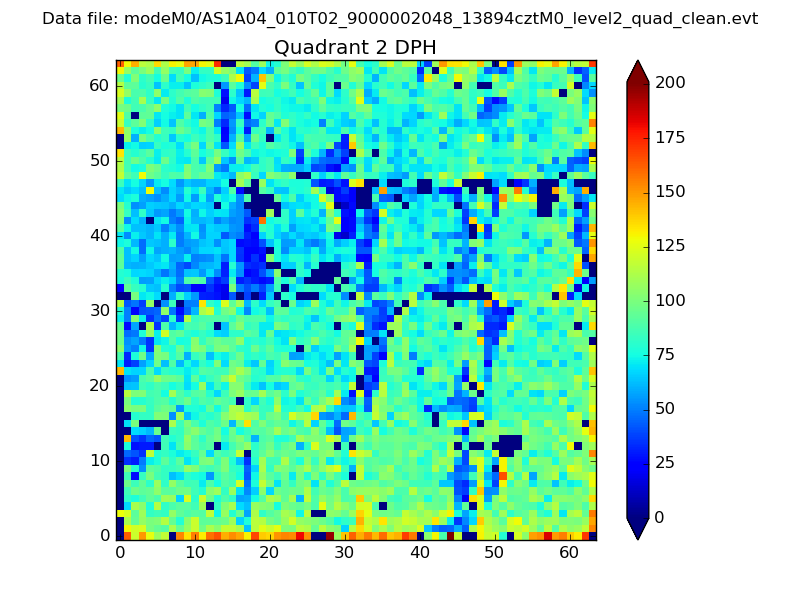 |
Quadrant C |
| Plot type | Count rate plots | Images |
|---|---|---|
| Comparison with Poisson distribution Blue bars denote a histogram of data divided into 1 sec bins. Red curve is a Poisson curve with rate = median count rate of data. |
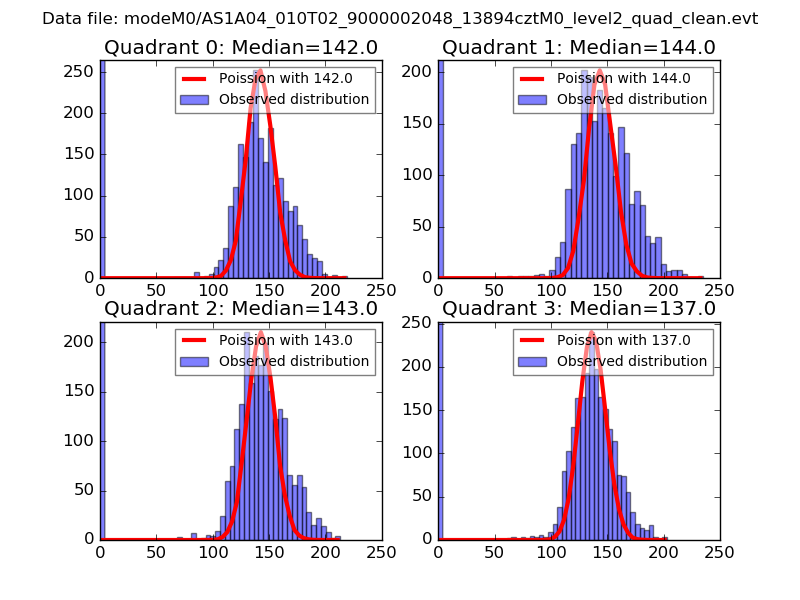 |
 |
| Quadrant-wise count rates Data is divided into 100 sec bins |
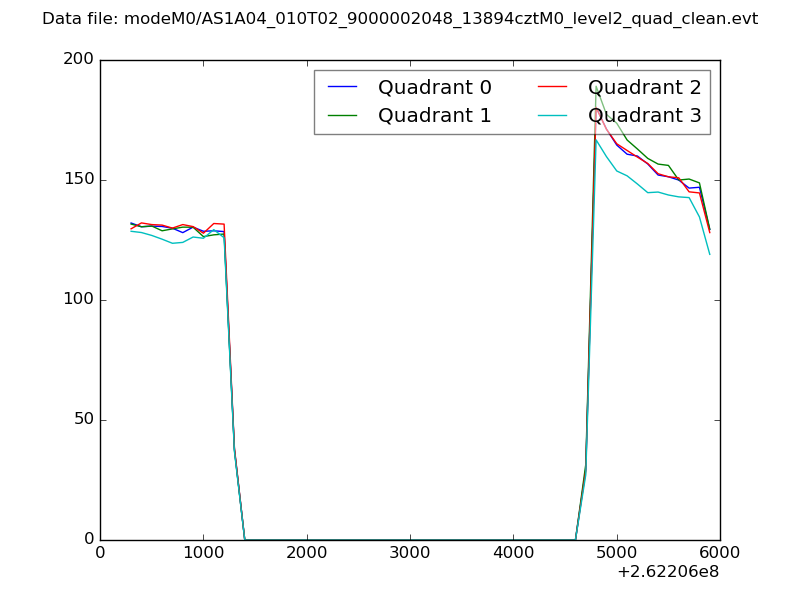 |
|
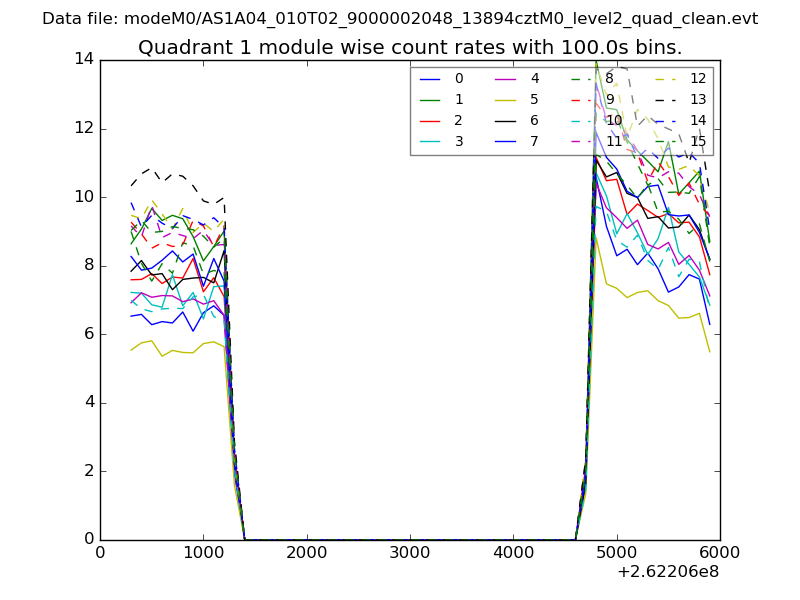
| Module-wise count rates for Quadrant A Data is divided into 100 sec bins |
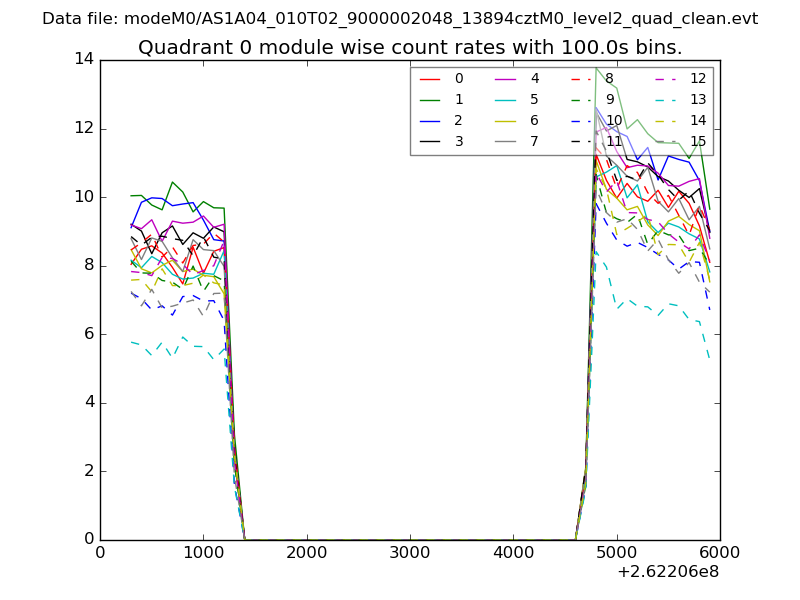 |
 |
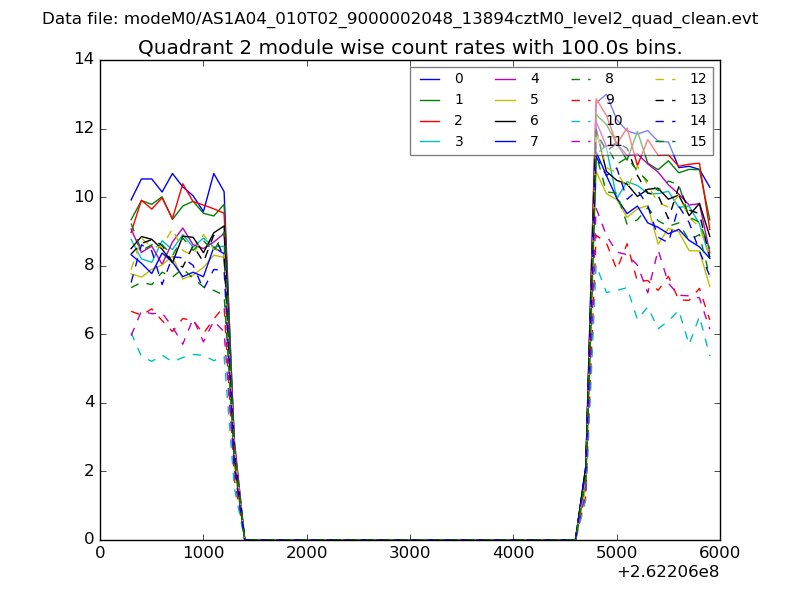
| Module-wise count rates for Quadrant B Data is divided into 100 sec bins |
 |
 |
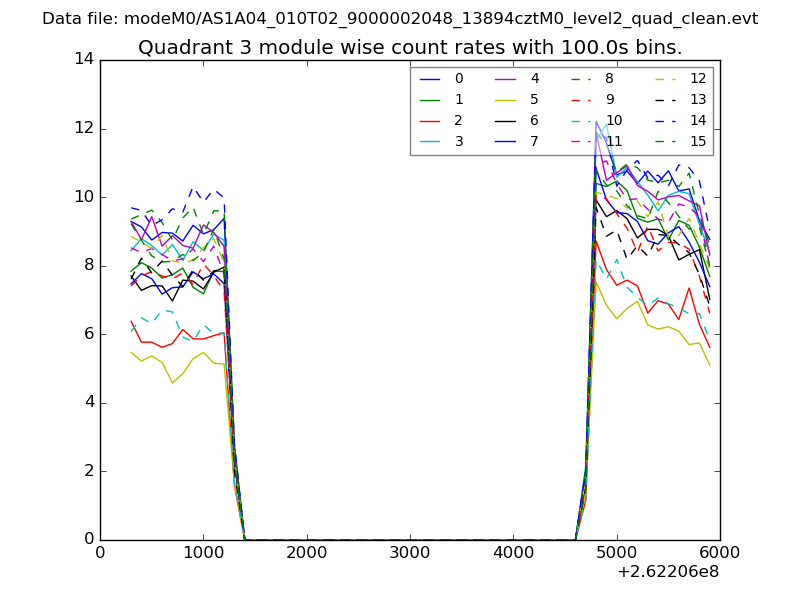
| Module-wise count rates for Quadrant C Data is divided into 100 sec bins |
 |
 |
| Module-wise count rates for Quadrant D Data is divided into 100 sec bins |
 |
 |
| Parameter | Plot |
|---|---|
| CZT HV Monitor | 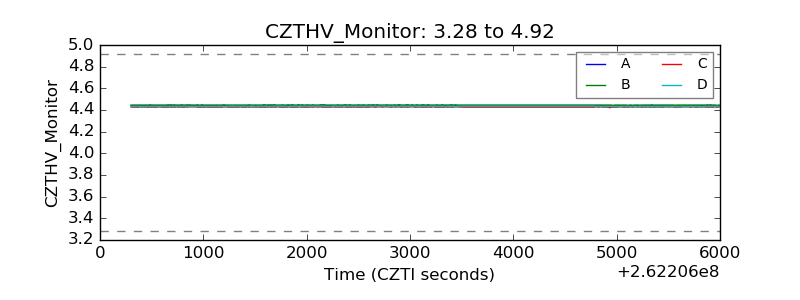 |
| D_VDD |  |
| Temperature 1 | 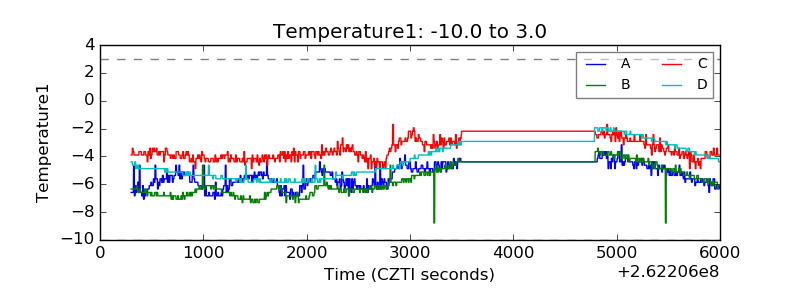 |
| Veto HV Monitor |  |
| Veto LLD | 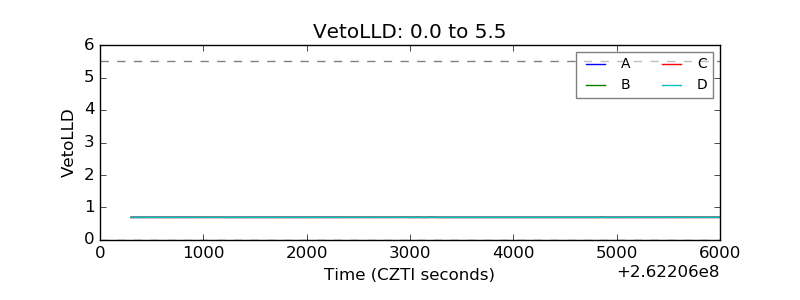 |
| Alpha Counter | 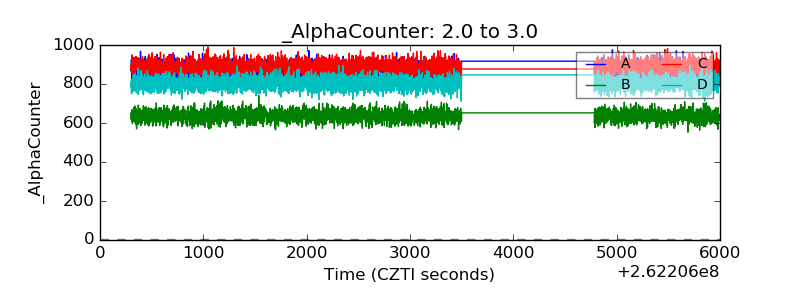 |
| _CPM_Rate |  |
| CZT Counter | 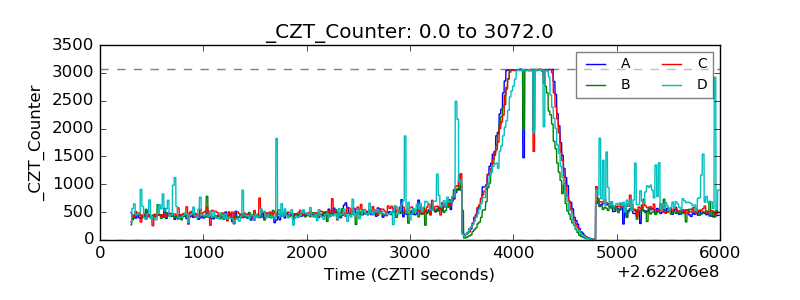 |
| +2.5 Volts monitor |  |
| +5 Volts monitor |  |
| _ROLL_ROT | 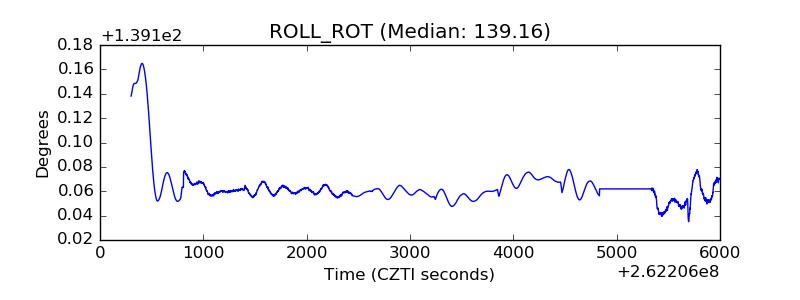 |
| _Roll_DEC | 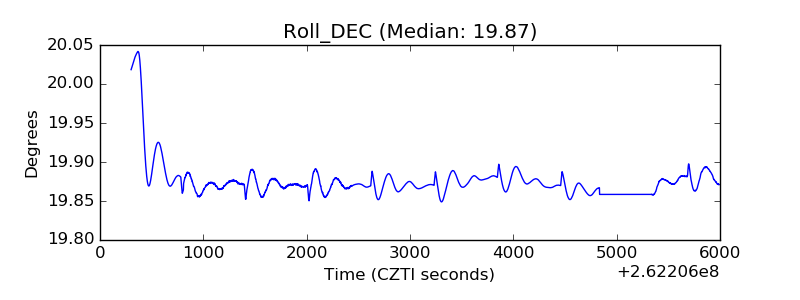 |
| _Roll_RA |  |
| Veto Counter | 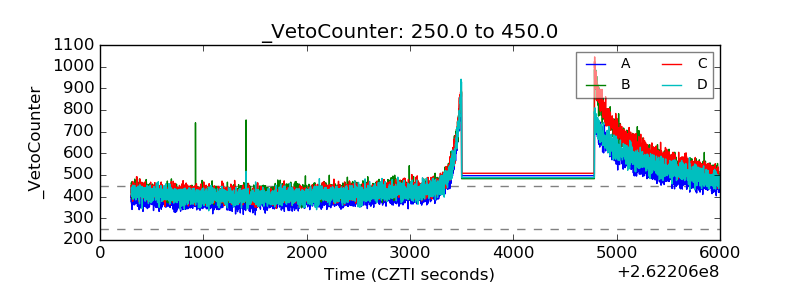 |