| Param | Original file | Final file |
|---|---|---|
| Filename | modeM0/AS1A04_010T02_9000002048_13896cztM0_level2.evt | modeM0/AS1A04_010T02_9000002048_13896cztM0_level2_quad_clean.evt |
| Size (bytes) | 449,449,920 | 89,631,360 |
| Size | 428.6 MB | 85.5 MB |
| Events in quadrant A | 3,100,377 | 572,395 |
| Events in quadrant B | 3,175,086 | 584,616 |
| Events in quadrant C | 3,169,472 | 572,789 |
| Events in quadrant D | 3,737,520 | 543,745 |
| Mode M0 | |||
|---|---|---|---|
| Quadrant | BADHDUFLAG | Total packets | Discarded packets |
| A | 0 | 13372 | 3 |
| B | 0 | 13420 | 2 |
| C | 0 | 13229 | 2 |
| D | 0 | 15297 | 2 |
| Mode SS | |||
|---|---|---|---|
| Quadrant | BADHDUFLAG | Total packets | Discarded packets |
| A | 0 | 128 | 0 |
| B | 0 | 128 | 0 |
| C | 0 | 128 | 0 |
| D | 0 | 128 | 0 |
| Mode M9 | |||
|---|---|---|---|
| Quadrant | BADHDUFLAG | Total packets | Discarded packets |
| A | 0 | 21 | 0 |
| B | 0 | 21 | 0 |
| C | 0 | 21 | 0 |
| D | 0 | 22 | 0 |
| Quadrant | Total seconds | Saturated seconds | Saturation percentage |
|---|---|---|---|
| A | 6318 | 16 | 0.253245% |
| B | 6318 | 48 | 0.759734% |
| C | 6318 | 8 | 0.126622% |
| D | 6318 | 92 | 1.456157% |
Noise dominated data is calculated using 1-second bins in cleaned event files. If a bin has >2000 counts, and if more than 50% of those come from <1% of pixels, then it is considered to be noise-dominated and hence unusable.
| Quadrant | # 1 sec bins | Bins with >0 counts | Bins with >2000 counts | High rate bins dominated by noise | Noise dominated (total time) | Noise dominated (detector-on time) | Marked lightcurve |
|---|---|---|---|---|---|---|---|
| A | 7619 | 6320 | 0 | 0 | 0.00% | 0.00% | 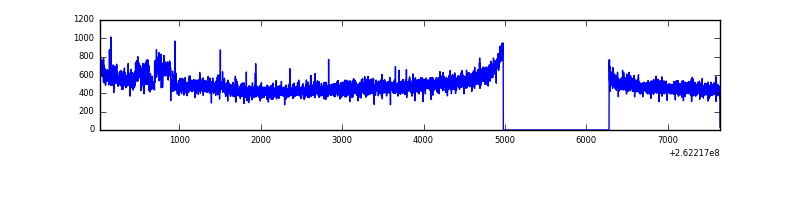 |
| B | 7619 | 6320 | 20 | 20 | 0.26% | 0.32% | 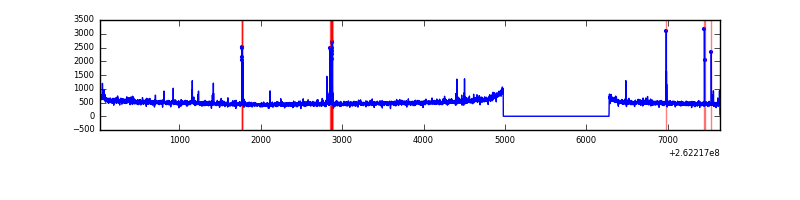 |
| C | 7619 | 6320 | 0 | 0 | 0.00% | 0.00% | 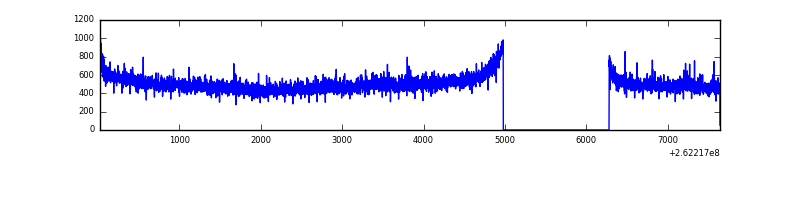 |
| D | 7619 | 6320 | 78 | 78 | 1.02% | 1.23% | 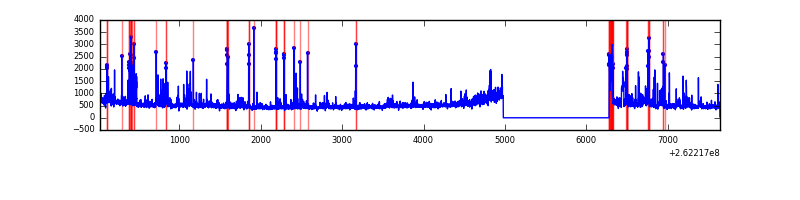 |
Top three noisy pixels from each quadrant. If the there are fewer than three noisy pixels in the level2.evt file, extra rows are filled as -1
| Pixel properties | Quadrant properties | ||||||
|---|---|---|---|---|---|---|---|
| Quadrant | DetID | PixID | Counts | Sigma | Mean | Median | Sigma |
| A | 0 | 23 | 87321 | 551.76 | 777 | 761 | 156.9 |
| A | 1 | 162 | 13149 | 78.96 | 777 | 761 | 156.9 |
| A | 0 | 226 | 12291 | 73.5 | 777 | 761 | 156.9 |
| B | 4 | 80 | 78936 | 532.04 | 778 | 759 | 146.9 |
| B | 0 | 214 | 18170 | 118.49 | 778 | 759 | 146.9 |
| B | 12 | 111 | 17539 | 114.2 | 778 | 759 | 146.9 |
| C | 3 | 233 | 206776 | 1174.83 | 758 | 763 | 175.4 |
| C | 13 | 61 | 5415 | 26.53 | 758 | 763 | 175.4 |
| C | 0 | 207 | 3418 | 15.14 | 758 | 763 | 175.4 |
| D | 1 | 52 | 637891 | 3606.3 | 742 | 726 | 176.7 |
| D | 13 | 189 | 77274 | 433.26 | 742 | 726 | 176.7 |
| D | 8 | 195 | 66753 | 373.71 | 742 | 726 | 176.7 |
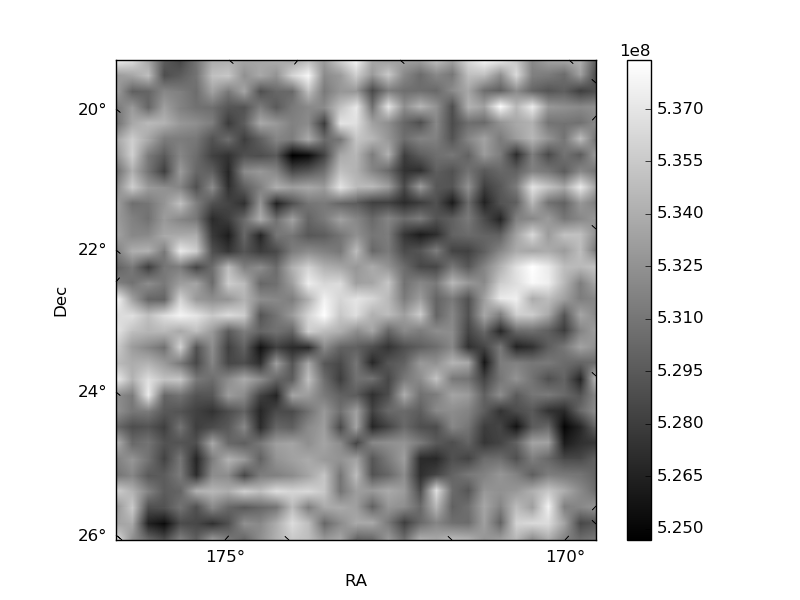
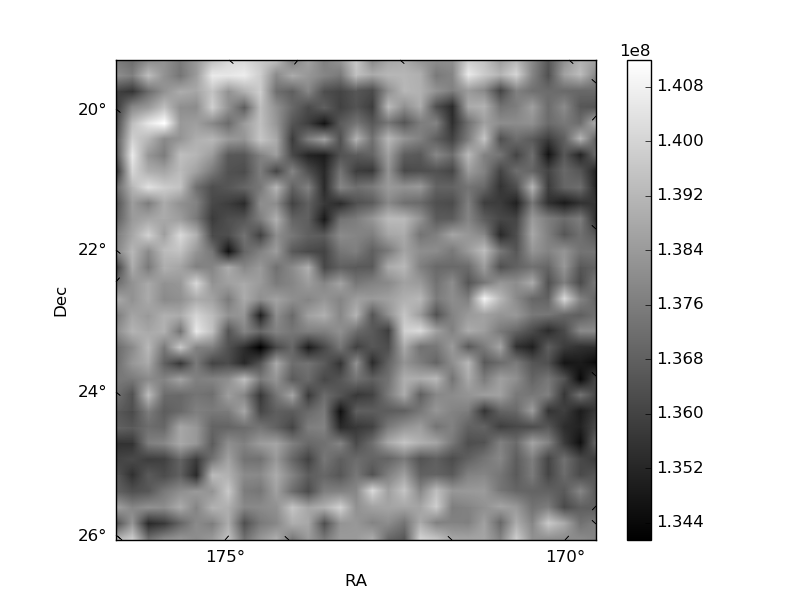
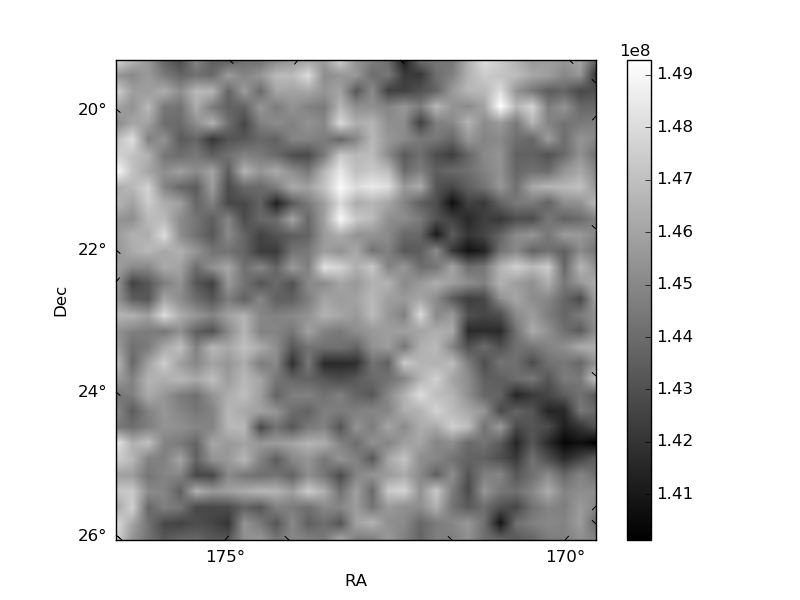
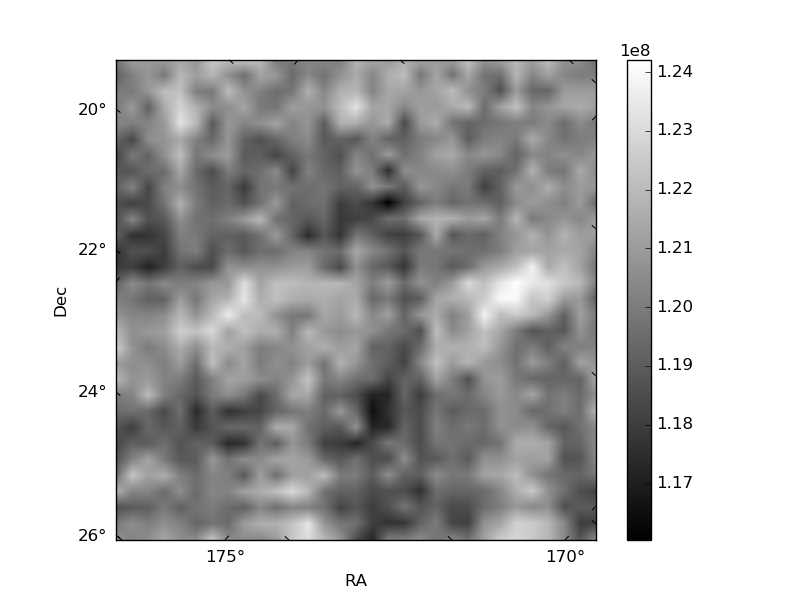
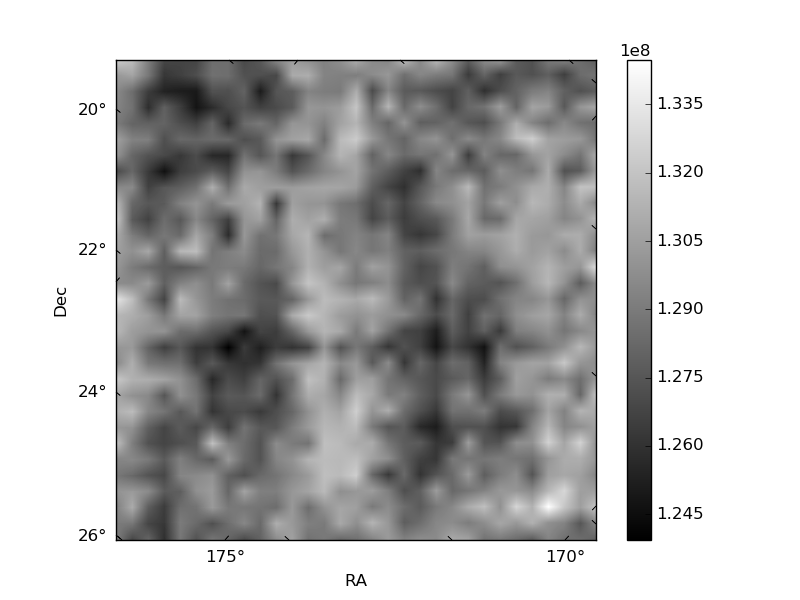
Histogram calculated using DETX and DETY for each event in the final _common_clean file
| Quadrant A | 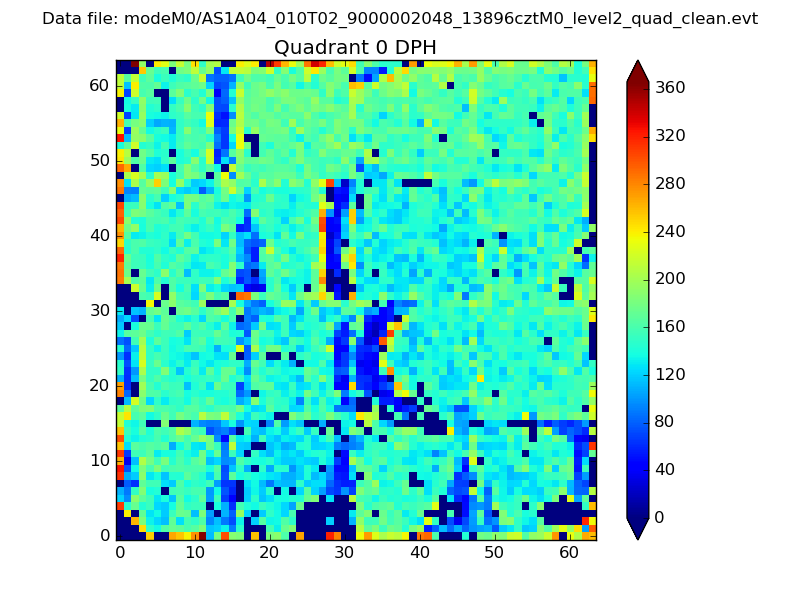 |
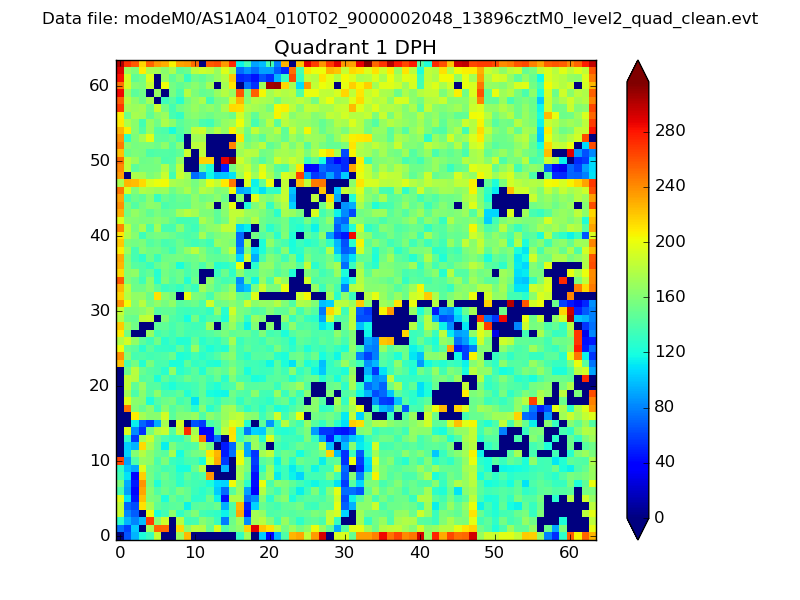 |
Quadrant B |
|---|---|---|---|
| Quadrant D | 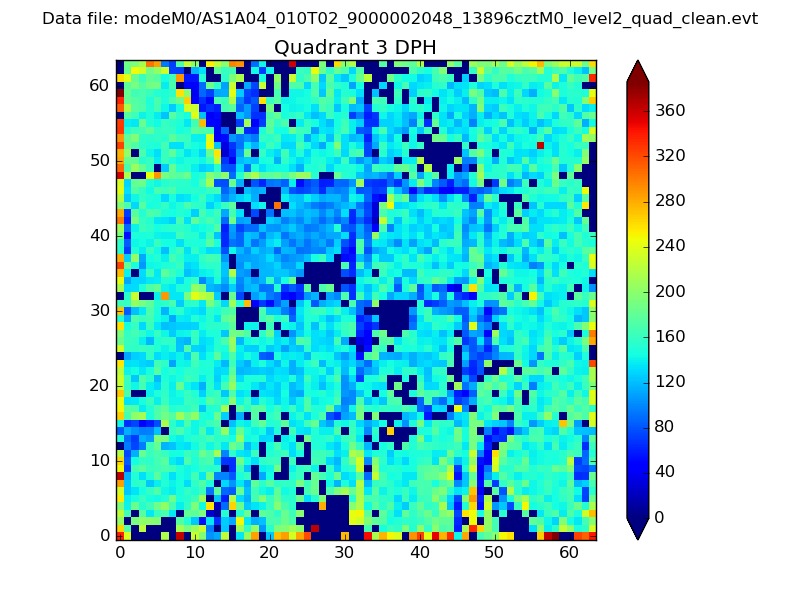 |
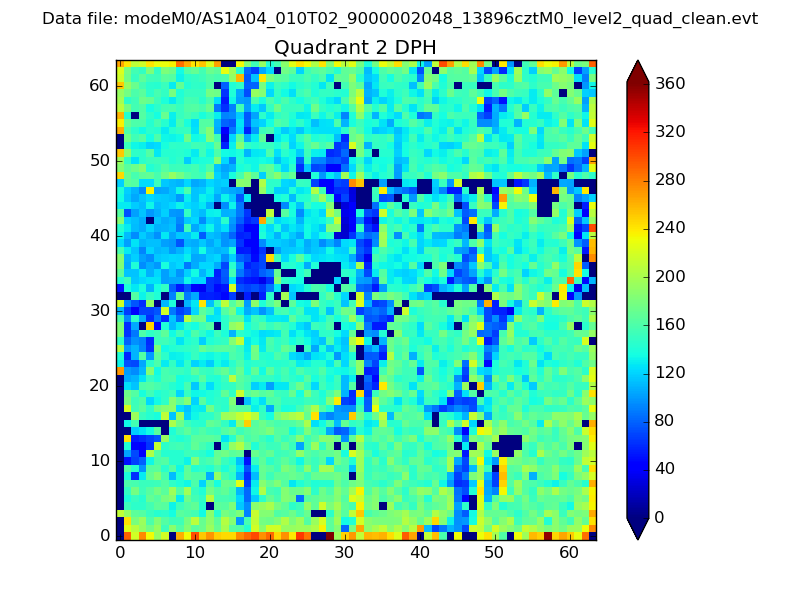 |
Quadrant C |
| Plot type | Count rate plots | Images |
|---|---|---|
| Comparison with Poisson distribution Blue bars denote a histogram of data divided into 1 sec bins. Red curve is a Poisson curve with rate = median count rate of data. |
 |
 |
| Quadrant-wise count rates Data is divided into 100 sec bins |
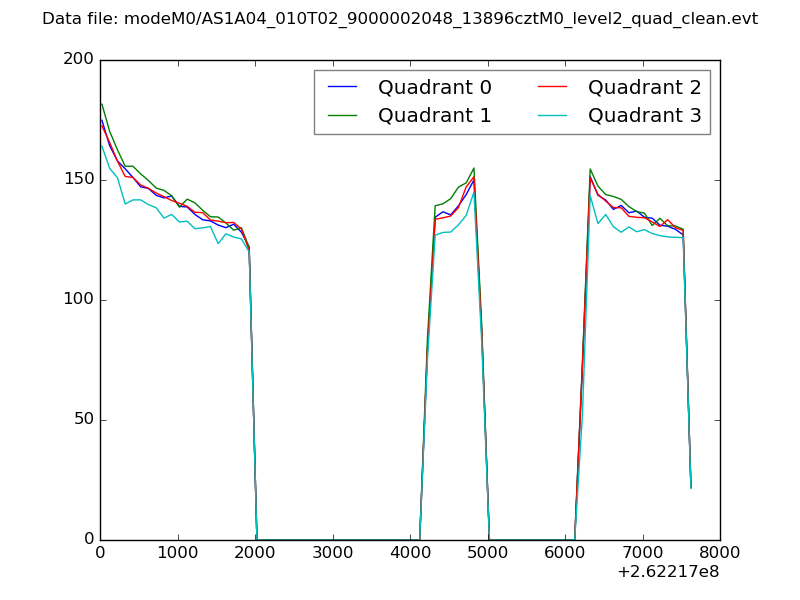 |
|
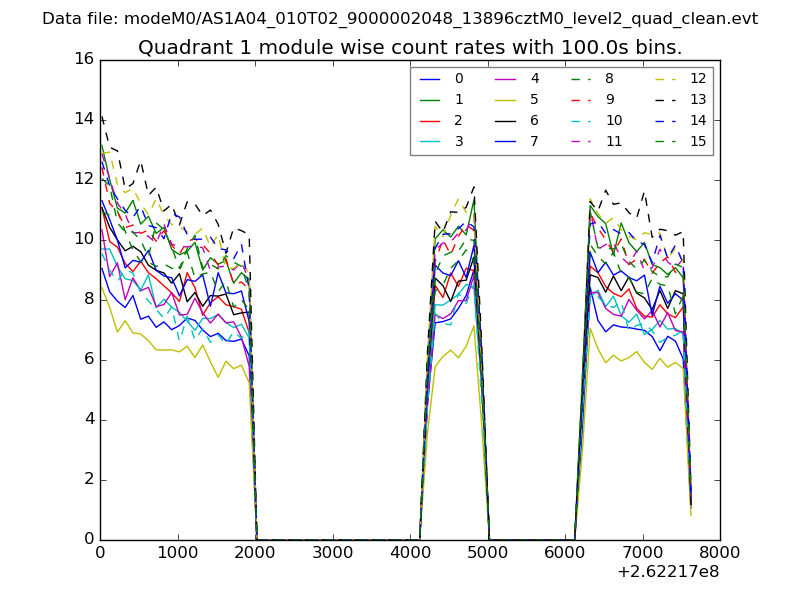
| Module-wise count rates for Quadrant A Data is divided into 100 sec bins |
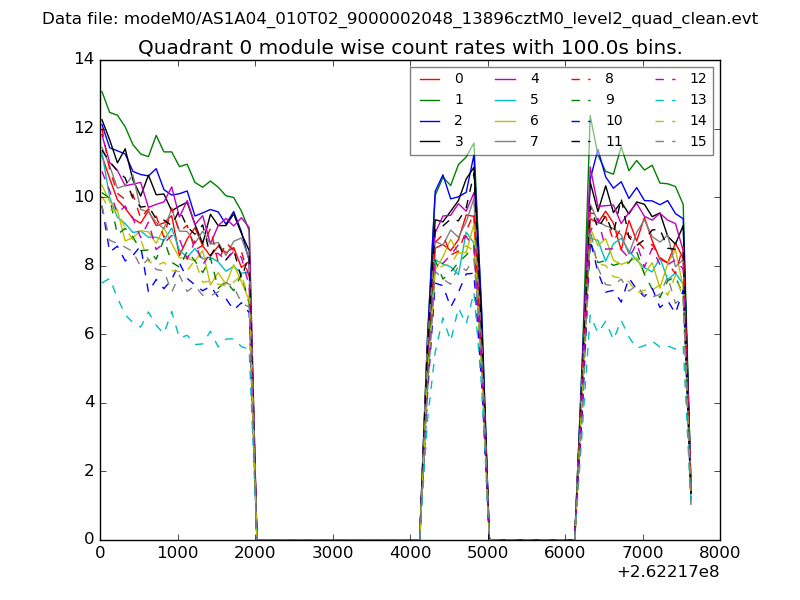 |
 |
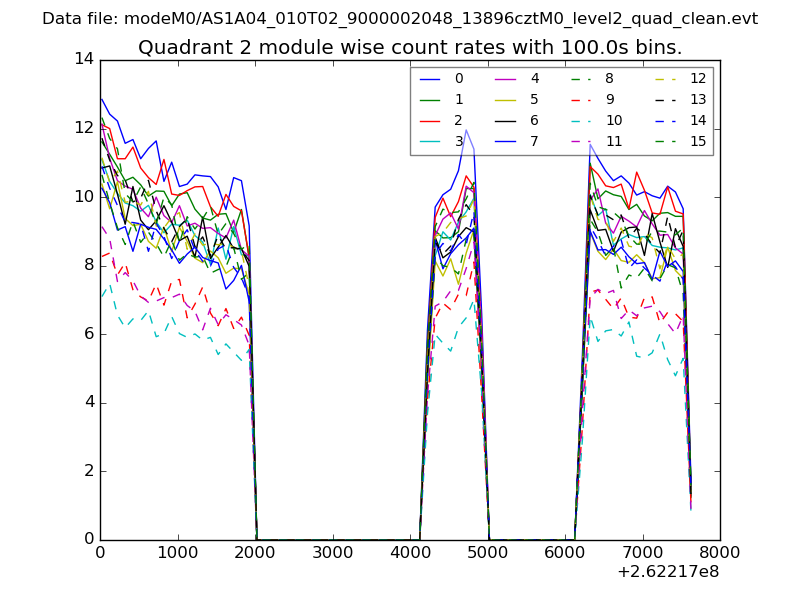
| Module-wise count rates for Quadrant B Data is divided into 100 sec bins |
 |
 |
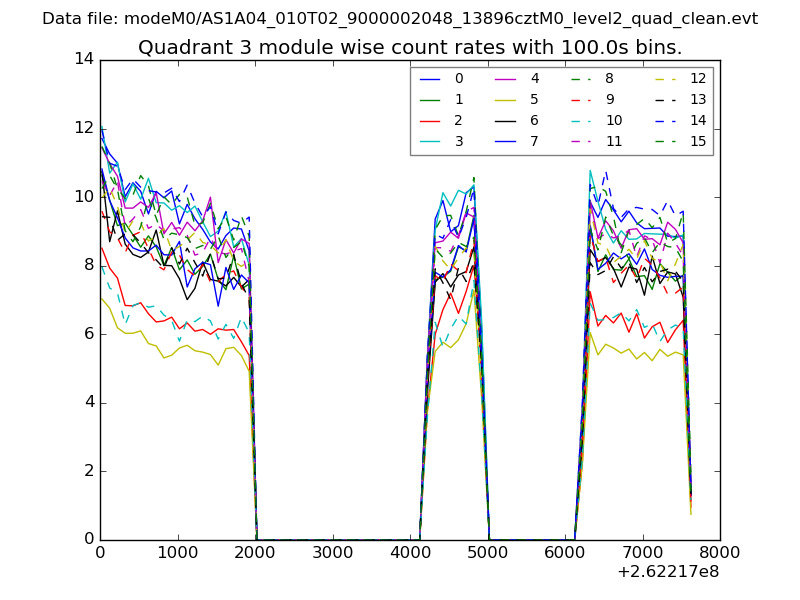
| Module-wise count rates for Quadrant C Data is divided into 100 sec bins |
 |
 |
| Module-wise count rates for Quadrant D Data is divided into 100 sec bins |
 |
 |
| Parameter | Plot |
|---|---|
| CZT HV Monitor | 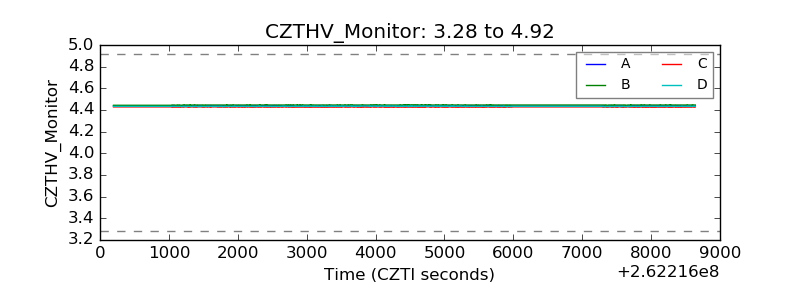 |
| D_VDD | 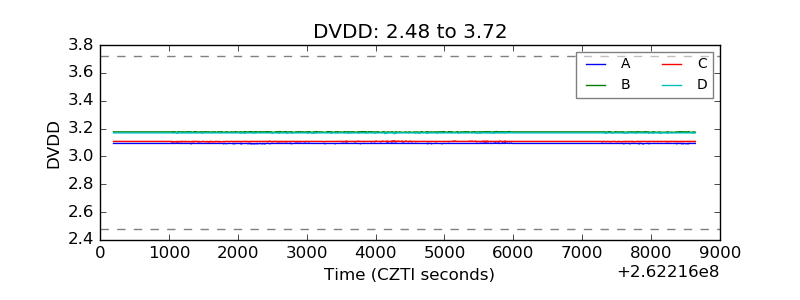 |
| Temperature 1 | 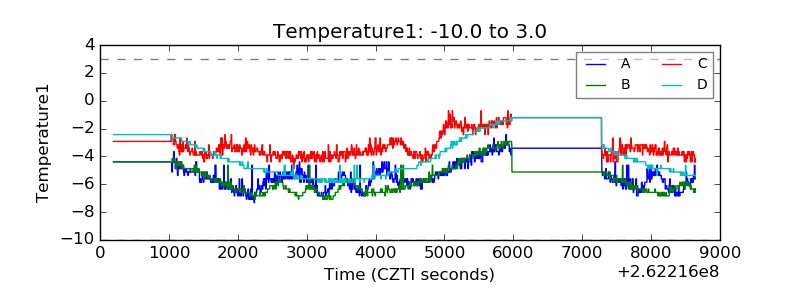 |
| Veto HV Monitor | 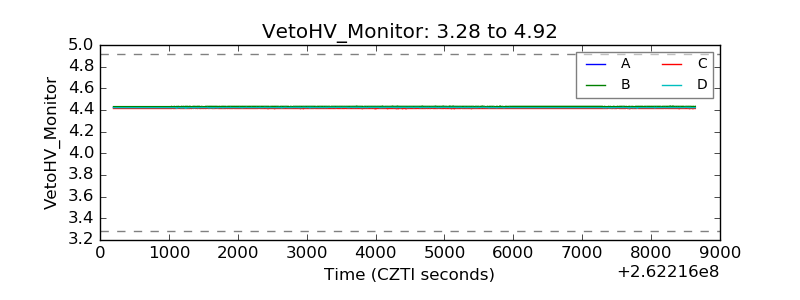 |
| Veto LLD | 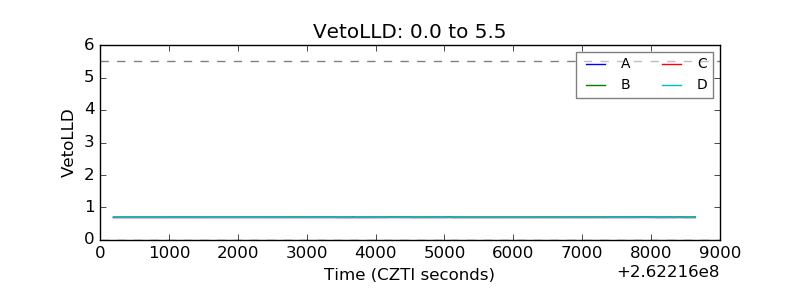 |
| Alpha Counter | 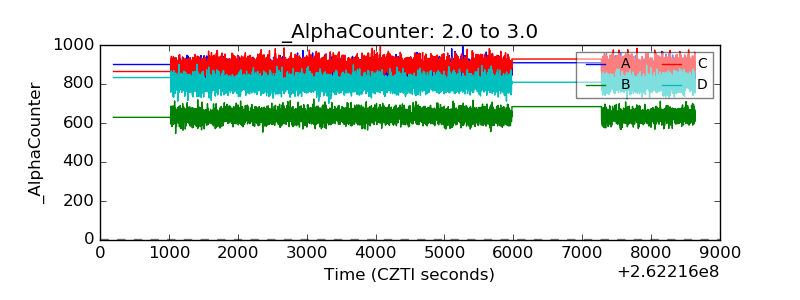 |
| _CPM_Rate | 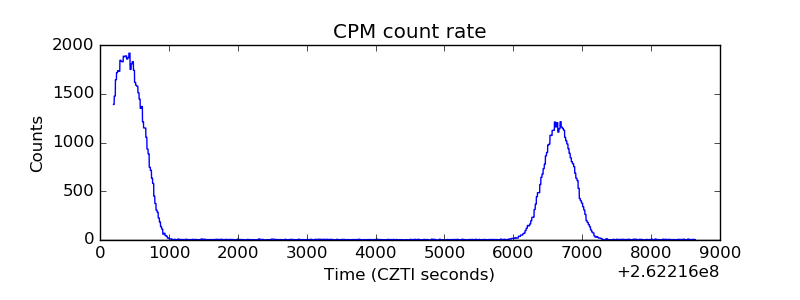 |
| CZT Counter | 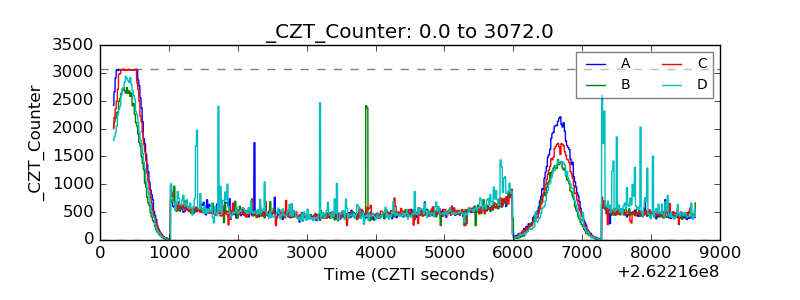 |
| +2.5 Volts monitor |  |
| +5 Volts monitor | 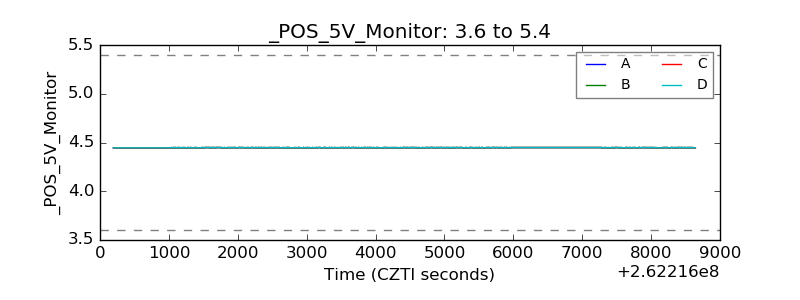 |
| _ROLL_ROT | 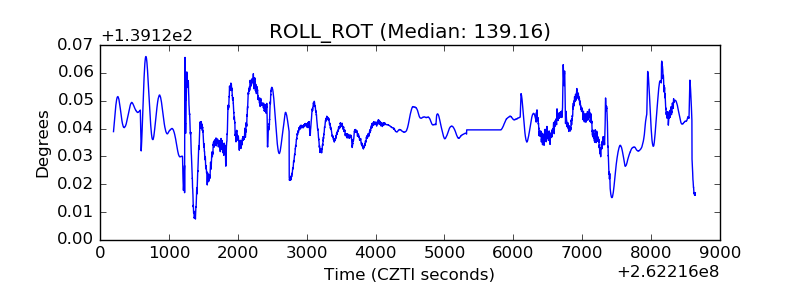 |
| _Roll_DEC | 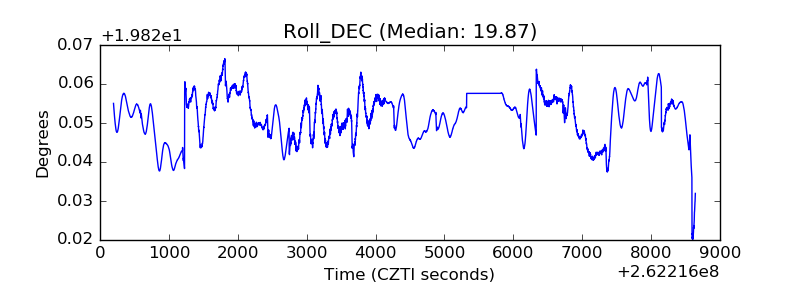 |
| _Roll_RA | 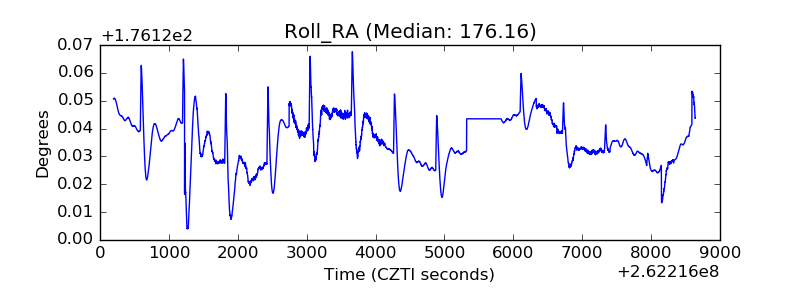 |
| Veto Counter | 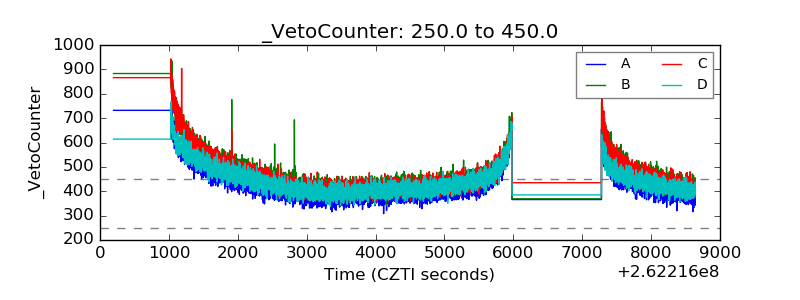 |