| Param | Original file | Final file |
|---|---|---|
| Filename | modeM0/AS1A04_010T02_9000002048_13897cztM0_level2.evt | modeM0/AS1A04_010T02_9000002048_13897cztM0_level2_quad_clean.evt |
| Size (bytes) | 458,363,520 | 90,432,000 |
| Size | 437.1 MB | 86.2 MB |
| Events in quadrant A | 3,139,406 | 574,765 |
| Events in quadrant B | 3,252,614 | 582,460 |
| Events in quadrant C | 3,287,307 | 571,662 |
| Events in quadrant D | 3,749,966 | 545,706 |
| Mode M0 | |||
|---|---|---|---|
| Quadrant | BADHDUFLAG | Total packets | Discarded packets |
| A | 0 | 13769 | 3 |
| B | 0 | 14020 | 2 |
| C | 0 | 13901 | 2 |
| D | 0 | 15707 | 2 |
| Mode SS | |||
|---|---|---|---|
| Quadrant | BADHDUFLAG | Total packets | Discarded packets |
| A | 0 | 136 | 0 |
| B | 0 | 136 | 0 |
| C | 0 | 136 | 0 |
| D | 0 | 136 | 0 |
| Mode M9 | |||
|---|---|---|---|
| Quadrant | BADHDUFLAG | Total packets | Discarded packets |
| A | 0 | 24 | 0 |
| B | 0 | 24 | 0 |
| C | 0 | 24 | 0 |
| D | 0 | 24 | 0 |
| Quadrant | Total seconds | Saturated seconds | Saturation percentage |
|---|---|---|---|
| A | 6659 | 23 | 0.345397% |
| B | 6659 | 50 | 0.750863% |
| C | 6659 | 11 | 0.165190% |
| D | 6659 | 76 | 1.141313% |
Noise dominated data is calculated using 1-second bins in cleaned event files. If a bin has >2000 counts, and if more than 50% of those come from <1% of pixels, then it is considered to be noise-dominated and hence unusable.
| Quadrant | # 1 sec bins | Bins with >0 counts | Bins with >2000 counts | High rate bins dominated by noise | Noise dominated (total time) | Noise dominated (detector-on time) | Marked lightcurve |
|---|---|---|---|---|---|---|---|
| A | 9030 | 6662 | 0 | 0 | 0.00% | 0.00% | 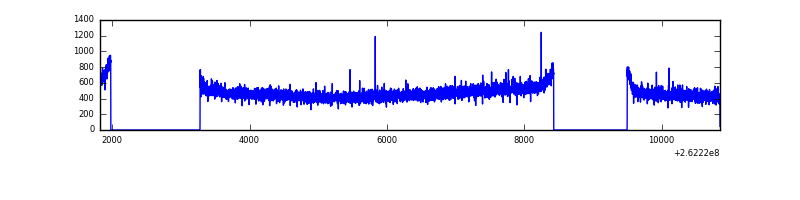 |
| B | 9030 | 6662 | 11 | 11 | 0.12% | 0.17% | 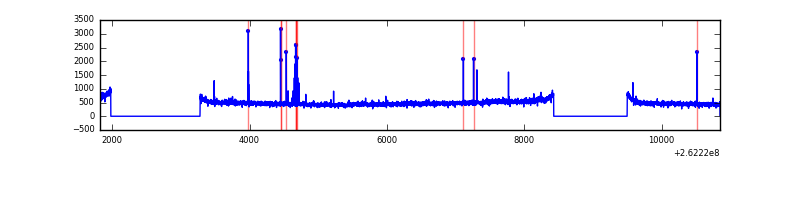 |
| C | 9030 | 6662 | 0 | 0 | 0.00% | 0.00% | 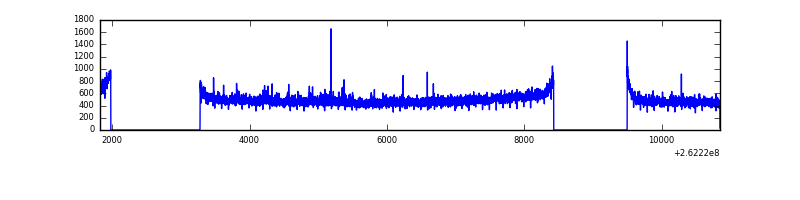 |
| D | 9030 | 6662 | 67 | 67 | 0.74% | 1.01% | 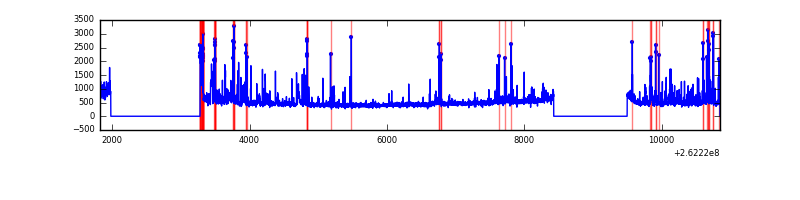 |
Top three noisy pixels from each quadrant. If the there are fewer than three noisy pixels in the level2.evt file, extra rows are filled as -1
| Pixel properties | Quadrant properties | ||||||
|---|---|---|---|---|---|---|---|
| Quadrant | DetID | PixID | Counts | Sigma | Mean | Median | Sigma |
| A | 1 | 162 | 15037 | 85.7 | 811 | 794 | 166.2 |
| A | 0 | 226 | 7235 | 38.76 | 811 | 794 | 166.2 |
| A | 12 | 194 | 6128 | 32.1 | 811 | 794 | 166.2 |
| B | 4 | 80 | 52359 | 334.59 | 810 | 789 | 154.1 |
| B | 12 | 111 | 18709 | 116.27 | 810 | 789 | 154.1 |
| B | 11 | 111 | 15729 | 96.93 | 810 | 789 | 154.1 |
| C | 3 | 233 | 213873 | 1159.58 | 788 | 793 | 183.8 |
| C | 13 | 61 | 5604 | 26.18 | 788 | 793 | 183.8 |
| C | 12 | 4 | 3742 | 16.05 | 788 | 793 | 183.8 |
| D | 1 | 52 | 505363 | 2744.15 | 774 | 756 | 183.9 |
| D | 13 | 189 | 83044 | 447.5 | 774 | 756 | 183.9 |
| D | 10 | 157 | 57980 | 311.2 | 774 | 756 | 183.9 |
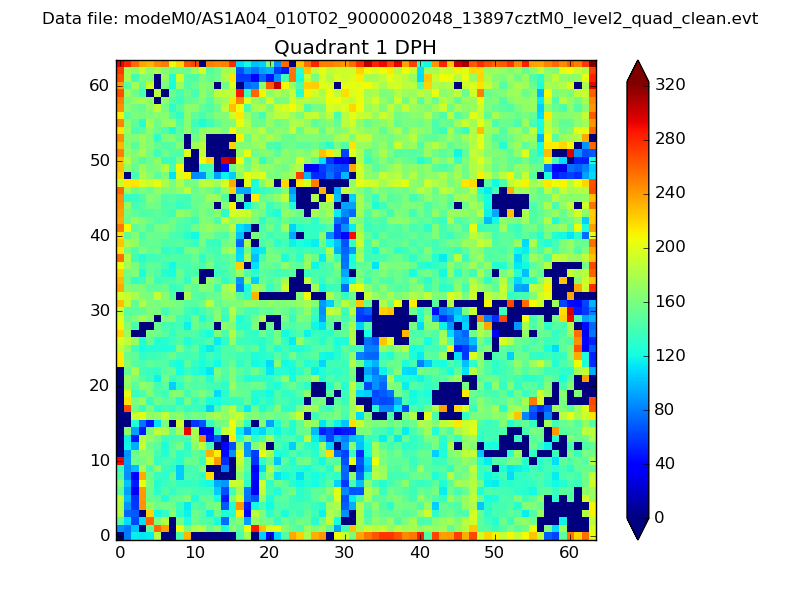
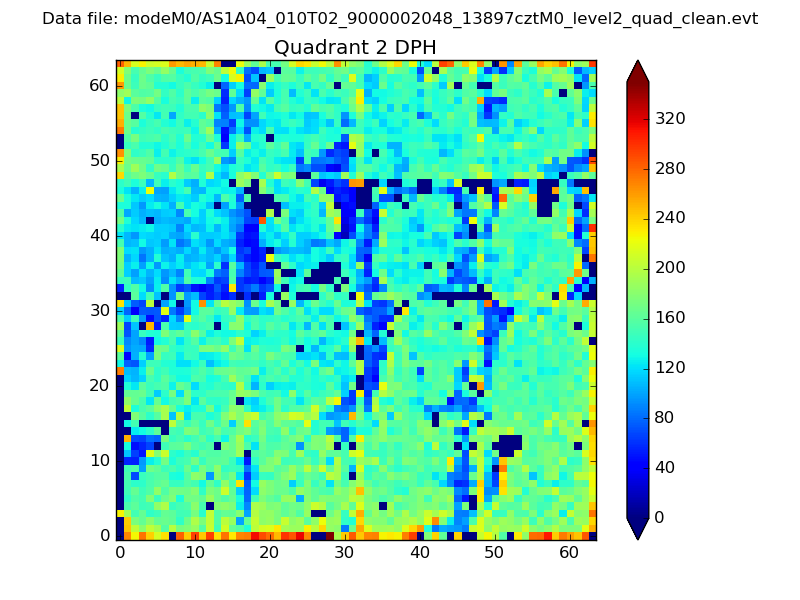
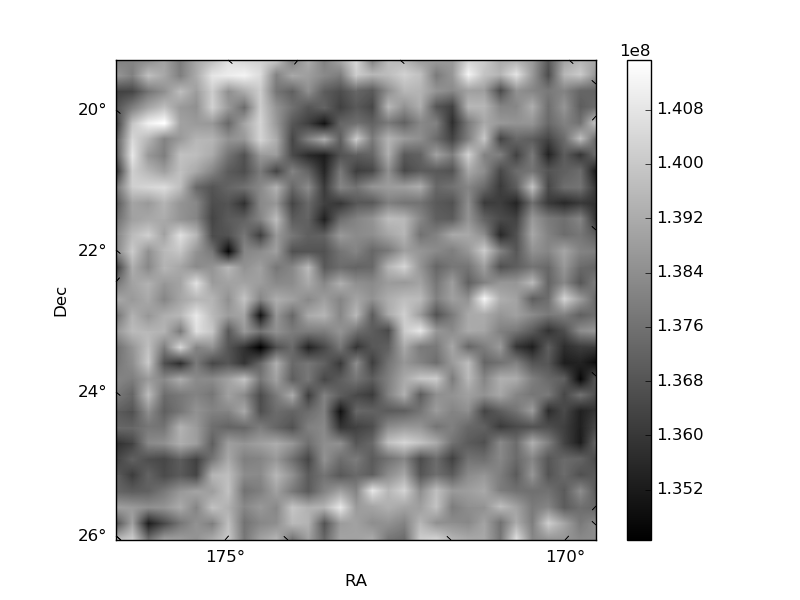
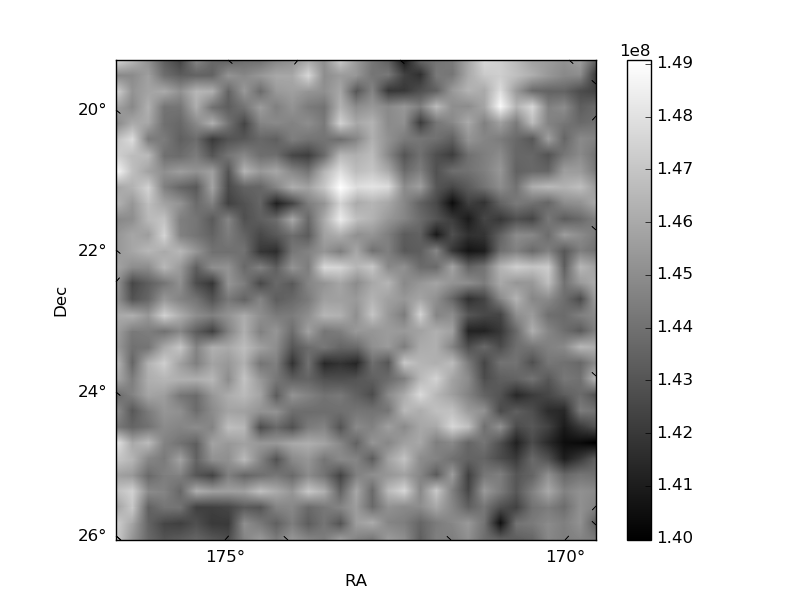
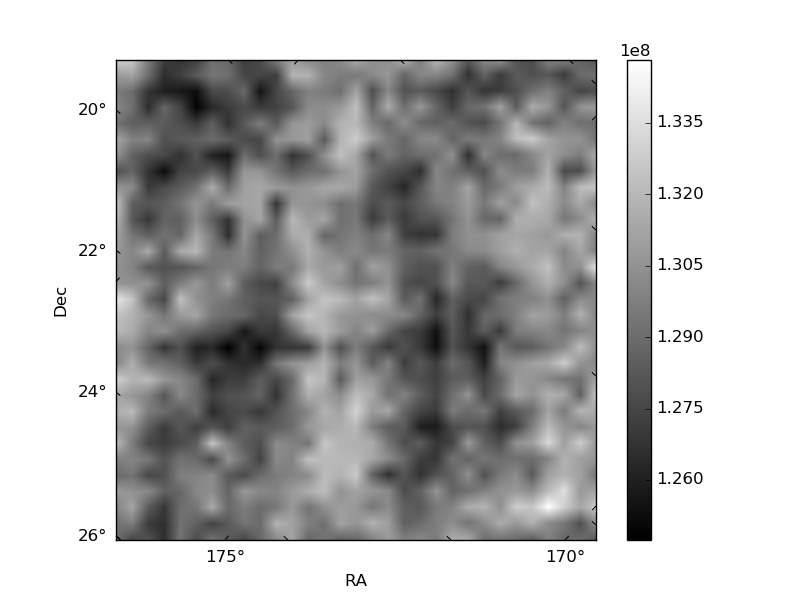
Histogram calculated using DETX and DETY for each event in the final _common_clean file
| Quadrant A |  |
 |
Quadrant B |
|---|---|---|---|
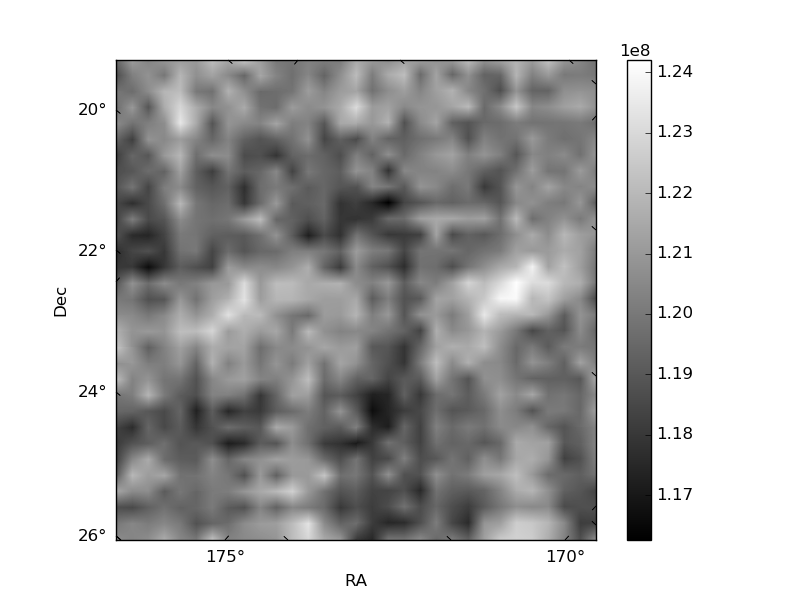
| Quadrant D |  |
 |
Quadrant C |
| Plot type | Count rate plots | Images |
|---|---|---|
| Comparison with Poisson distribution Blue bars denote a histogram of data divided into 1 sec bins. Red curve is a Poisson curve with rate = median count rate of data. |
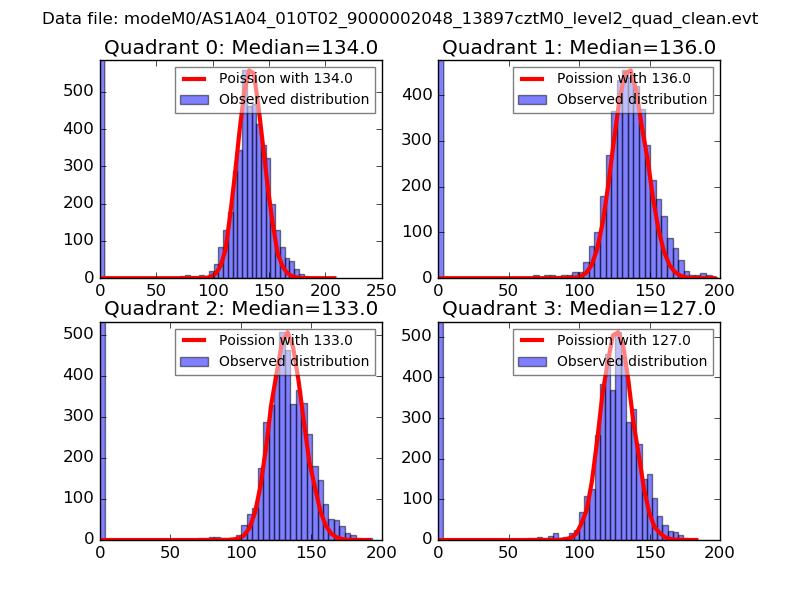 |
 |
| Quadrant-wise count rates Data is divided into 100 sec bins |
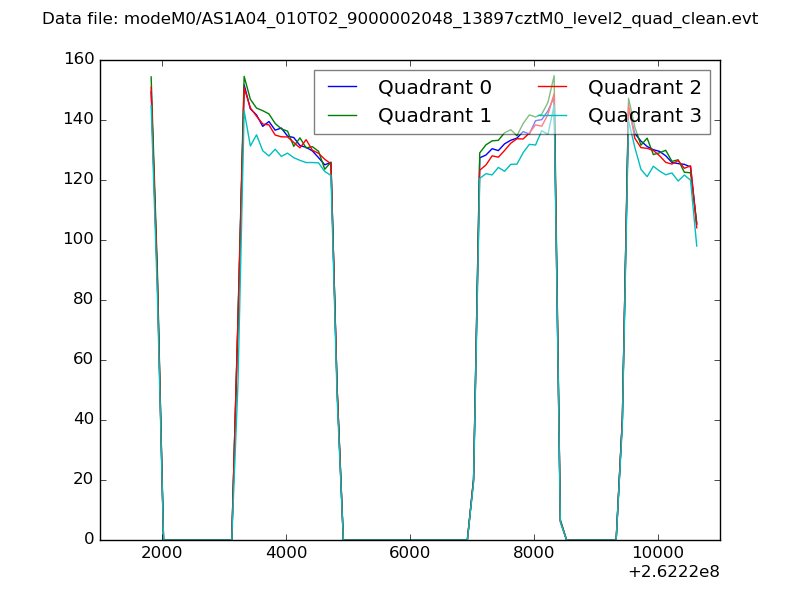 |
|
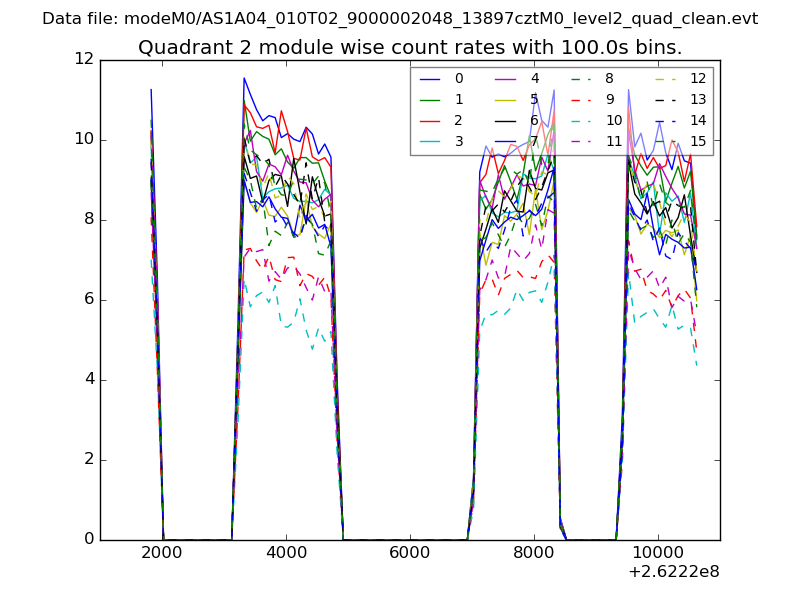
| Module-wise count rates for Quadrant A Data is divided into 100 sec bins |
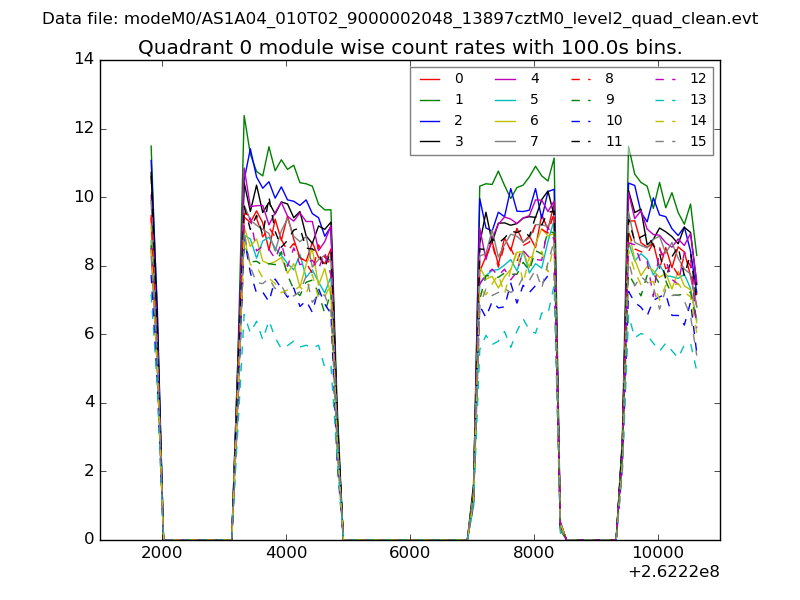 |
 |
| Module-wise count rates for Quadrant B Data is divided into 100 sec bins |
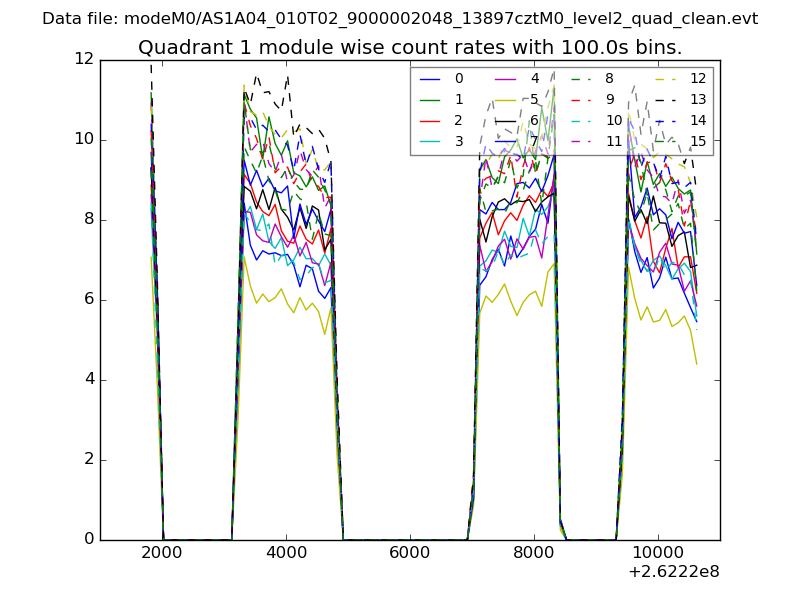 |
 |
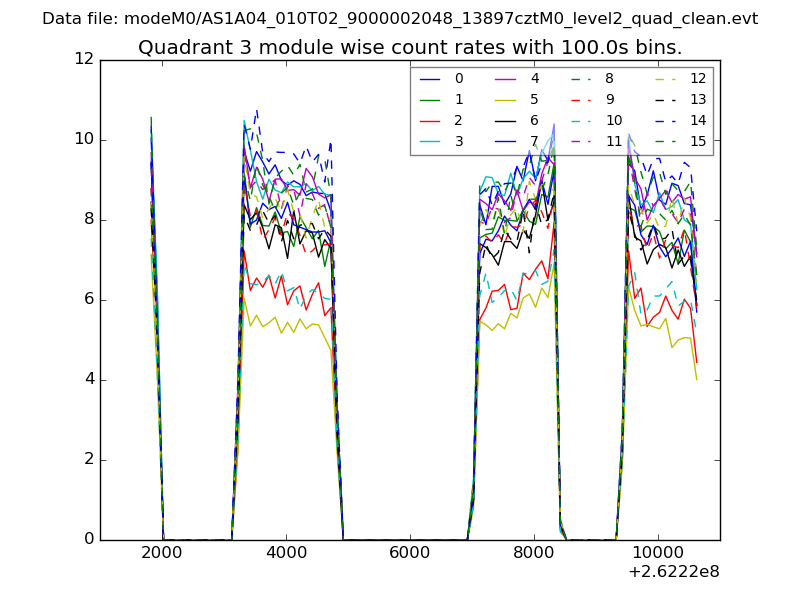
| Module-wise count rates for Quadrant C Data is divided into 100 sec bins |
 |
 |
| Module-wise count rates for Quadrant D Data is divided into 100 sec bins |
 |
 |
| Parameter | Plot |
|---|---|
| CZT HV Monitor | 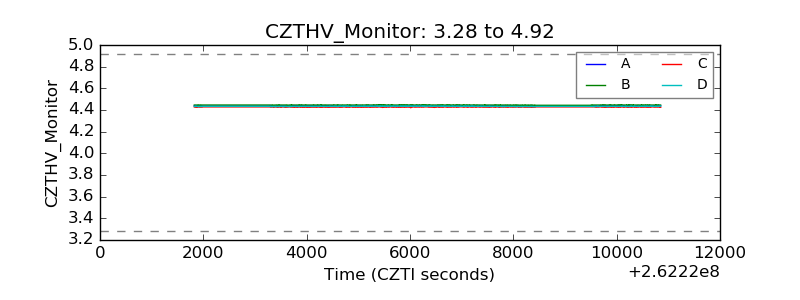 |
| D_VDD | 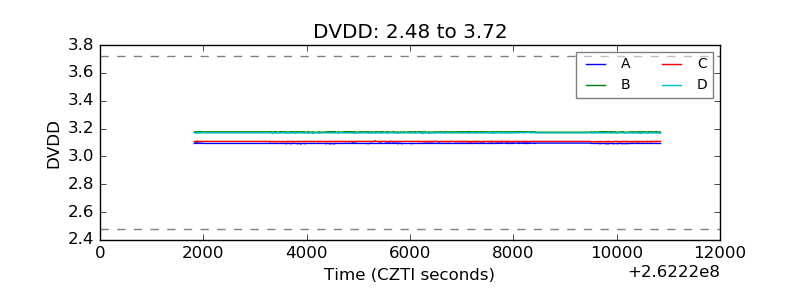 |
| Temperature 1 | 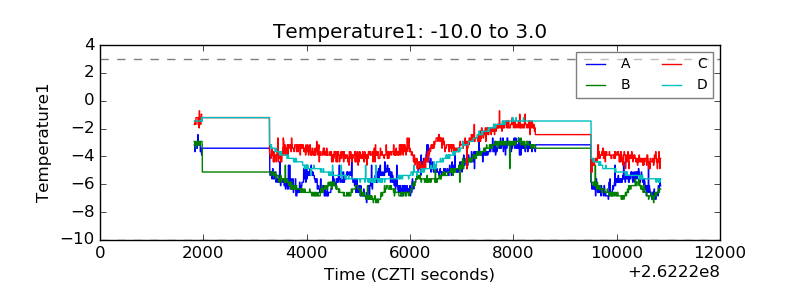 |
| Veto HV Monitor | 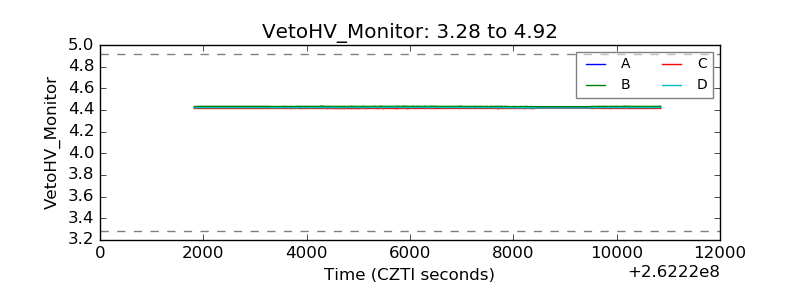 |
| Veto LLD | 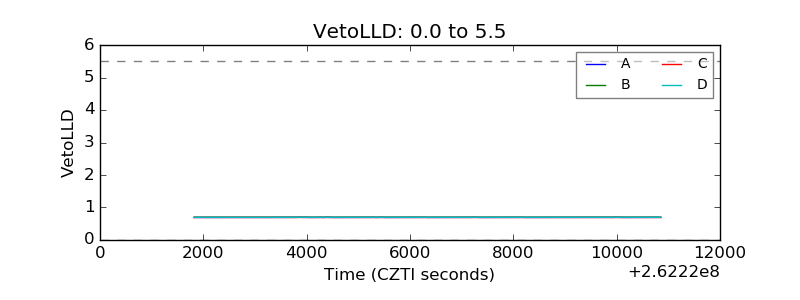 |
| Alpha Counter | 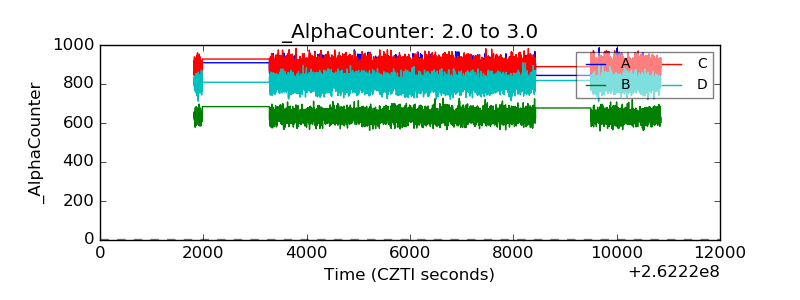 |
| _CPM_Rate | 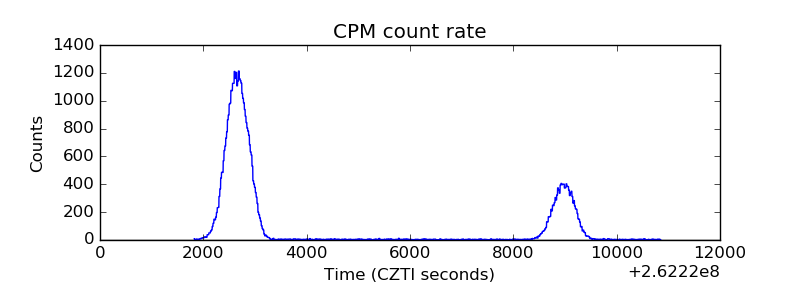 |
| CZT Counter | 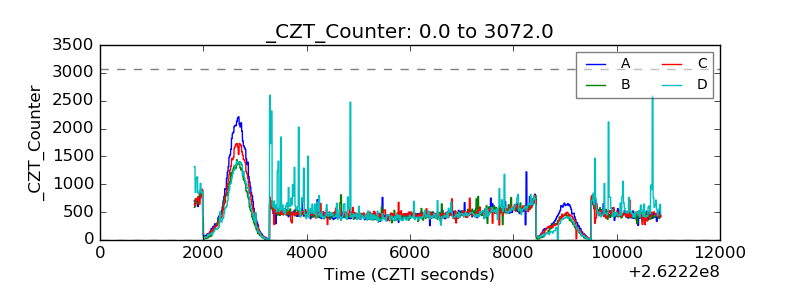 |
| +2.5 Volts monitor |  |
| +5 Volts monitor |  |
| _ROLL_ROT | 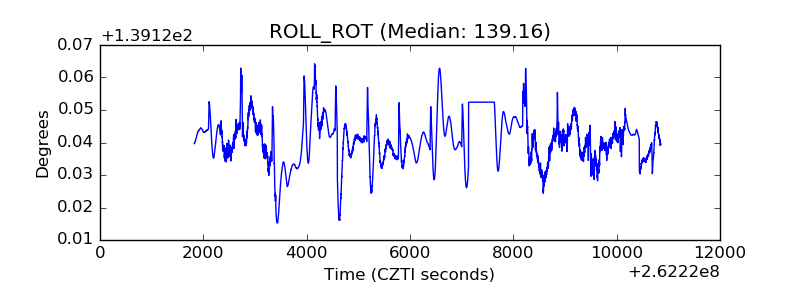 |
| _Roll_DEC | 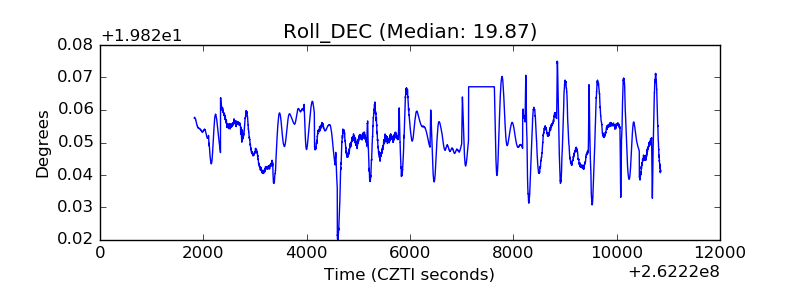 |
| _Roll_RA | 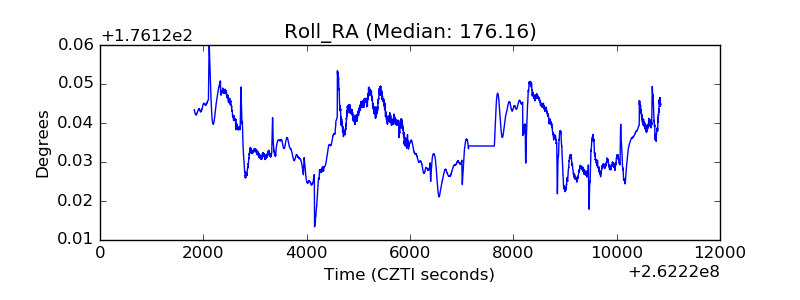 |
| Veto Counter | 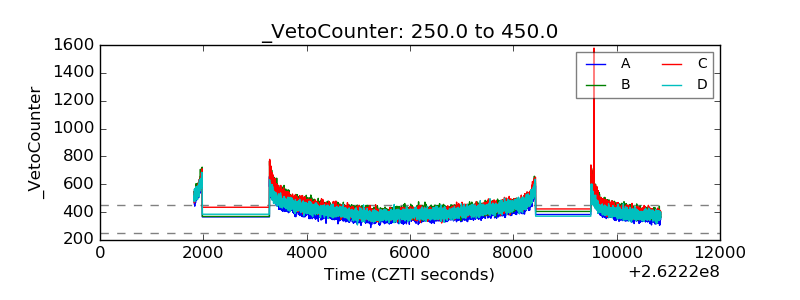 |