| Param | Original file | Final file |
|---|---|---|
| Filename | modeM0/AS1A04_010T02_9000002048_13900cztM0_level2.evt | modeM0/AS1A04_010T02_9000002048_13900cztM0_level2_quad_clean.evt |
| Size (bytes) | 634,343,040 | 96,713,280 |
| Size | 605.0 MB | 92.2 MB |
| Events in quadrant A | 4,621,129 | 588,753 |
| Events in quadrant B | 4,178,465 | 593,627 |
| Events in quadrant C | 4,136,949 | 597,167 |
| Events in quadrant D | 5,699,744 | 560,019 |
| Mode M0 | |||
|---|---|---|---|
| Quadrant | BADHDUFLAG | Total packets | Discarded packets |
| A | 0 | 19348 | 3 |
| B | 0 | 17980 | 2 |
| C | 0 | 17965 | 2 |
| D | 0 | 22778 | 2 |
| Mode SS | |||
|---|---|---|---|
| Quadrant | BADHDUFLAG | Total packets | Discarded packets |
| A | 0 | 174 | 0 |
| B | 0 | 174 | 0 |
| C | 0 | 174 | 0 |
| D | 0 | 174 | 0 |
| Mode M9 | |||
|---|---|---|---|
| Quadrant | BADHDUFLAG | Total packets | Discarded packets |
| A | 0 | 3 | 0 |
| B | 0 | 3 | 0 |
| C | 0 | 3 | 0 |
| D | 0 | 3 | 0 |
| Quadrant | Total seconds | Saturated seconds | Saturation percentage |
|---|---|---|---|
| A | 8473 | 441 | 5.204768% |
| B | 8473 | 387 | 4.567450% |
| C | 8473 | 220 | 2.596483% |
| D | 8473 | 535 | 6.314174% |
Noise dominated data is calculated using 1-second bins in cleaned event files. If a bin has >2000 counts, and if more than 50% of those come from <1% of pixels, then it is considered to be noise-dominated and hence unusable.
| Quadrant | # 1 sec bins | Bins with >0 counts | Bins with >2000 counts | High rate bins dominated by noise | Noise dominated (total time) | Noise dominated (detector-on time) | Marked lightcurve |
|---|---|---|---|---|---|---|---|
| A | 8849 | 8474 | 80 | 80 | 0.90% | 0.94% | 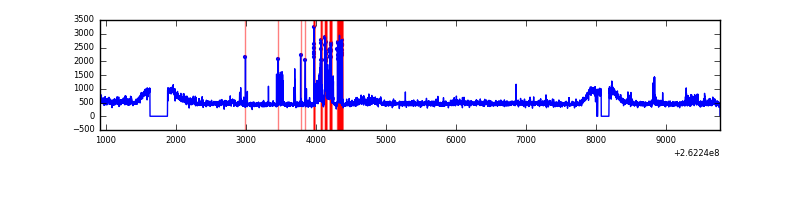 |
| B | 8849 | 8474 | 4 | 4 | 0.05% | 0.05% | 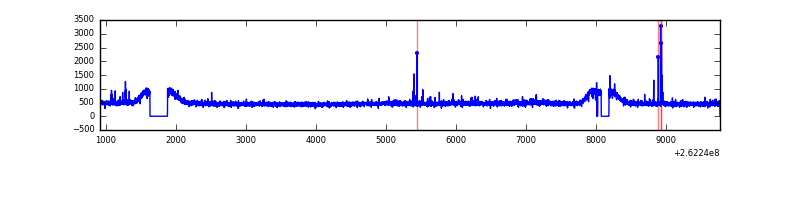 |
| C | 8849 | 8474 | 0 | 0 | 0.00% | 0.00% | 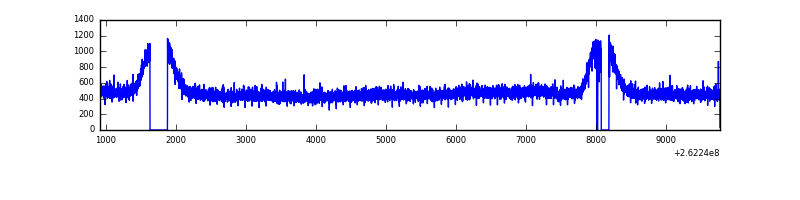 |
| D | 8849 | 8474 | 309 | 309 | 3.49% | 3.65% | 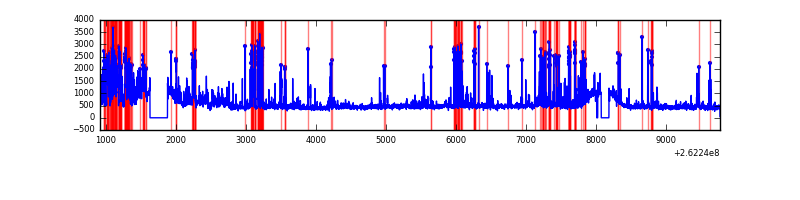 |
Top three noisy pixels from each quadrant. If the there are fewer than three noisy pixels in the level2.evt file, extra rows are filled as -1
| Pixel properties | Quadrant properties | ||||||
|---|---|---|---|---|---|---|---|
| Quadrant | DetID | PixID | Counts | Sigma | Mean | Median | Sigma |
| A | 9 | 143 | 386570 | 1782.75 | 1050 | 1026 | 216.3 |
| A | 8 | 15 | 155222 | 713.0 | 1050 | 1026 | 216.3 |
| A | 1 | 162 | 24675 | 109.35 | 1050 | 1026 | 216.3 |
| B | 12 | 111 | 25736 | 119.52 | 1048 | 1018 | 206.8 |
| B | 4 | 80 | 23090 | 106.72 | 1048 | 1018 | 206.8 |
| B | 11 | 111 | 21711 | 100.06 | 1048 | 1018 | 206.8 |
| C | 3 | 233 | 105784 | 428.05 | 1032 | 1035 | 244.7 |
| C | 13 | 61 | 7156 | 25.01 | 1032 | 1035 | 244.7 |
| C | 8 | 128 | 4668 | 14.85 | 1032 | 1035 | 244.7 |
| D | 1 | 52 | 974300 | 4026.02 | 1006 | 981 | 241.8 |
| D | 13 | 122 | 548165 | 2263.36 | 1006 | 981 | 241.8 |
| D | 5 | 222 | 149196 | 613.07 | 1006 | 981 | 241.8 |
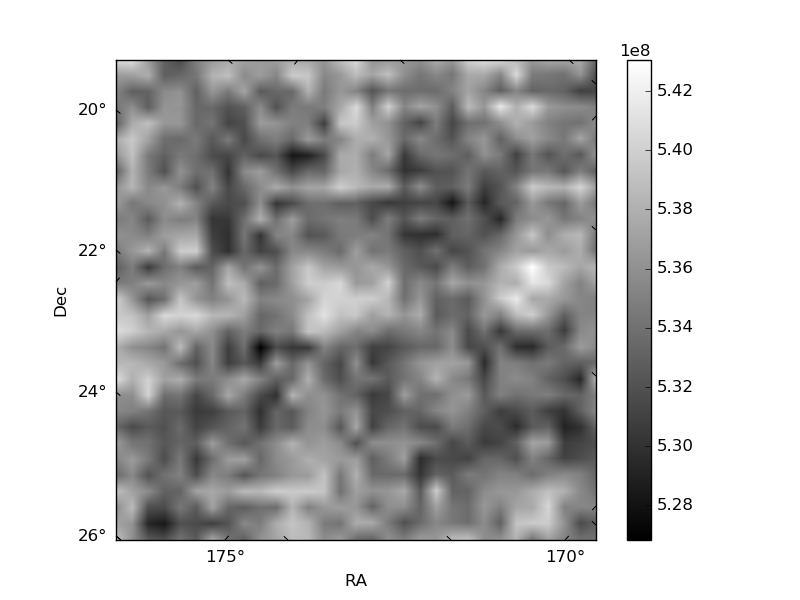
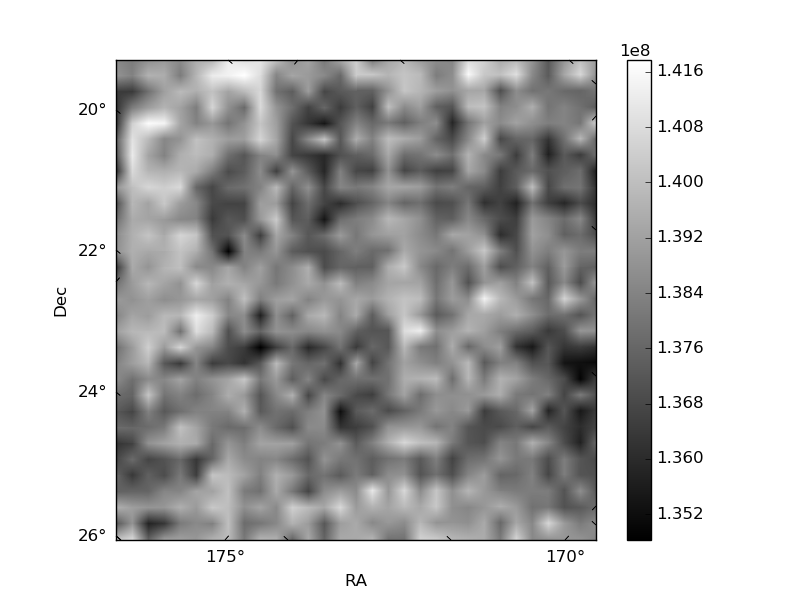
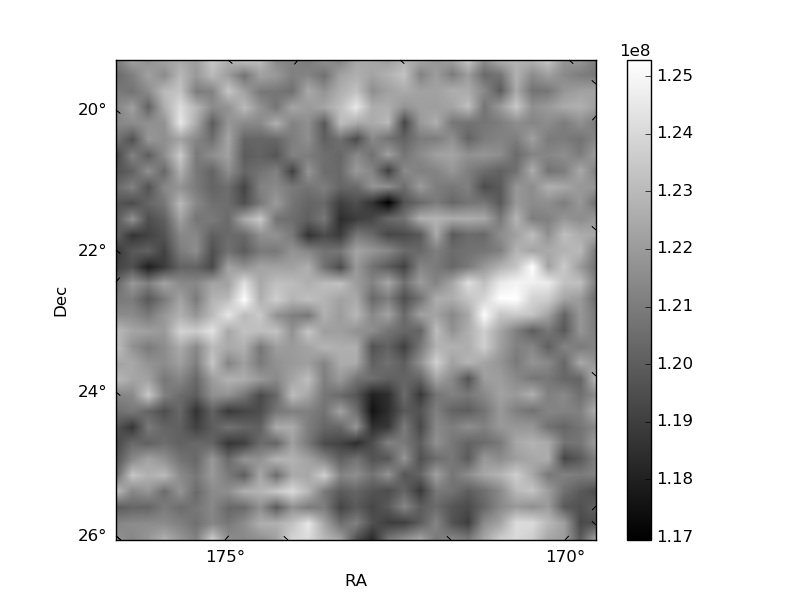
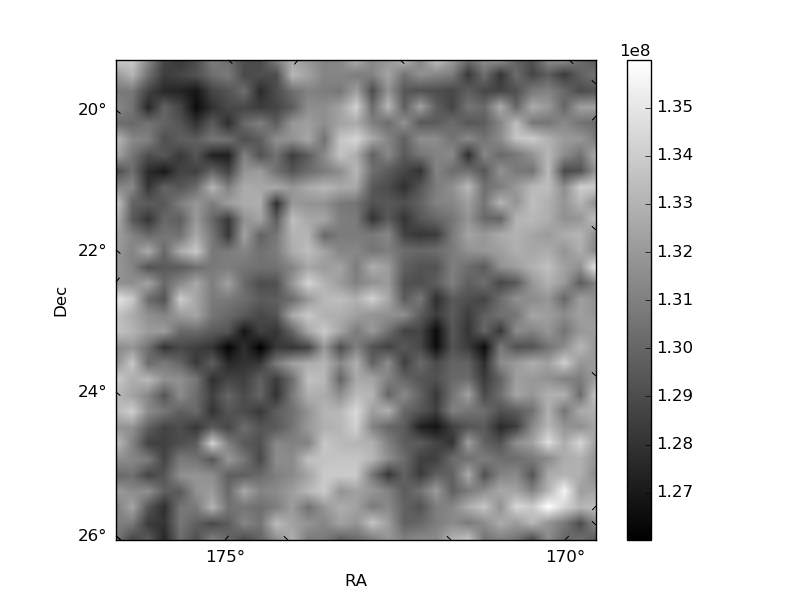
Histogram calculated using DETX and DETY for each event in the final _common_clean file
| Quadrant A | 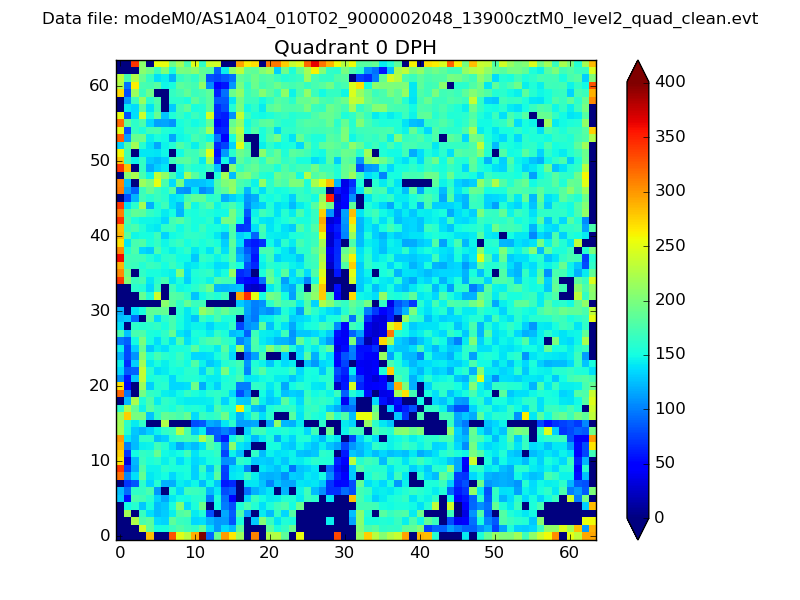 |
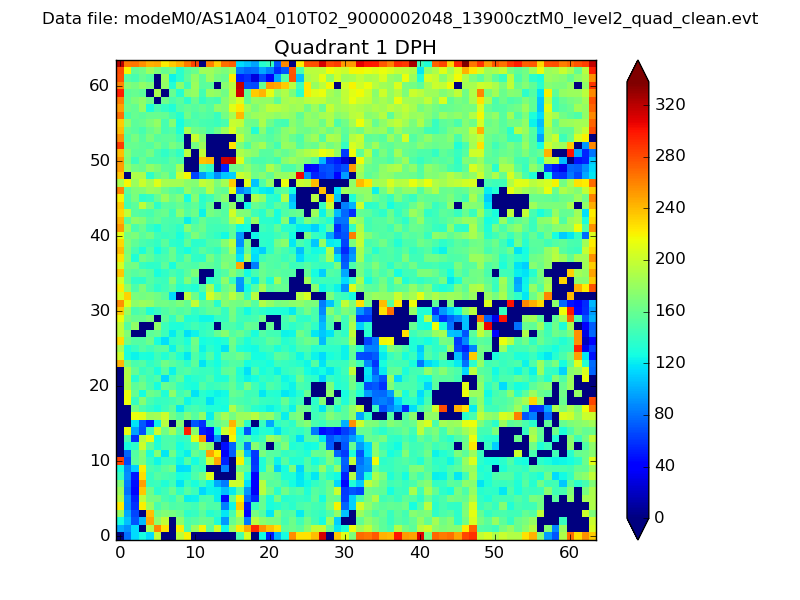 |
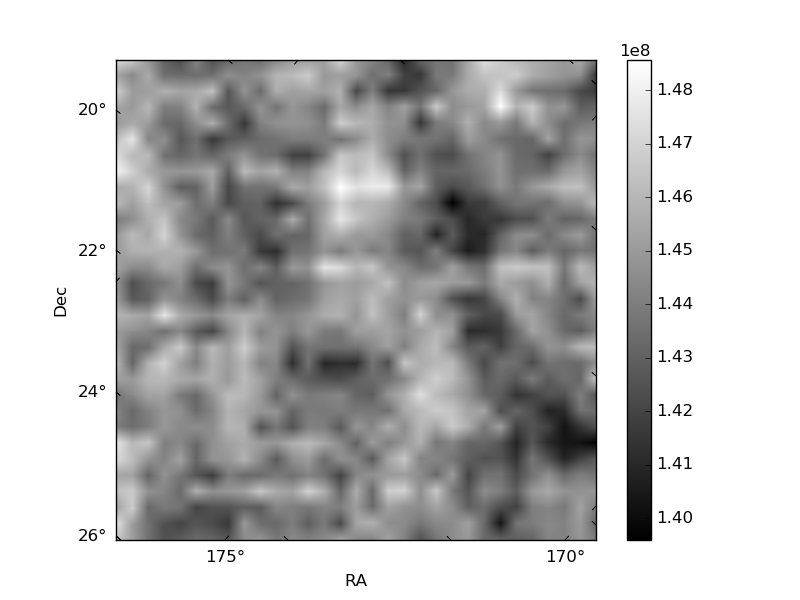
Quadrant B |
|---|---|---|---|
| Quadrant D | 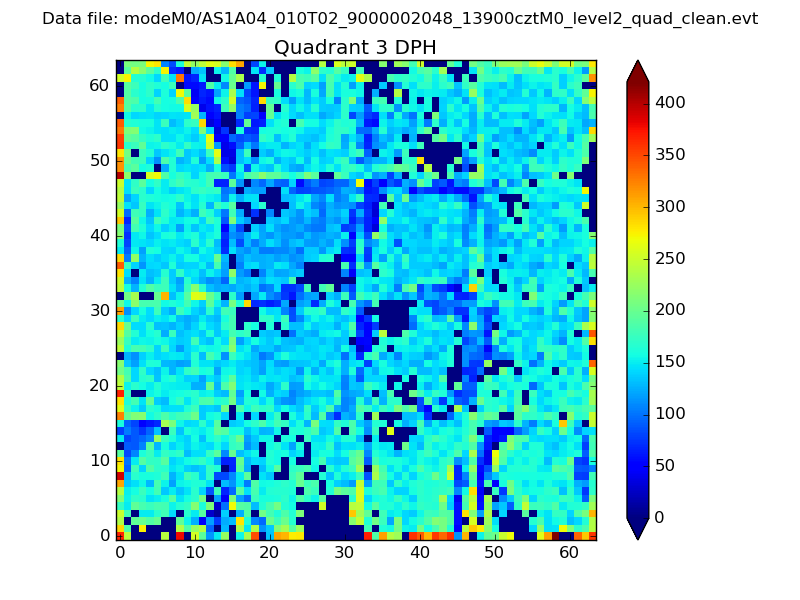 |
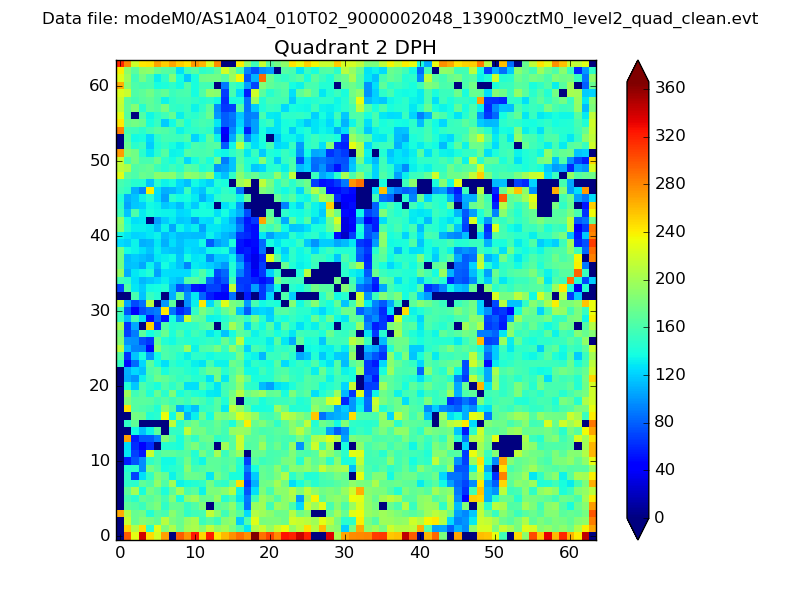 |
Quadrant C |
| Plot type | Count rate plots | Images |
|---|---|---|
| Comparison with Poisson distribution Blue bars denote a histogram of data divided into 1 sec bins. Red curve is a Poisson curve with rate = median count rate of data. |
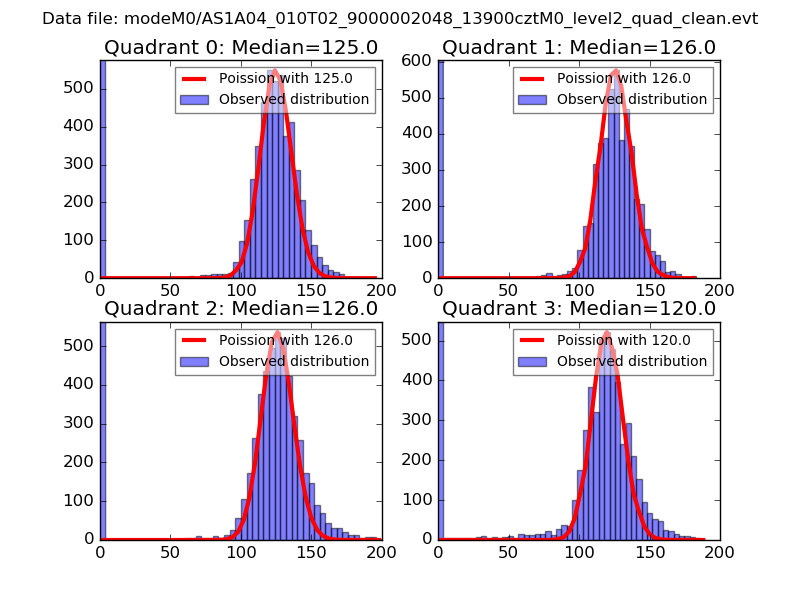 |
 |
| Quadrant-wise count rates Data is divided into 100 sec bins |
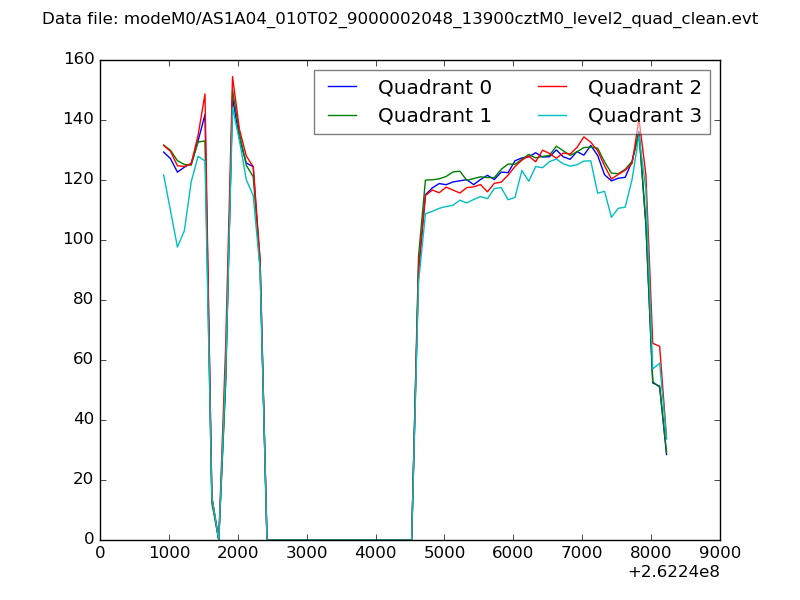 |
|
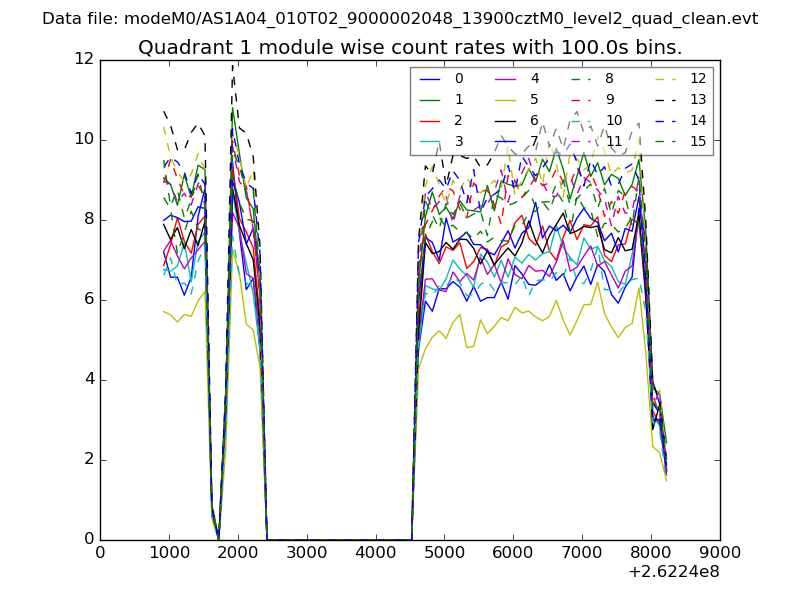
| Module-wise count rates for Quadrant A Data is divided into 100 sec bins |
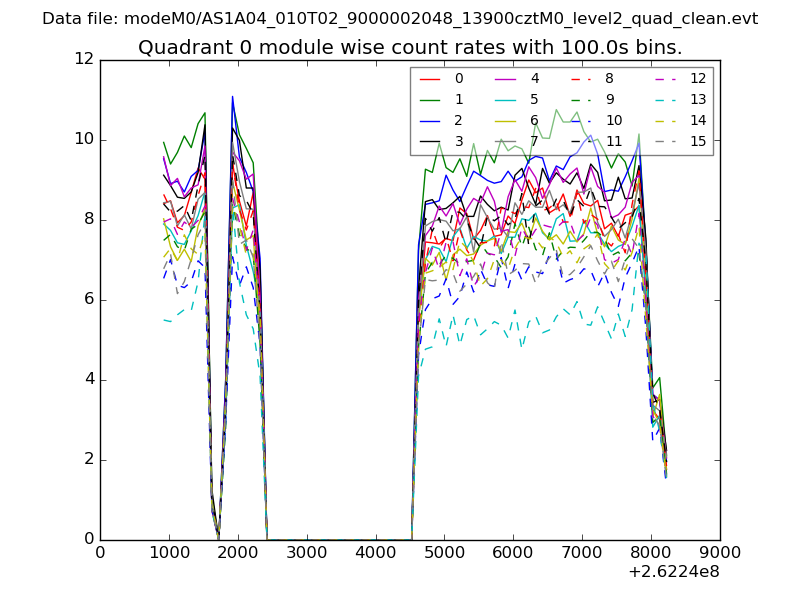 |
 |
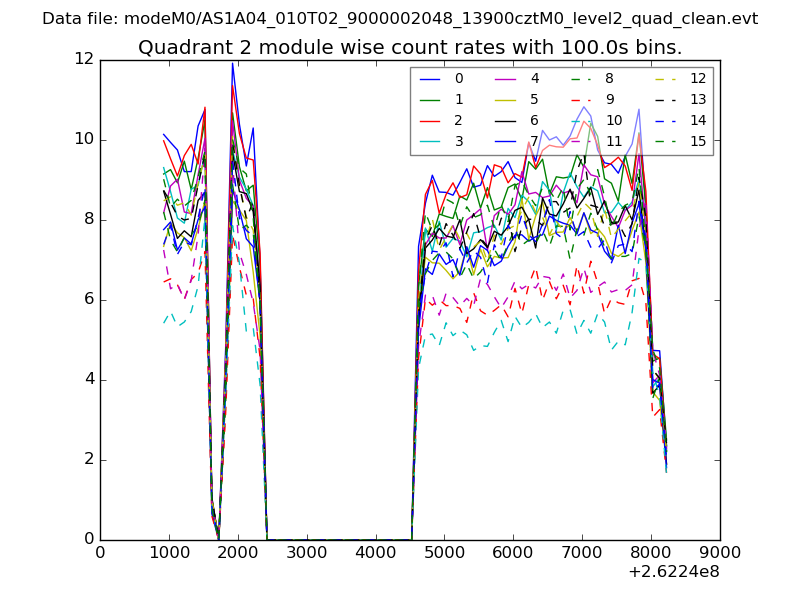
| Module-wise count rates for Quadrant B Data is divided into 100 sec bins |
 |
 |
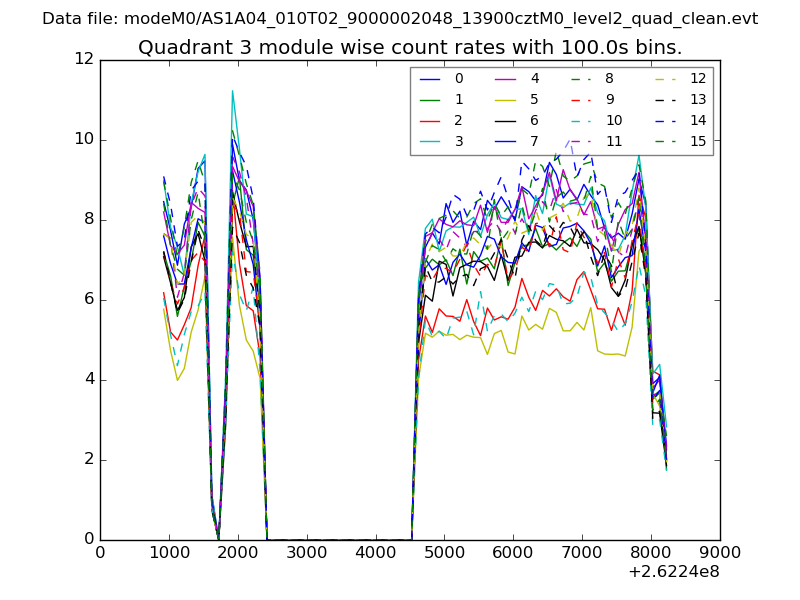
| Module-wise count rates for Quadrant C Data is divided into 100 sec bins |
 |
 |
| Module-wise count rates for Quadrant D Data is divided into 100 sec bins |
 |
 |
| Parameter | Plot |
|---|---|
| CZT HV Monitor | 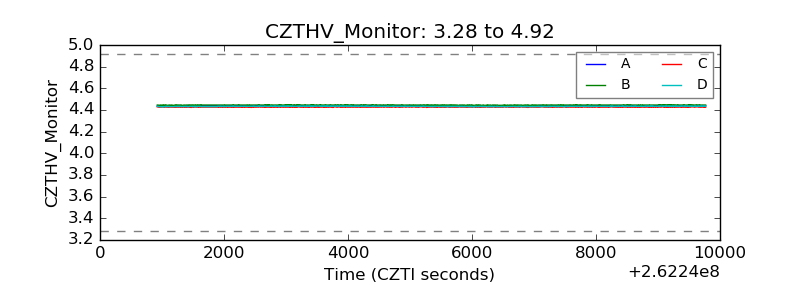 |
| D_VDD | 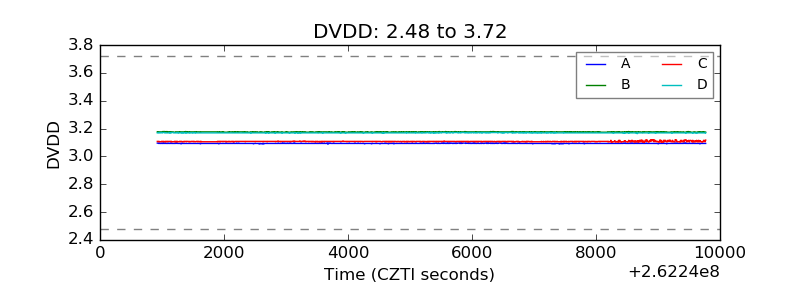 |
| Temperature 1 | 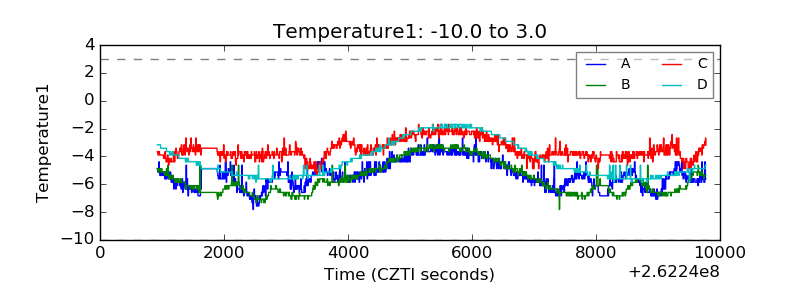 |
| Veto HV Monitor | 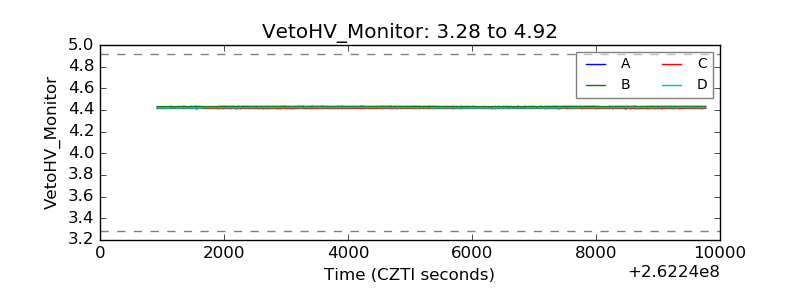 |
| Veto LLD | 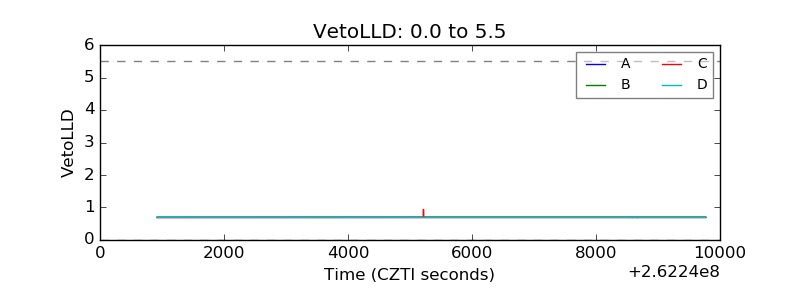 |
| Alpha Counter | 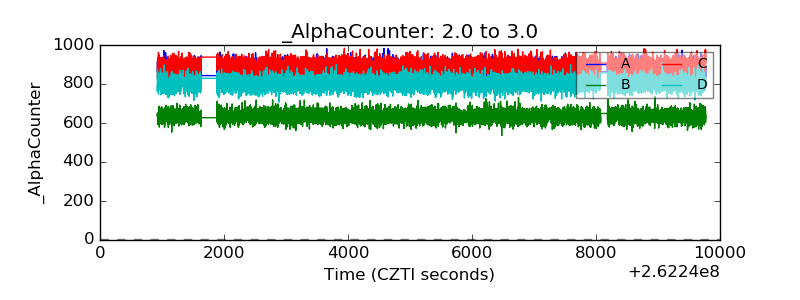 |
| _CPM_Rate | 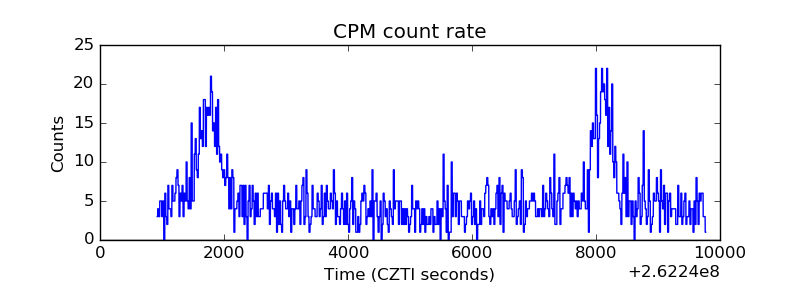 |
| CZT Counter | 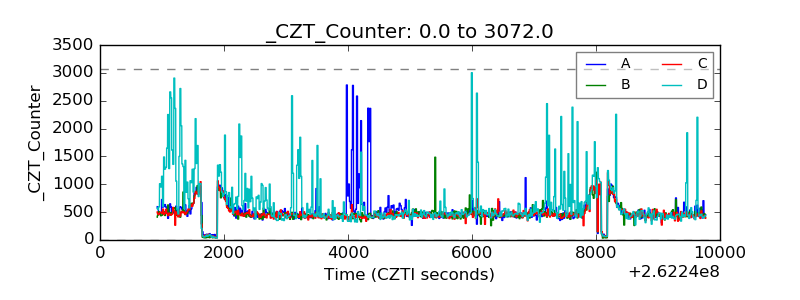 |
| +2.5 Volts monitor |  |
| +5 Volts monitor |  |
| _ROLL_ROT | 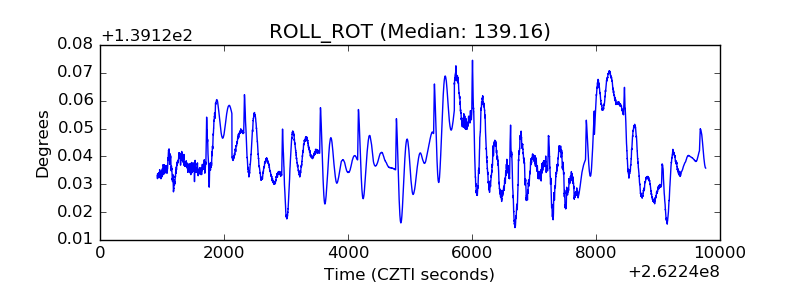 |
| _Roll_DEC | 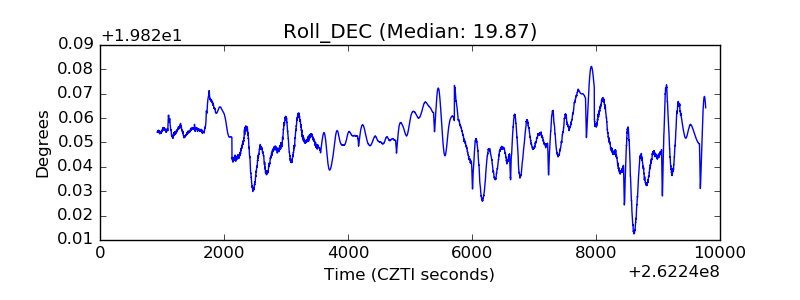 |
| _Roll_RA | 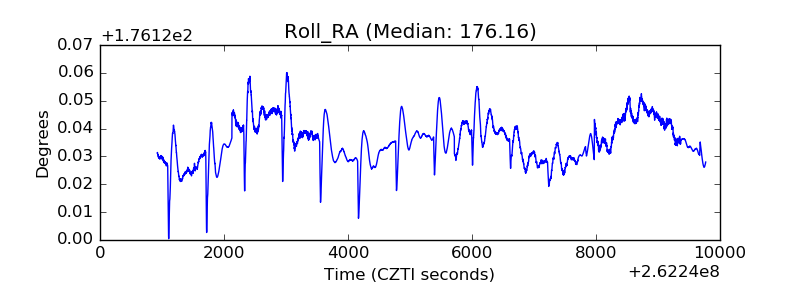 |
| Veto Counter | 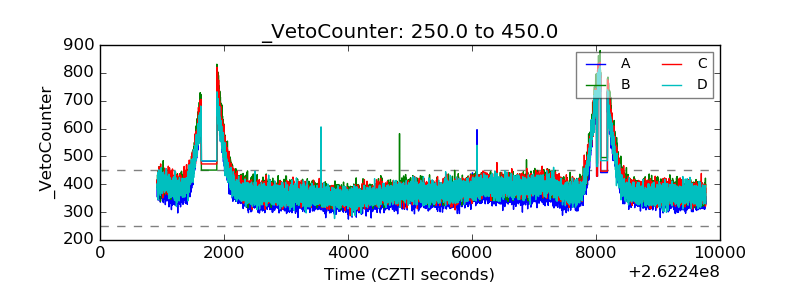 |