| Param | Original file | Final file |
|---|---|---|
| Filename | modeM0/AS1A04_010T02_9000002048_13901cztM0_level2.evt | modeM0/AS1A04_010T02_9000002048_13901cztM0_level2_quad_clean.evt |
| Size (bytes) | 544,947,840 | 74,520,000 |
| Size | 519.7 MB | 71.1 MB |
| Events in quadrant A | 4,119,758 | 438,231 |
| Events in quadrant B | 3,658,679 | 442,634 |
| Events in quadrant C | 3,546,480 | 436,794 |
| Events in quadrant D | 4,666,684 | 413,906 |
| Mode M0 | |||
|---|---|---|---|
| Quadrant | BADHDUFLAG | Total packets | Discarded packets |
| A | 0 | 17270 | 2 |
| B | 0 | 15809 | 1 |
| C | 0 | 15494 | 1 |
| D | 0 | 18910 | 1 |
| Mode SS | |||
|---|---|---|---|
| Quadrant | BADHDUFLAG | Total packets | Discarded packets |
| A | 0 | 154 | 0 |
| B | 0 | 154 | 0 |
| C | 0 | 154 | 0 |
| D | 0 | 154 | 0 |
| Mode M9 | |||
|---|---|---|---|
| Quadrant | BADHDUFLAG | Total packets | Discarded packets |
| A | 0 | 3 | 0 |
| B | 0 | 3 | 0 |
| C | 0 | 3 | 0 |
| D | 0 | 3 | 0 |
| Quadrant | Total seconds | Saturated seconds | Saturation percentage |
|---|---|---|---|
| A | 7538 | 360 | 4.775803% |
| B | 7538 | 176 | 2.334837% |
| C | 7538 | 113 | 1.499071% |
| D | 7538 | 308 | 4.085964% |
Noise dominated data is calculated using 1-second bins in cleaned event files. If a bin has >2000 counts, and if more than 50% of those come from <1% of pixels, then it is considered to be noise-dominated and hence unusable.
| Quadrant | # 1 sec bins | Bins with >0 counts | Bins with >2000 counts | High rate bins dominated by noise | Noise dominated (total time) | Noise dominated (detector-on time) | Marked lightcurve |
|---|---|---|---|---|---|---|---|
| A | 7889 | 7539 | 198 | 198 | 2.51% | 2.63% | 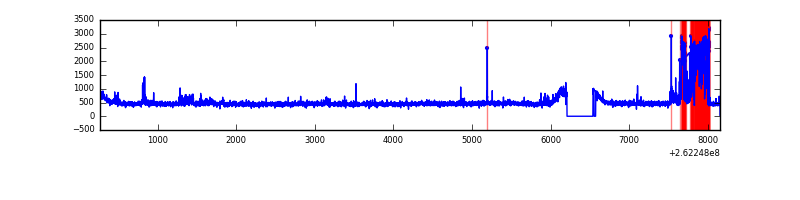 |
| B | 7889 | 7539 | 15 | 15 | 0.19% | 0.20% | 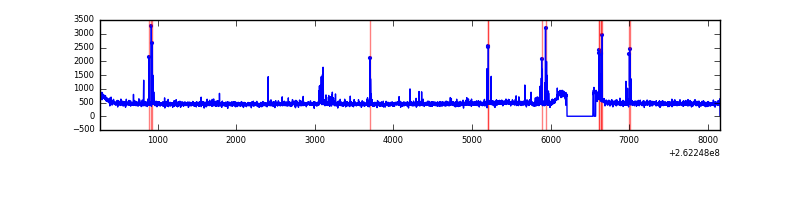 |
| C | 7889 | 7540 | 0 | 0 | 0.00% | 0.00% | 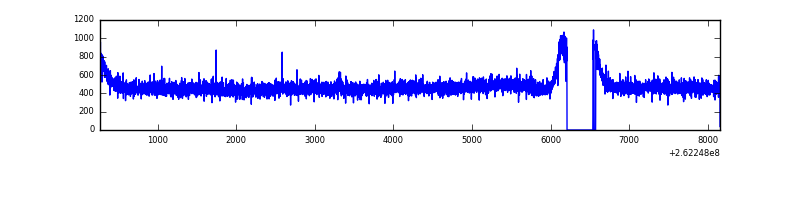 |
| D | 7889 | 7539 | 195 | 195 | 2.47% | 2.59% | 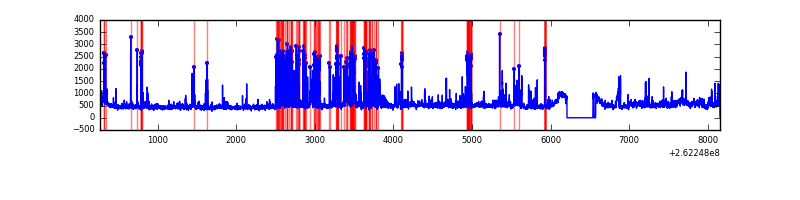 |
Top three noisy pixels from each quadrant. If the there are fewer than three noisy pixels in the level2.evt file, extra rows are filled as -1
| Pixel properties | Quadrant properties | ||||||
|---|---|---|---|---|---|---|---|
| Quadrant | DetID | PixID | Counts | Sigma | Mean | Median | Sigma |
| A | 9 | 143 | 626529 | 3441.09 | 888 | 868 | 181.8 |
| A | 8 | 15 | 42124 | 226.9 | 888 | 868 | 181.8 |
| A | 1 | 162 | 20480 | 107.86 | 888 | 868 | 181.8 |
| B | 4 | 80 | 78215 | 445.64 | 898 | 875 | 173.5 |
| B | 4 | 173 | 53521 | 303.35 | 898 | 875 | 173.5 |
| B | 12 | 111 | 21748 | 120.27 | 898 | 875 | 173.5 |
| C | 3 | 233 | 107230 | 518.43 | 875 | 879 | 205.1 |
| C | 8 | 128 | 12987 | 59.02 | 875 | 879 | 205.1 |
| C | 8 | 112 | 8453 | 36.92 | 875 | 879 | 205.1 |
| D | 1 | 52 | 742317 | 3594.6 | 860 | 840 | 206.3 |
| D | 5 | 222 | 327656 | 1584.37 | 860 | 840 | 206.3 |
| D | 12 | 110 | 86166 | 413.65 | 860 | 840 | 206.3 |
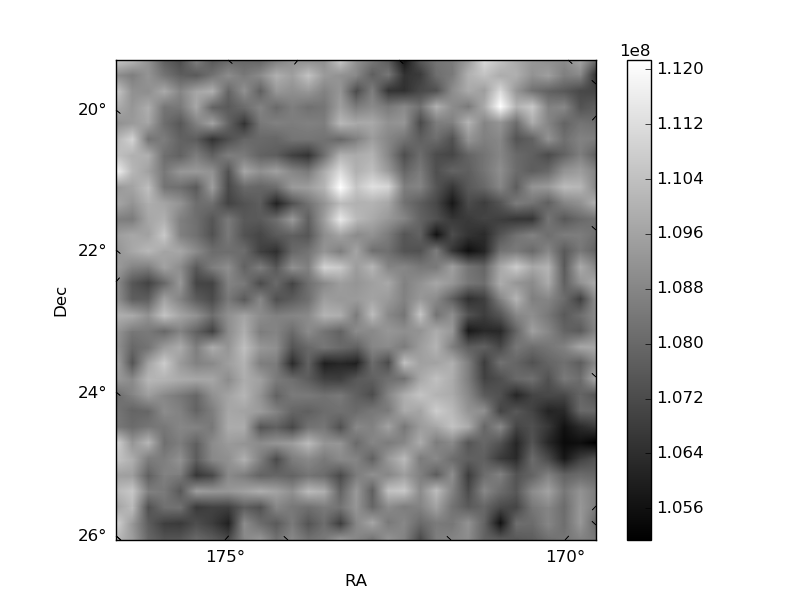
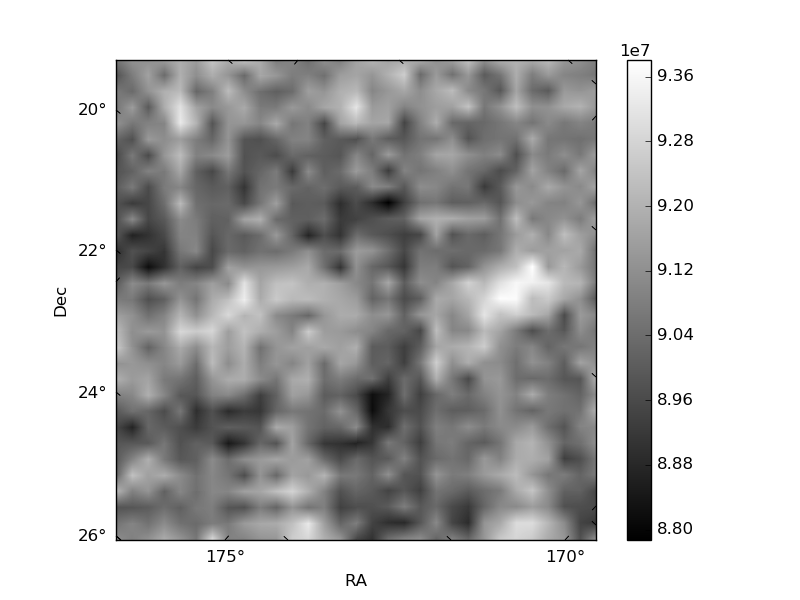
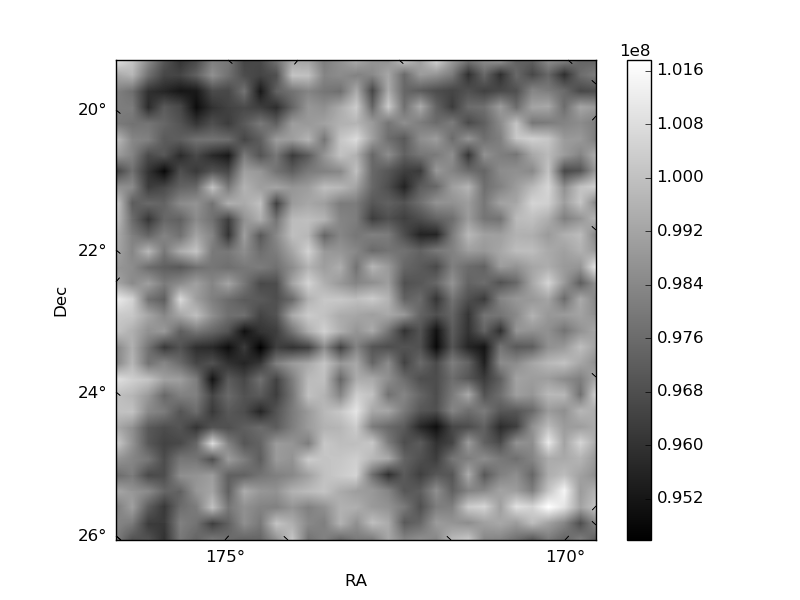
Histogram calculated using DETX and DETY for each event in the final _common_clean file
| Quadrant A | 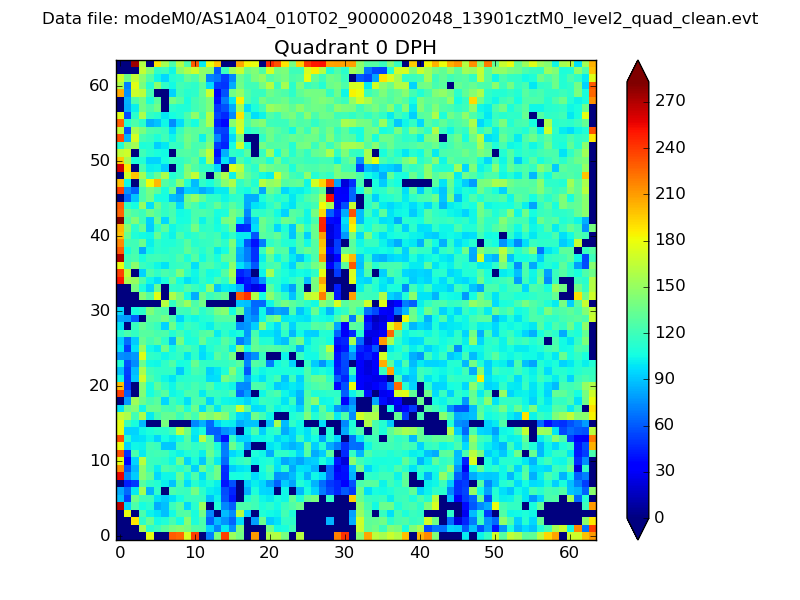 |
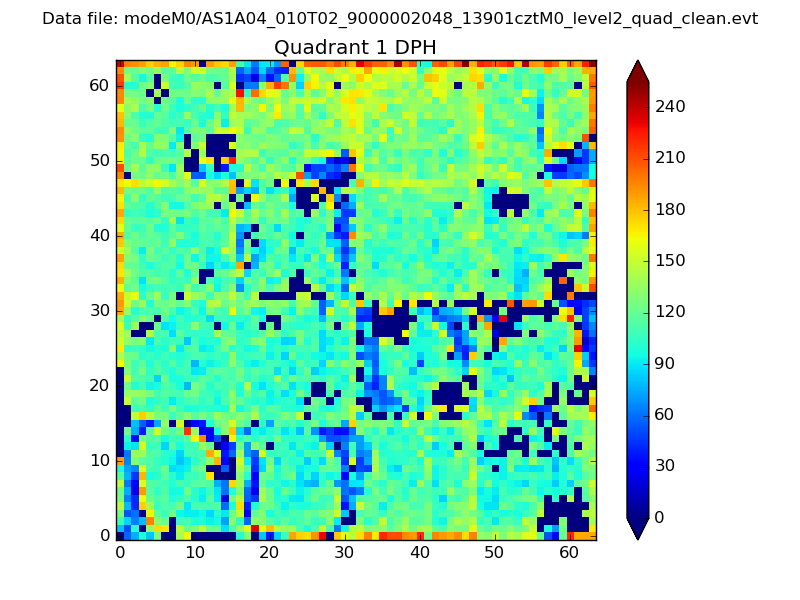 |
Quadrant B |
|---|---|---|---|
| Quadrant D | 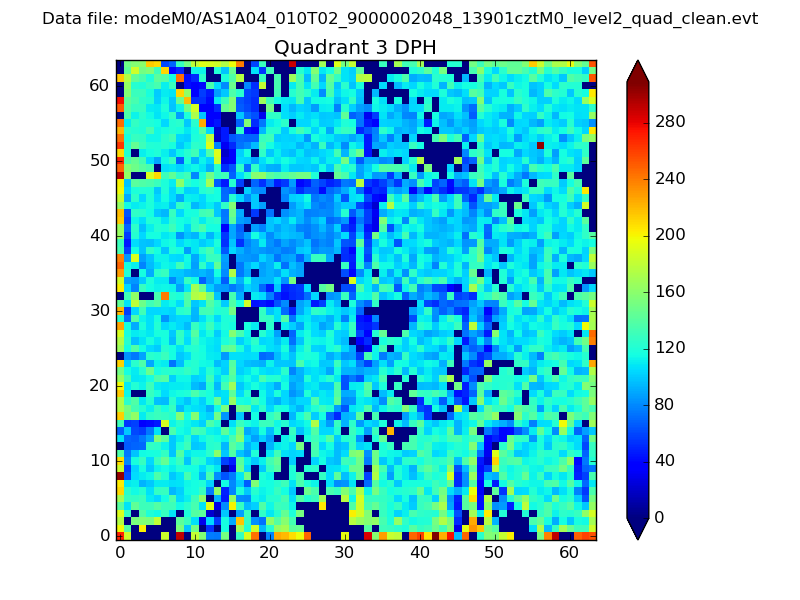 |
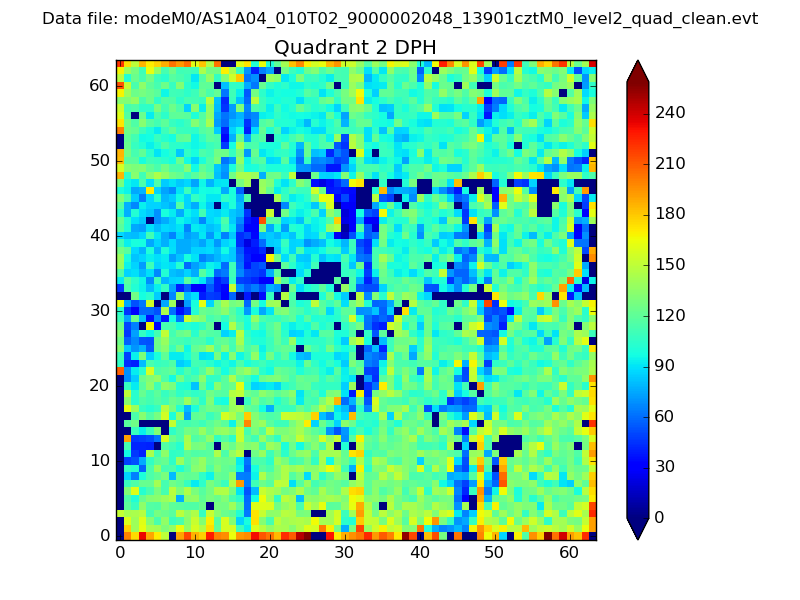 |
Quadrant C |
| Plot type | Count rate plots | Images |
|---|---|---|
| Comparison with Poisson distribution Blue bars denote a histogram of data divided into 1 sec bins. Red curve is a Poisson curve with rate = median count rate of data. |
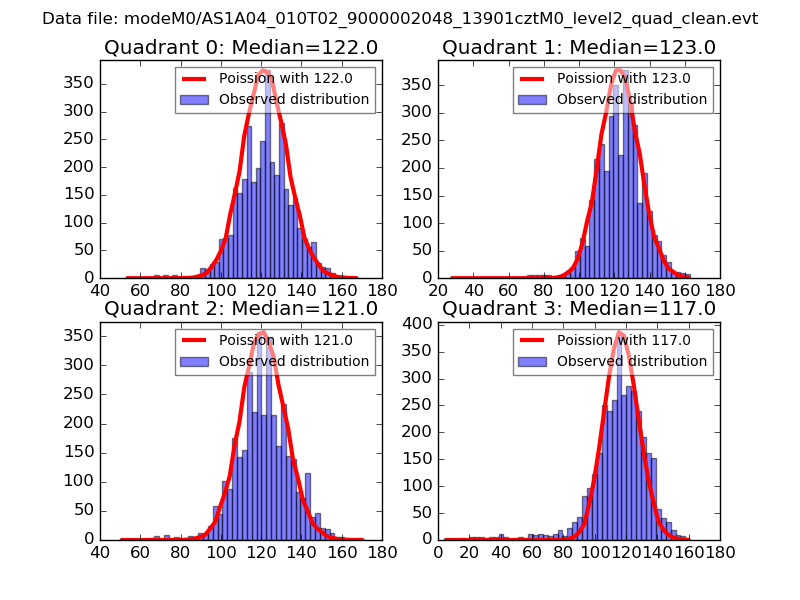 |
 |
| Quadrant-wise count rates Data is divided into 100 sec bins |
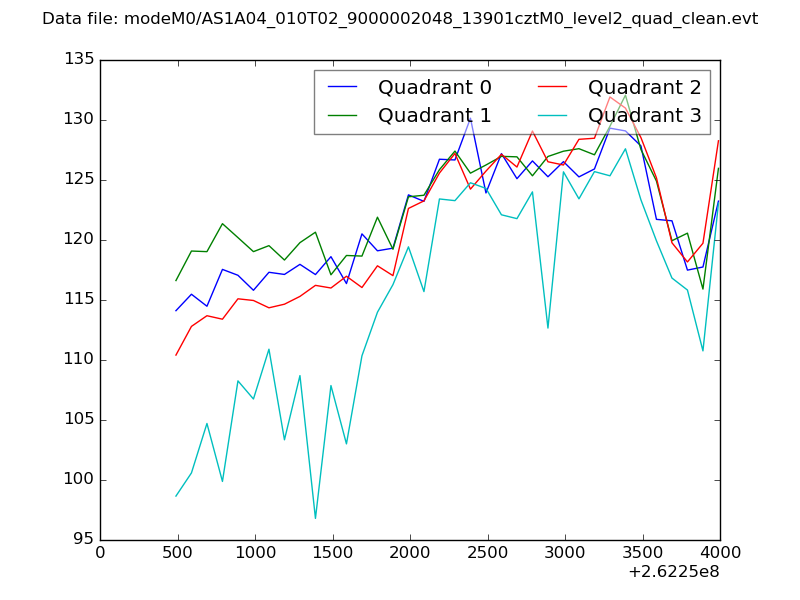 |
|
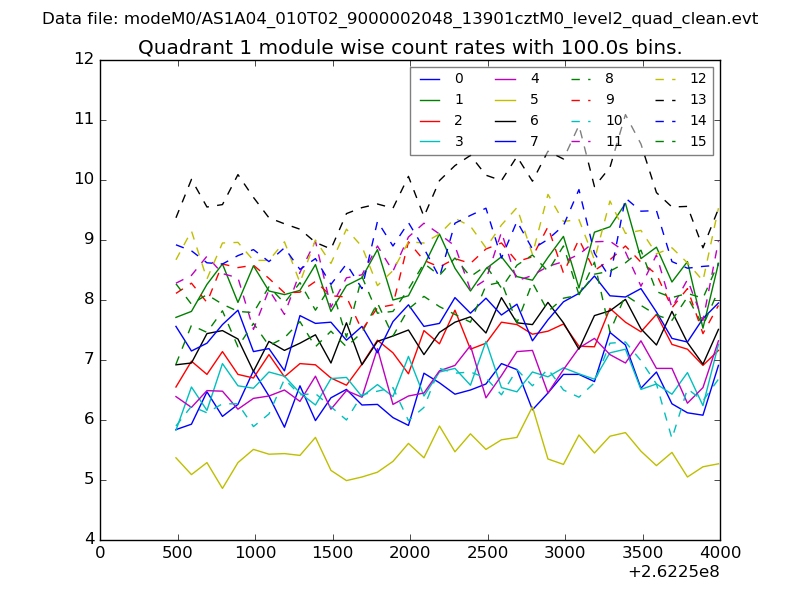
| Module-wise count rates for Quadrant A Data is divided into 100 sec bins |
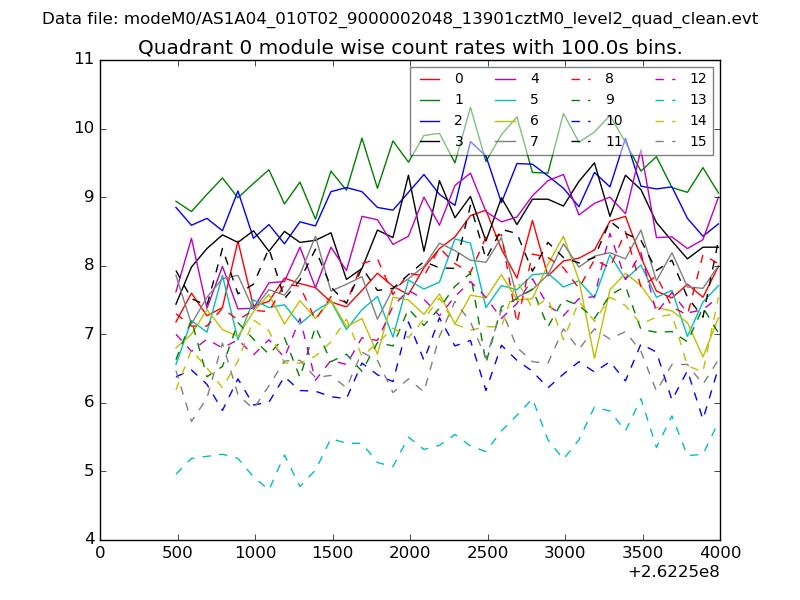 |
 |
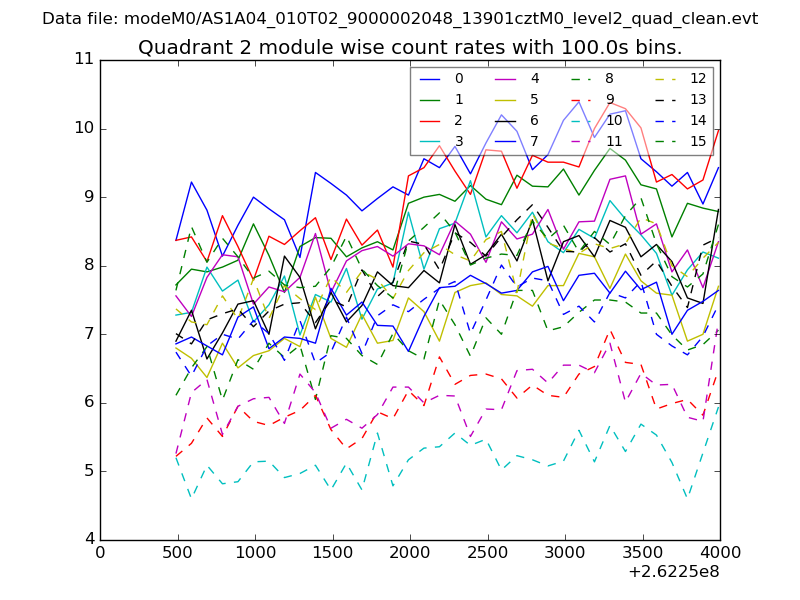
| Module-wise count rates for Quadrant B Data is divided into 100 sec bins |
 |
 |
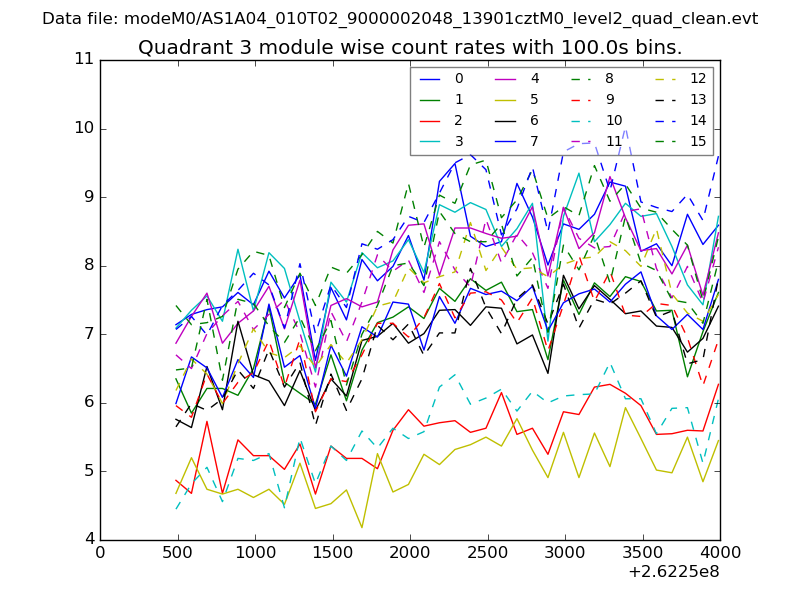
| Module-wise count rates for Quadrant C Data is divided into 100 sec bins |
 |
 |
| Module-wise count rates for Quadrant D Data is divided into 100 sec bins |
 |
 |
| Parameter | Plot |
|---|---|
| CZT HV Monitor | 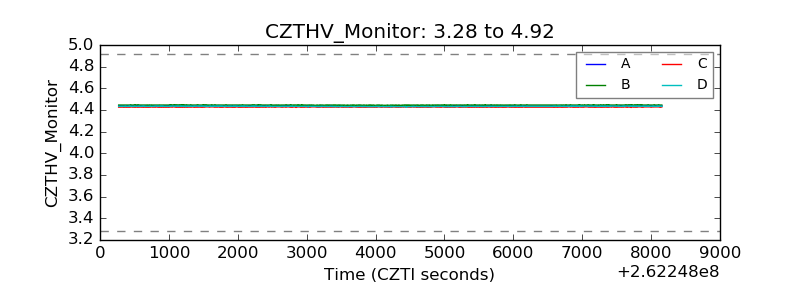 |
| D_VDD |  |
| Temperature 1 | 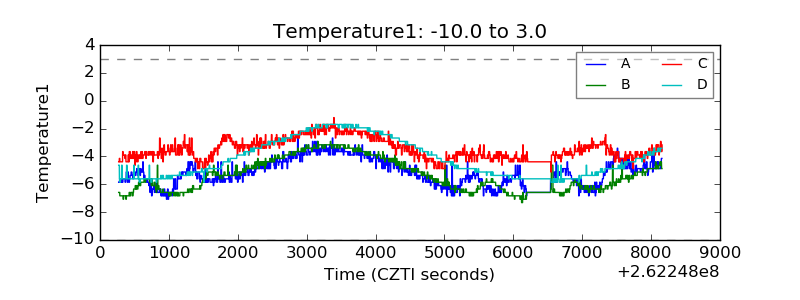 |
| Veto HV Monitor | 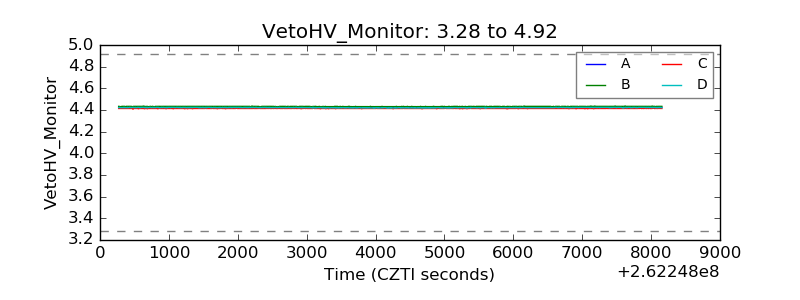 |
| Veto LLD | 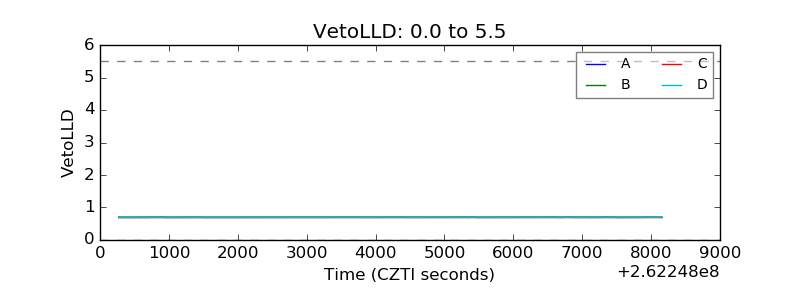 |
| Alpha Counter | 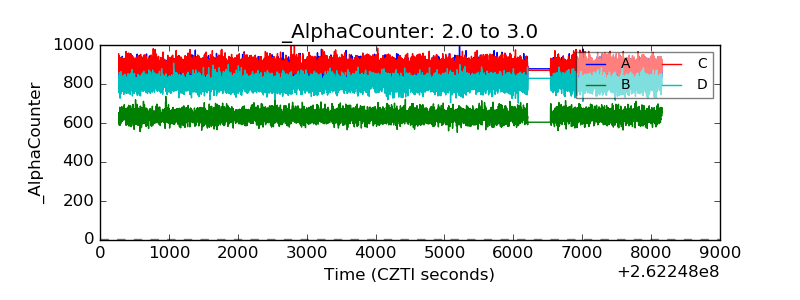 |
| _CPM_Rate | 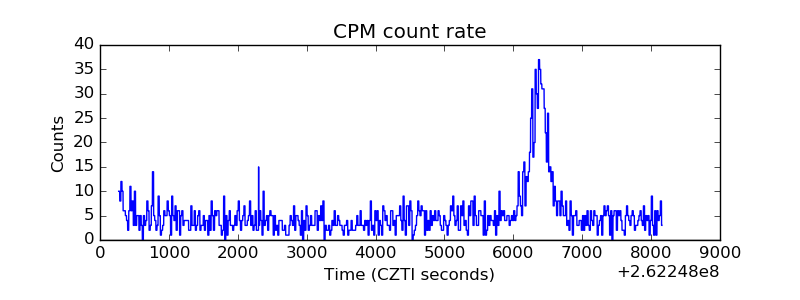 |
| CZT Counter | 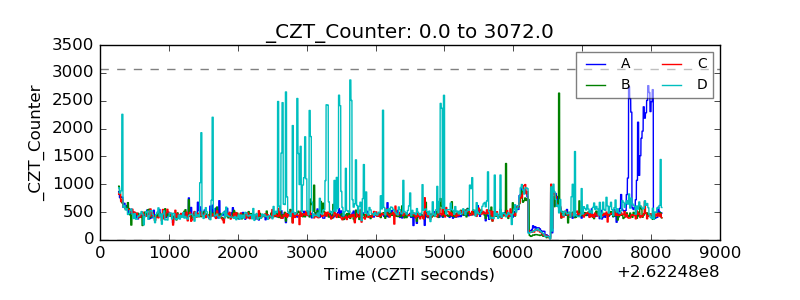 |
| +2.5 Volts monitor |  |
| +5 Volts monitor |  |
| _ROLL_ROT | 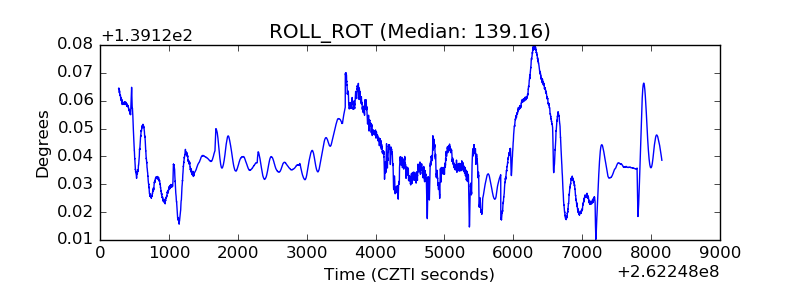 |
| _Roll_DEC | 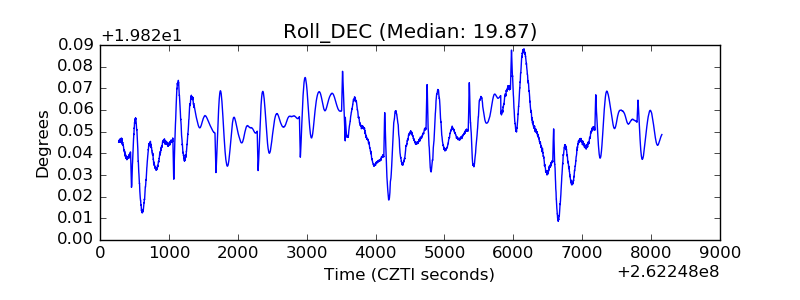 |
| _Roll_RA |  |
| Veto Counter | 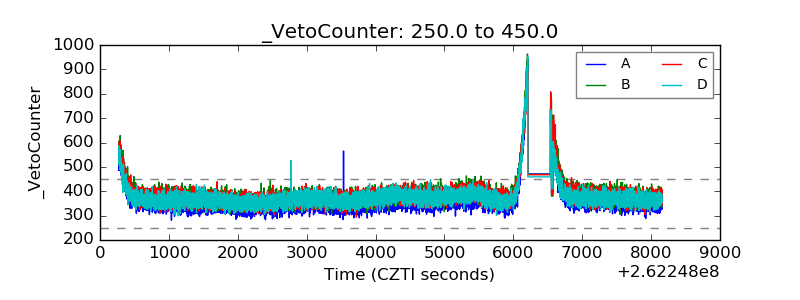 |