| Param | Original file | Final file |
|---|---|---|
| Filename | modeM0/AS1A04_010T02_9000002048_13904cztM0_level2.evt | modeM0/AS1A04_010T02_9000002048_13904cztM0_level2_quad_clean.evt |
| Size (bytes) | 647,159,040 | 84,098,880 |
| Size | 617.2 MB | 80.2 MB |
| Events in quadrant A | 3,190,859 | 559,515 |
| Events in quadrant B | 3,282,436 | 560,757 |
| Events in quadrant C | 3,201,339 | 553,133 |
| Events in quadrant D | 9,473,309 | 408,684 |
| Mode M0 | |||
|---|---|---|---|
| Quadrant | BADHDUFLAG | Total packets | Discarded packets |
| A | 0 | 13833 | 2 |
| B | 0 | 13988 | 1 |
| C | 0 | 13668 | 1 |
| D | 0 | 32731 | 1 |
| Mode SS | |||
|---|---|---|---|
| Quadrant | BADHDUFLAG | Total packets | Discarded packets |
| A | 0 | 136 | 0 |
| B | 0 | 136 | 0 |
| C | 0 | 136 | 0 |
| D | 0 | 136 | 0 |
| Mode M9 | |||
|---|---|---|---|
| Quadrant | BADHDUFLAG | Total packets | Discarded packets |
| A | 0 | 8 | 0 |
| B | 0 | 8 | 0 |
| C | 0 | 8 | 0 |
| D | 0 | 8 | 0 |
| Quadrant | Total seconds | Saturated seconds | Saturation percentage |
|---|---|---|---|
| A | 6645 | 65 | 0.978179% |
| B | 6645 | 95 | 1.429646% |
| C | 6645 | 54 | 0.812641% |
| D | 6645 | 3153 | 47.449210% |
Noise dominated data is calculated using 1-second bins in cleaned event files. If a bin has >2000 counts, and if more than 50% of those come from <1% of pixels, then it is considered to be noise-dominated and hence unusable.
| Quadrant | # 1 sec bins | Bins with >0 counts | Bins with >2000 counts | High rate bins dominated by noise | Noise dominated (total time) | Noise dominated (detector-on time) | Marked lightcurve |
|---|---|---|---|---|---|---|---|
| A | 7526 | 6646 | 4 | 4 | 0.05% | 0.06% | 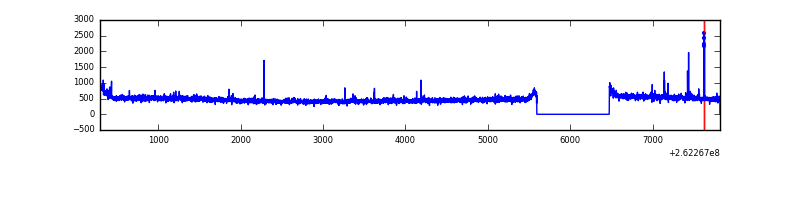 |
| B | 7526 | 6646 | 12 | 12 | 0.16% | 0.18% | 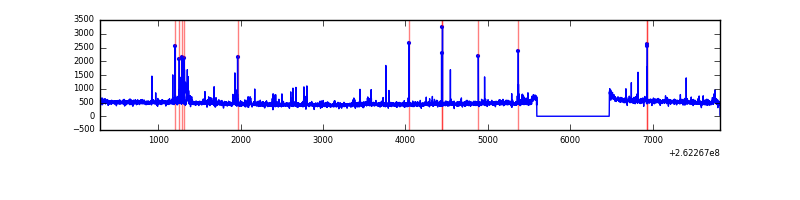 |
| C | 7526 | 6646 | 0 | 0 | 0.00% | 0.00% | 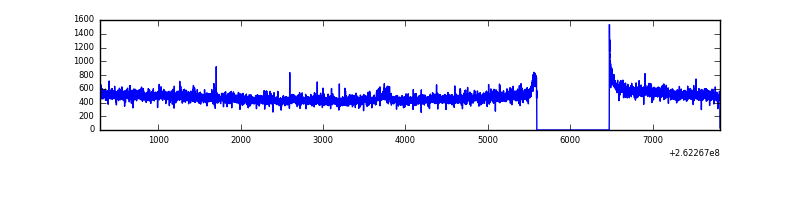 |
| D | 7526 | 6646 | 2654 | 2654 | 35.26% | 39.93% | 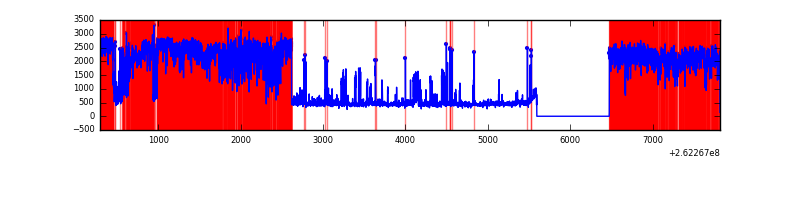 |
Top three noisy pixels from each quadrant. If the there are fewer than three noisy pixels in the level2.evt file, extra rows are filled as -1
| Pixel properties | Quadrant properties | ||||||
|---|---|---|---|---|---|---|---|
| Quadrant | DetID | PixID | Counts | Sigma | Mean | Median | Sigma |
| A | 14 | 111 | 46372 | 276.45 | 808 | 791 | 164.9 |
| A | 1 | 162 | 19920 | 116.02 | 808 | 791 | 164.9 |
| A | 0 | 226 | 7272 | 39.31 | 808 | 791 | 164.9 |
| B | 15 | 201 | 42817 | 274.49 | 799 | 779 | 153.2 |
| B | 4 | 80 | 39497 | 252.81 | 799 | 779 | 153.2 |
| B | 0 | 189 | 24607 | 155.58 | 799 | 779 | 153.2 |
| C | 3 | 233 | 148204 | 804.08 | 783 | 786 | 183.3 |
| C | 13 | 61 | 5434 | 25.35 | 783 | 786 | 183.3 |
| C | 6 | 253 | 2334 | 8.44 | 783 | 786 | 183.3 |
| D | 13 | 122 | 6641235 | 47473.31 | 590 | 574 | 139.9 |
| D | 5 | 222 | 225151 | 1605.47 | 590 | 574 | 139.9 |
| D | 10 | 157 | 140896 | 1003.15 | 590 | 574 | 139.9 |
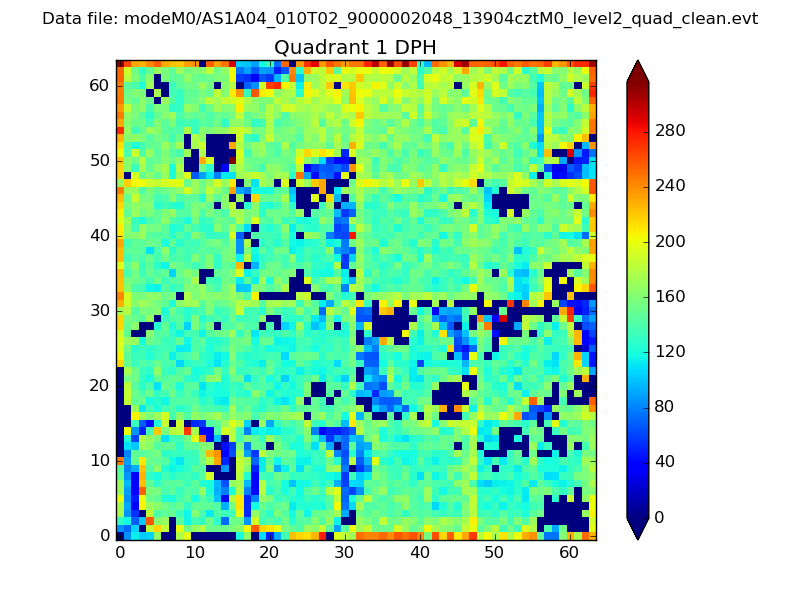
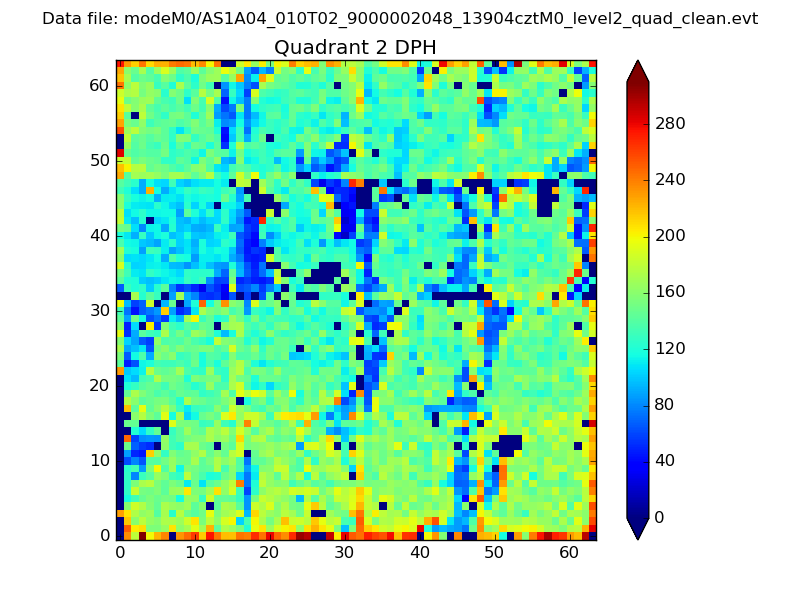
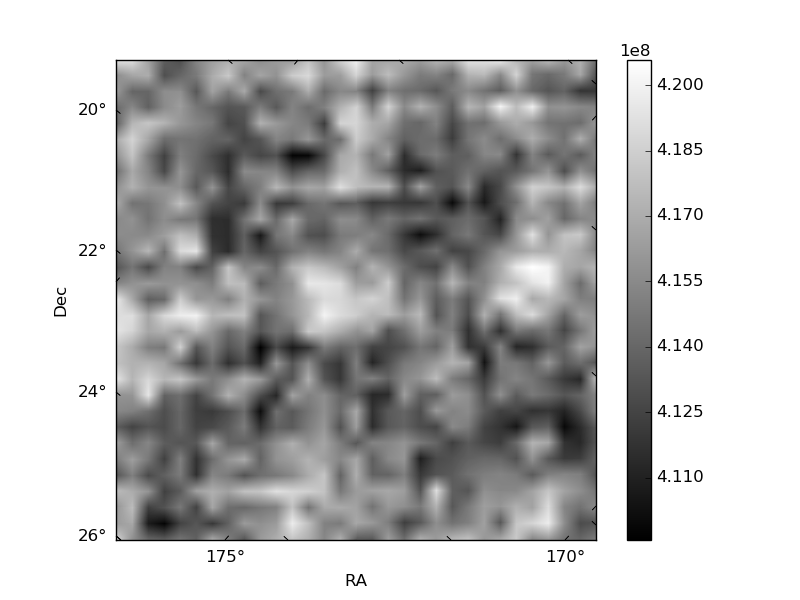
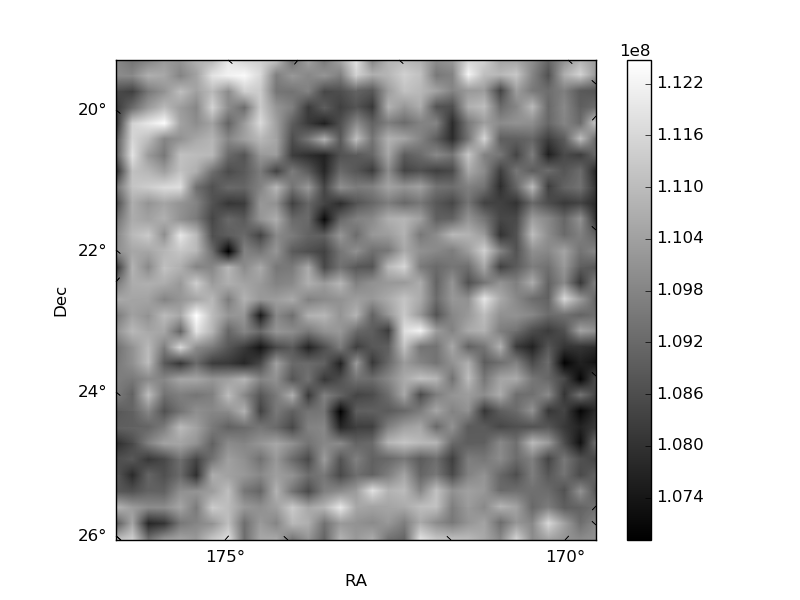
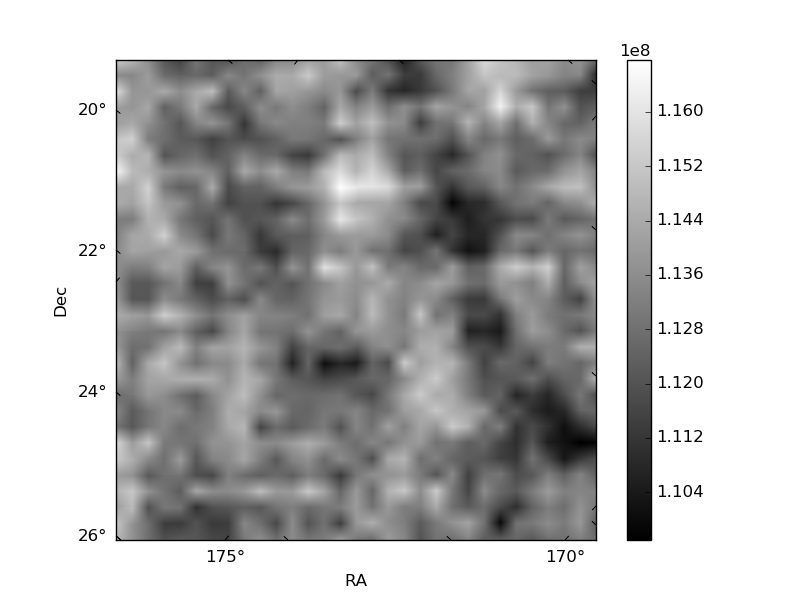
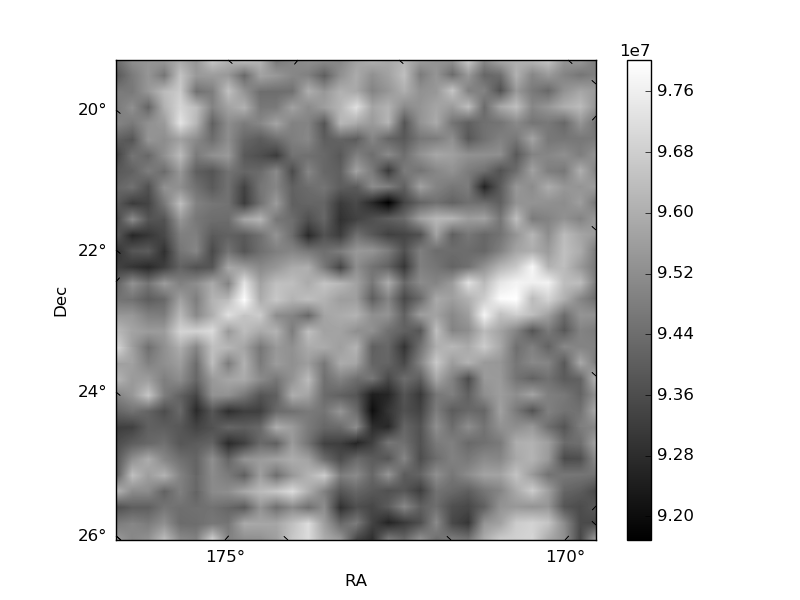
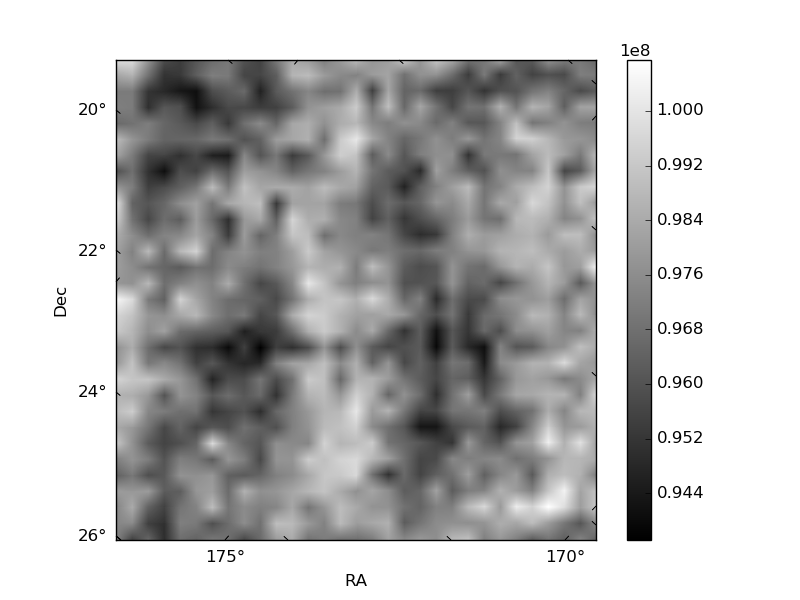
Histogram calculated using DETX and DETY for each event in the final _common_clean file
| Quadrant A |  |
 |
Quadrant B |
|---|---|---|---|
| Quadrant D | 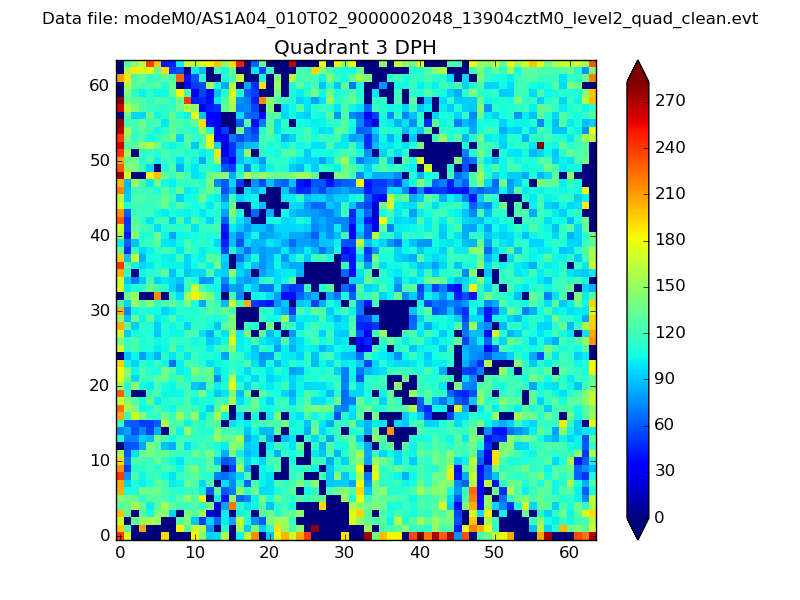 |
 |
Quadrant C |
| Plot type | Count rate plots | Images |
|---|---|---|
| Comparison with Poisson distribution Blue bars denote a histogram of data divided into 1 sec bins. Red curve is a Poisson curve with rate = median count rate of data. |
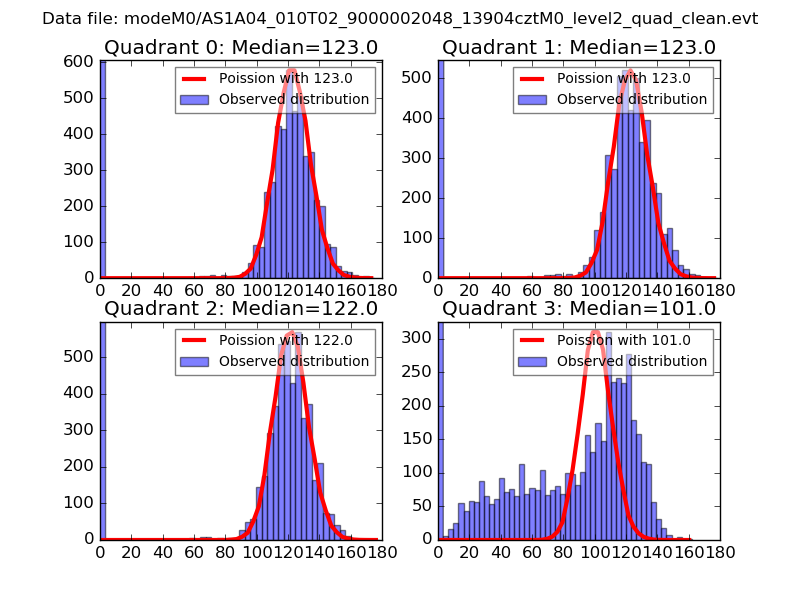 |
 |
| Quadrant-wise count rates Data is divided into 100 sec bins |
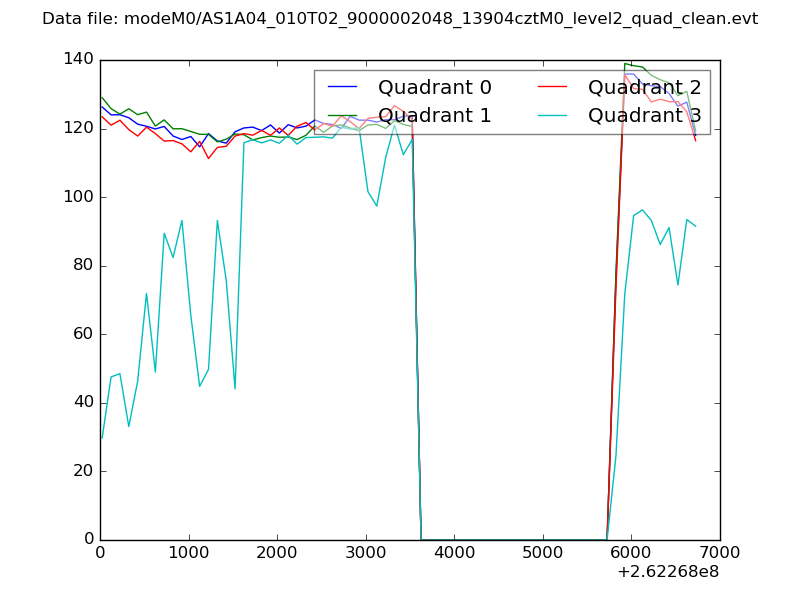 |
|
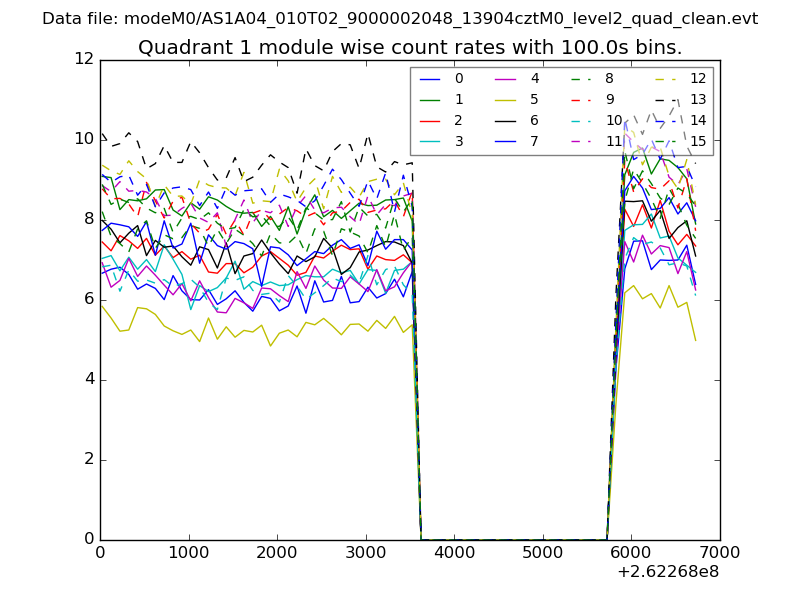
| Module-wise count rates for Quadrant A Data is divided into 100 sec bins |
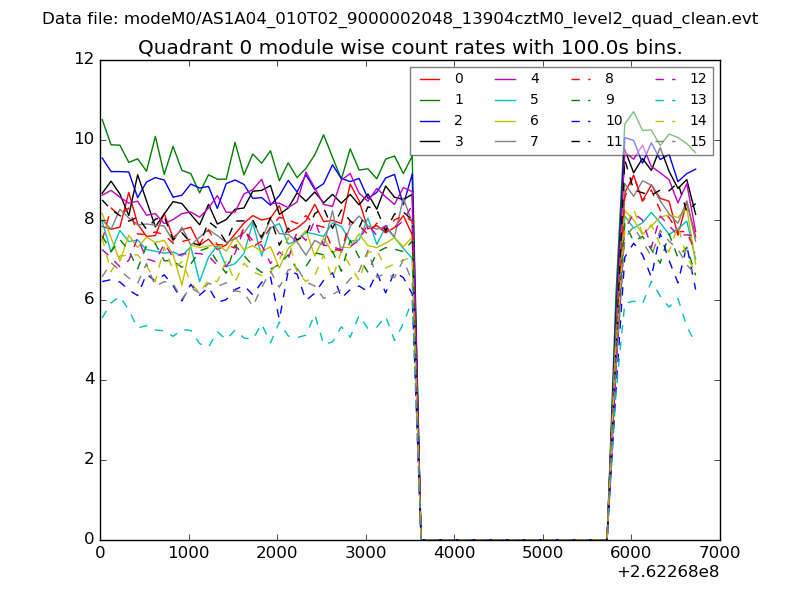 |
 |
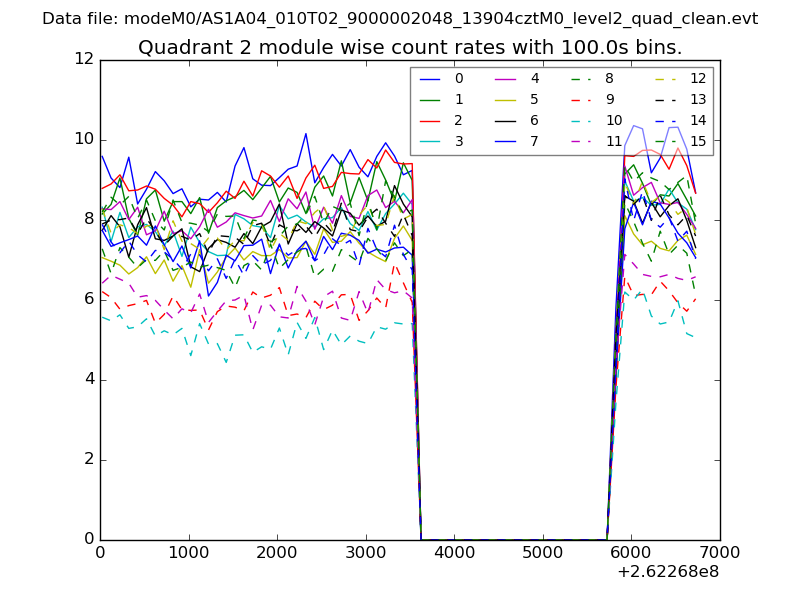
| Module-wise count rates for Quadrant B Data is divided into 100 sec bins |
 |
 |
| Module-wise count rates for Quadrant C Data is divided into 100 sec bins |
 |
 |
| Module-wise count rates for Quadrant D Data is divided into 100 sec bins |
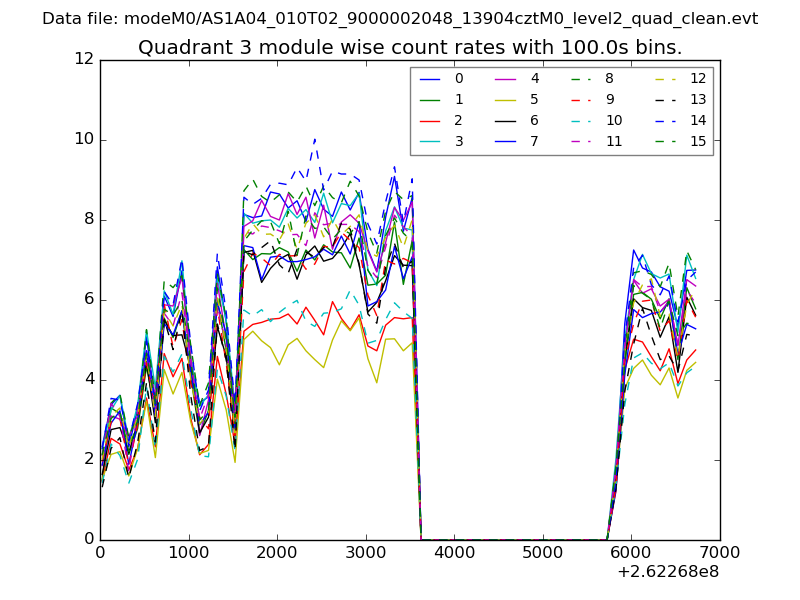 |
 |
| Parameter | Plot |
|---|---|
| CZT HV Monitor | 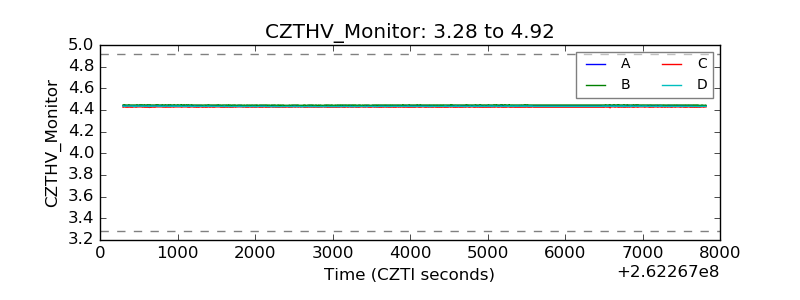 |
| D_VDD | 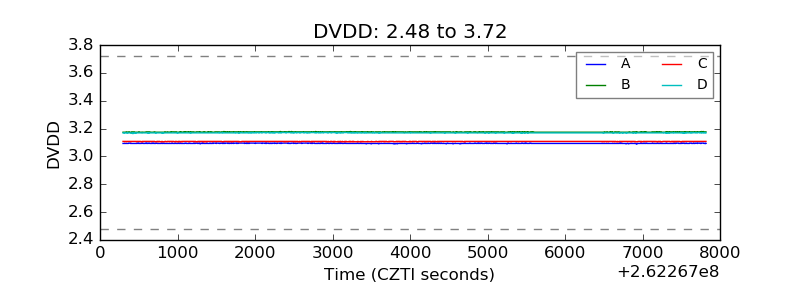 |
| Temperature 1 | 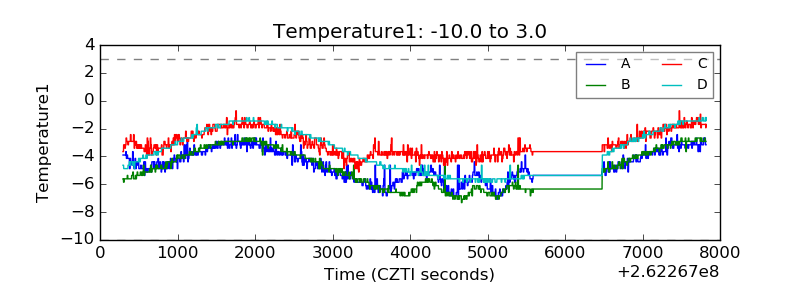 |
| Veto HV Monitor | 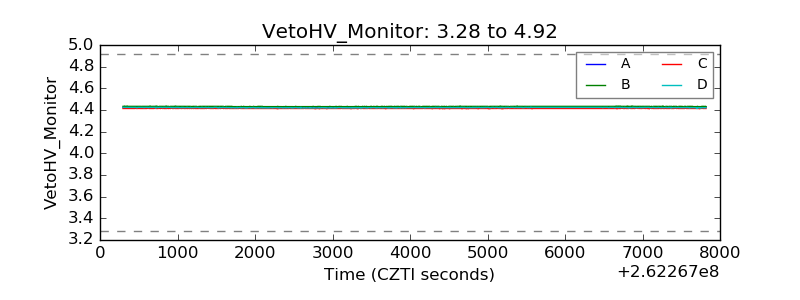 |
| Veto LLD | 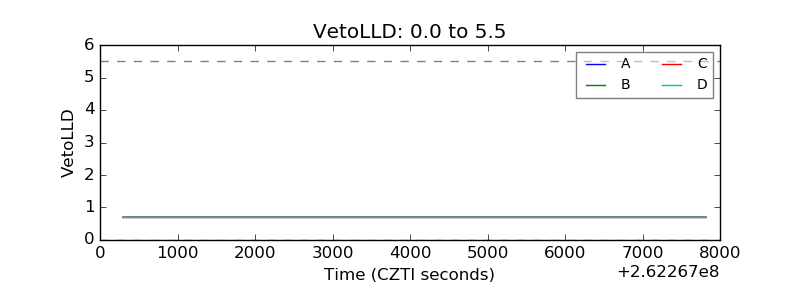 |
| Alpha Counter | 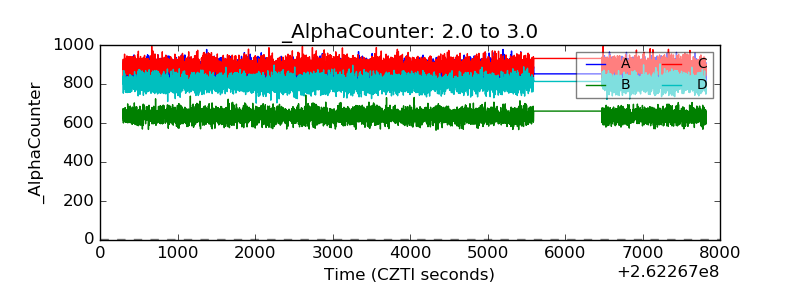 |
| _CPM_Rate | 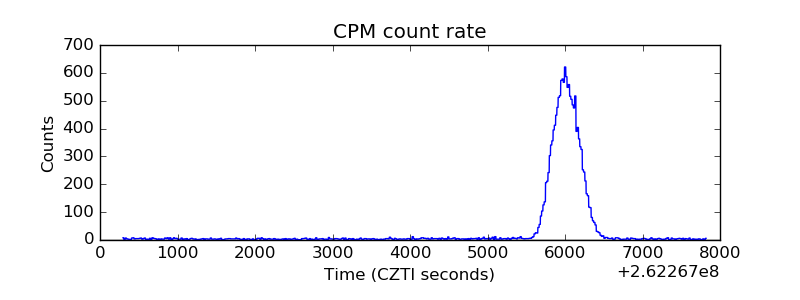 |
| CZT Counter | 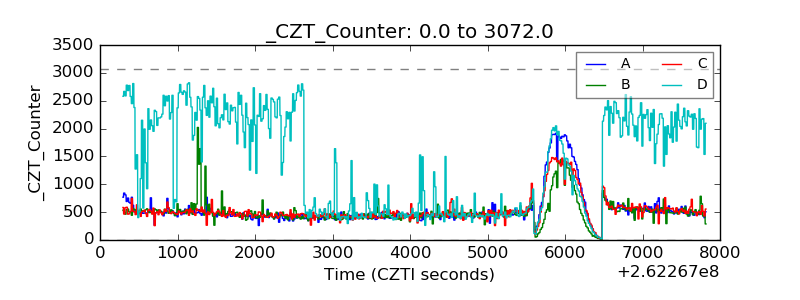 |
| +2.5 Volts monitor |  |
| +5 Volts monitor |  |
| _ROLL_ROT | 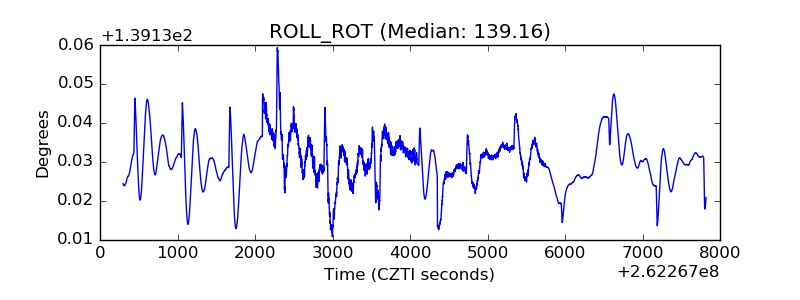 |
| _Roll_DEC | 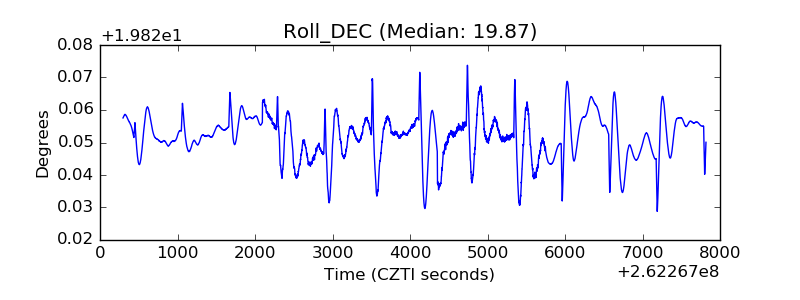 |
| _Roll_RA | 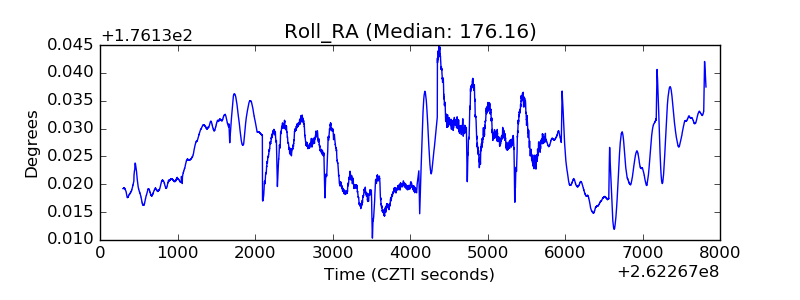 |
| Veto Counter | 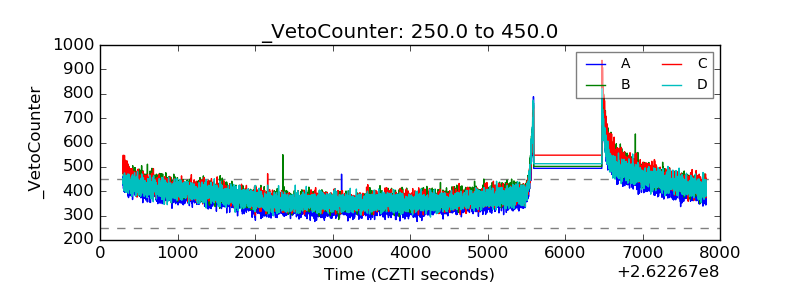 |