| Param | Original file | Final file |
|---|---|---|
| Filename | modeM0/AS1A04_010T02_9000002048_13905cztM0_level2.evt | modeM0/AS1A04_010T02_9000002048_13905cztM0_level2_quad_clean.evt |
| Size (bytes) | 665,107,200 | 89,432,640 |
| Size | 634.3 MB | 85.3 MB |
| Events in quadrant A | 2,907,851 | 621,192 |
| Events in quadrant B | 2,990,637 | 624,630 |
| Events in quadrant C | 2,928,556 | 616,391 |
| Events in quadrant D | 10,905,065 | 421,328 |
| Mode M0 | |||
|---|---|---|---|
| Quadrant | BADHDUFLAG | Total packets | Discarded packets |
| A | 0 | 12705 | 2 |
| B | 0 | 12901 | 1 |
| C | 0 | 12594 | 1 |
| D | 0 | 36587 | 1 |
| Mode SS | |||
|---|---|---|---|
| Quadrant | BADHDUFLAG | Total packets | Discarded packets |
| A | 0 | 124 | 0 |
| B | 0 | 124 | 0 |
| C | 0 | 124 | 0 |
| D | 0 | 124 | 0 |
| Mode M9 | |||
|---|---|---|---|
| Quadrant | BADHDUFLAG | Total packets | Discarded packets |
| A | 0 | 10 | 0 |
| B | 0 | 10 | 0 |
| C | 0 | 10 | 0 |
| D | 0 | 10 | 0 |
| Quadrant | Total seconds | Saturated seconds | Saturation percentage |
|---|---|---|---|
| A | 6063 | 67 | 1.105063% |
| B | 6063 | 60 | 0.989609% |
| C | 6063 | 51 | 0.841168% |
| D | 6063 | 2857 | 47.121887% |
Noise dominated data is calculated using 1-second bins in cleaned event files. If a bin has >2000 counts, and if more than 50% of those come from <1% of pixels, then it is considered to be noise-dominated and hence unusable.
| Quadrant | # 1 sec bins | Bins with >0 counts | Bins with >2000 counts | High rate bins dominated by noise | Noise dominated (total time) | Noise dominated (detector-on time) | Marked lightcurve |
|---|---|---|---|---|---|---|---|
| A | 7099 | 6064 | 7 | 7 | 0.10% | 0.12% | 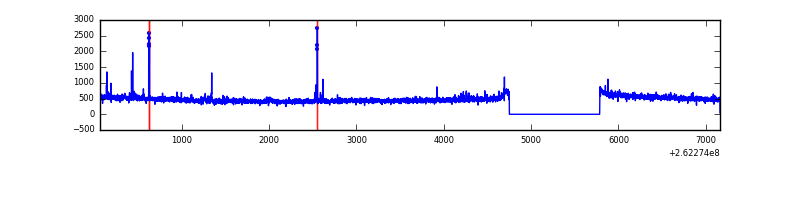 |
| B | 7099 | 6064 | 8 | 8 | 0.11% | 0.13% | 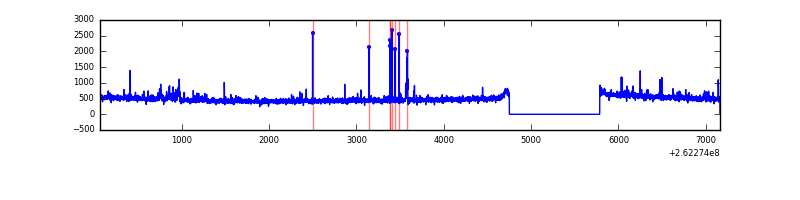 |
| C | 7099 | 6064 | 0 | 0 | 0.00% | 0.00% | 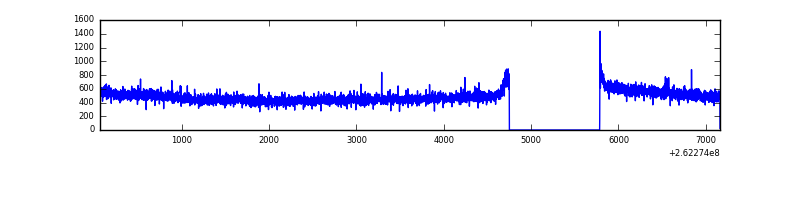 |
| D | 7098 | 6063 | 2522 | 2522 | 35.53% | 41.60% | 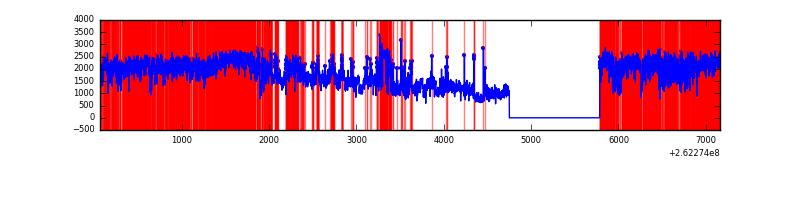 |
Top three noisy pixels from each quadrant. If the there are fewer than three noisy pixels in the level2.evt file, extra rows are filled as -1
| Pixel properties | Quadrant properties | ||||||
|---|---|---|---|---|---|---|---|
| Quadrant | DetID | PixID | Counts | Sigma | Mean | Median | Sigma |
| A | 9 | 143 | 26502 | 170.65 | 736 | 719 | 151.1 |
| A | 14 | 111 | 17696 | 112.36 | 736 | 719 | 151.1 |
| A | 1 | 162 | 16635 | 105.34 | 736 | 719 | 151.1 |
| B | 10 | 244 | 30824 | 216.25 | 729 | 712 | 139.2 |
| B | 4 | 173 | 26675 | 186.45 | 729 | 712 | 139.2 |
| B | 0 | 219 | 20282 | 140.54 | 729 | 712 | 139.2 |
| C | 3 | 233 | 129844 | 781.01 | 717 | 720 | 165.3 |
| C | 13 | 61 | 5061 | 26.26 | 717 | 720 | 165.3 |
| C | 12 | 4 | 3621 | 17.55 | 717 | 720 | 165.3 |
| D | 13 | 122 | 8107441 | 59113.89 | 573 | 560 | 137.1 |
| D | 5 | 222 | 253237 | 1842.47 | 573 | 560 | 137.1 |
| D | 1 | 52 | 149327 | 1084.78 | 573 | 560 | 137.1 |
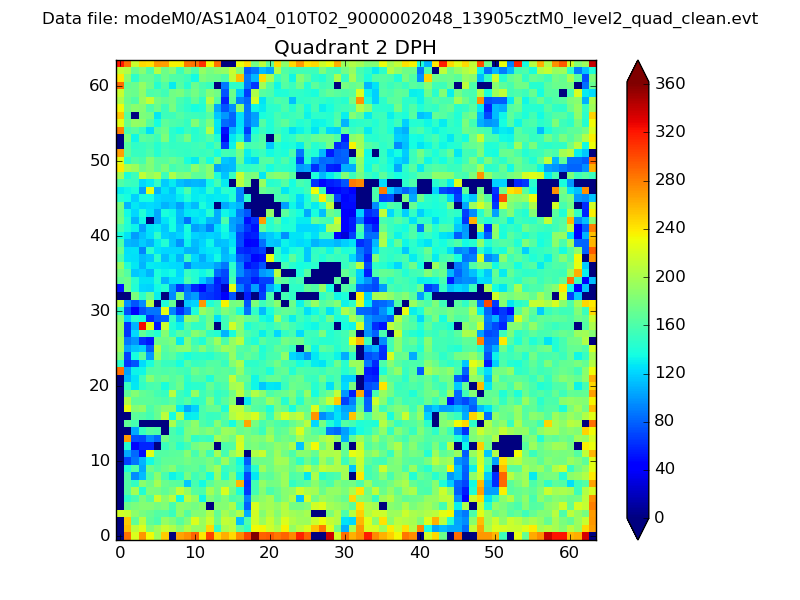
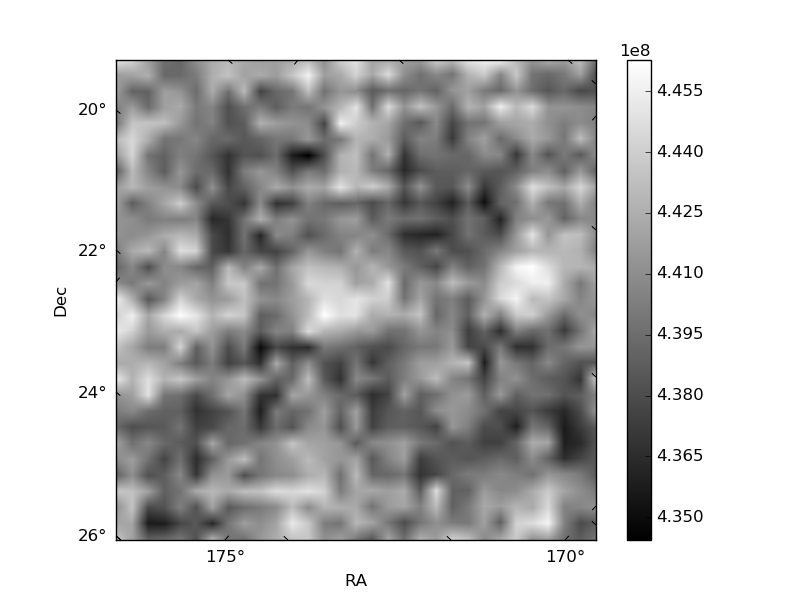
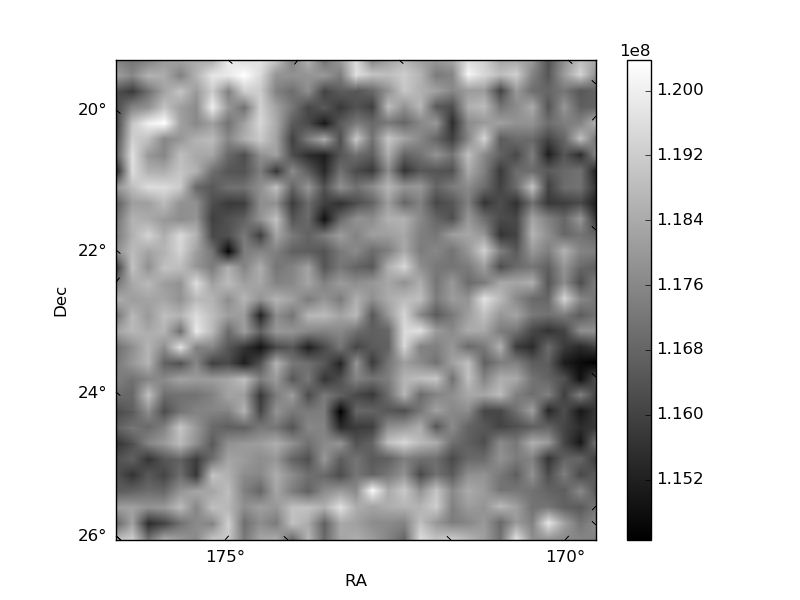
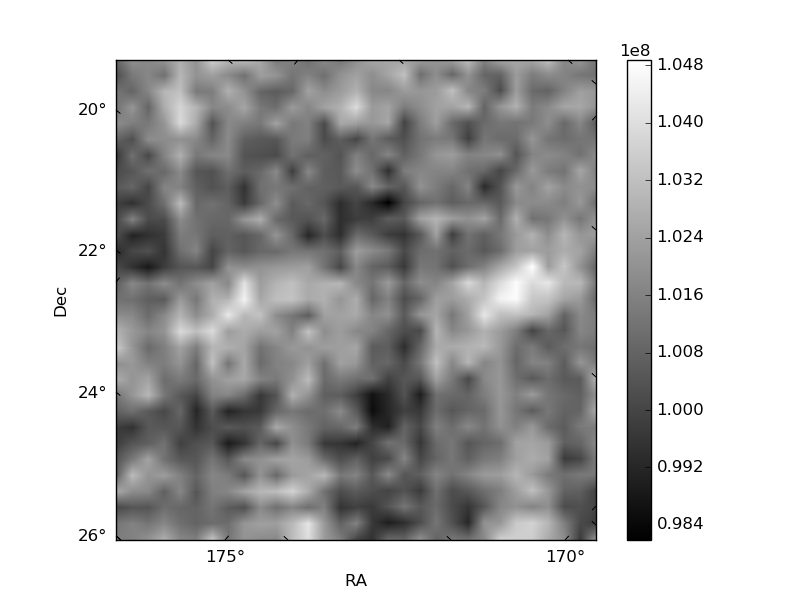
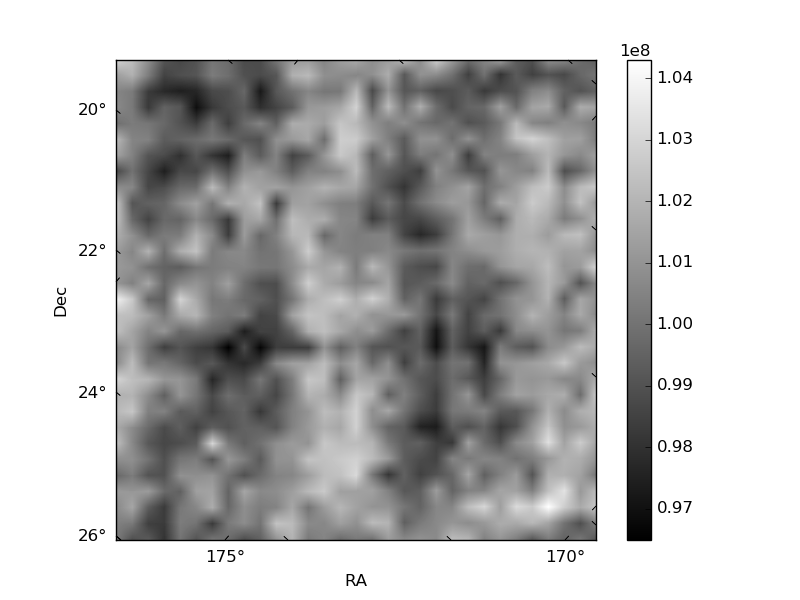
Histogram calculated using DETX and DETY for each event in the final _common_clean file
| Quadrant A | 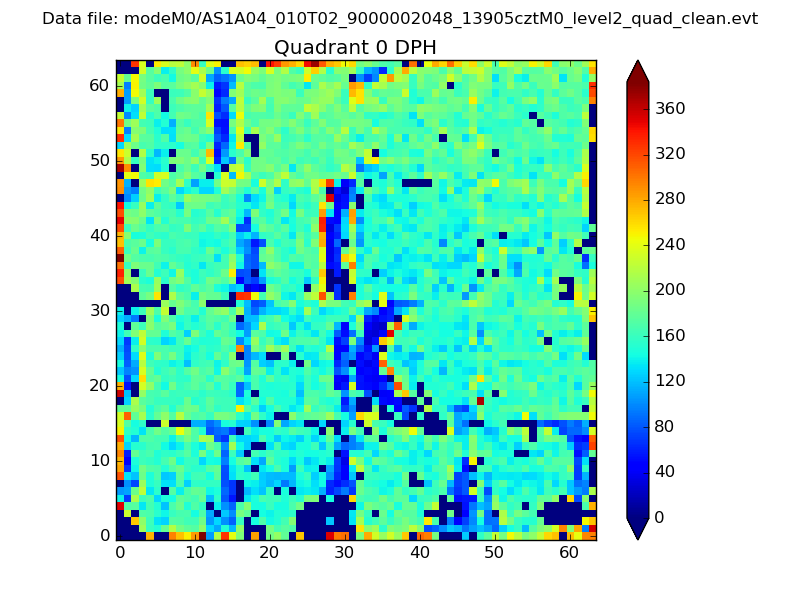 |
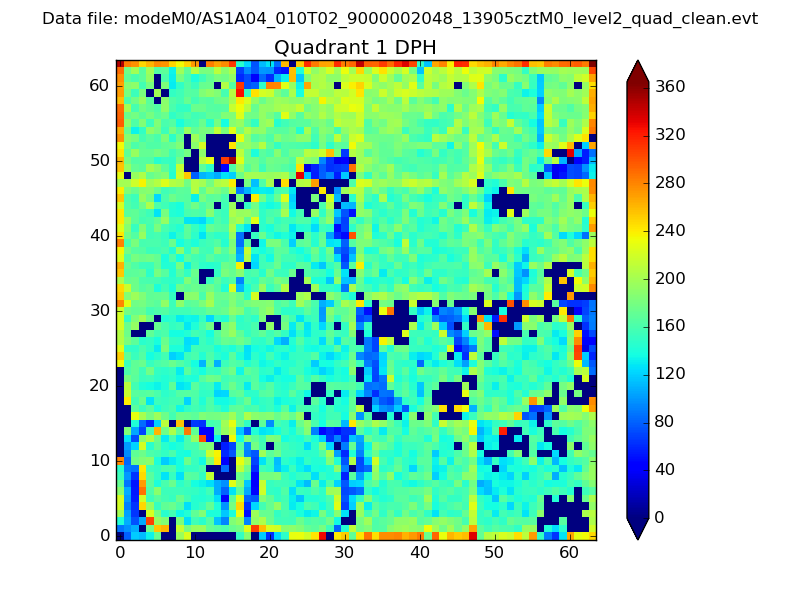 |
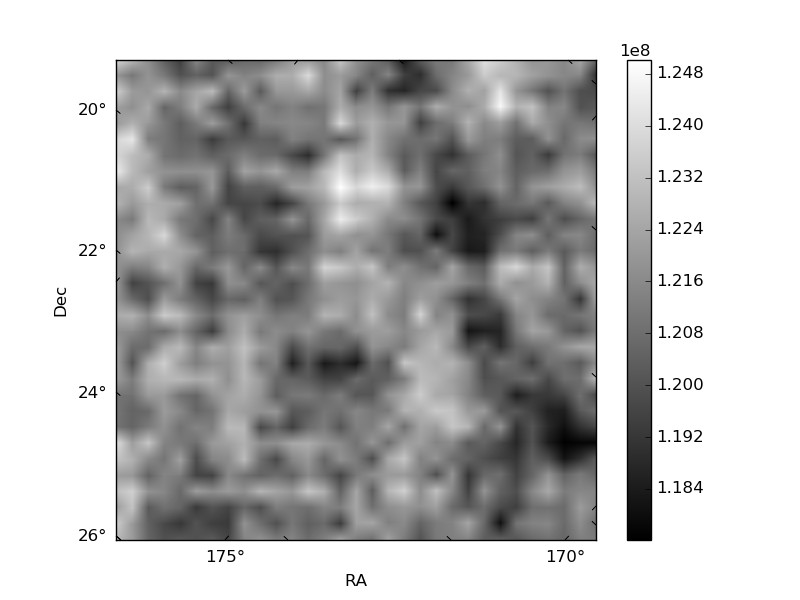
Quadrant B |
|---|---|---|---|
| Quadrant D | 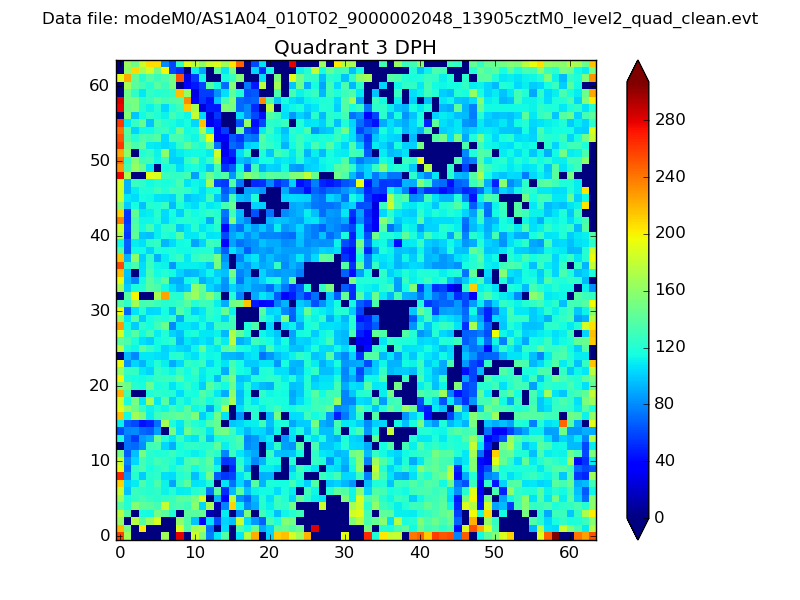 |
 |
Quadrant C |
| Plot type | Count rate plots | Images |
|---|---|---|
| Comparison with Poisson distribution Blue bars denote a histogram of data divided into 1 sec bins. Red curve is a Poisson curve with rate = median count rate of data. |
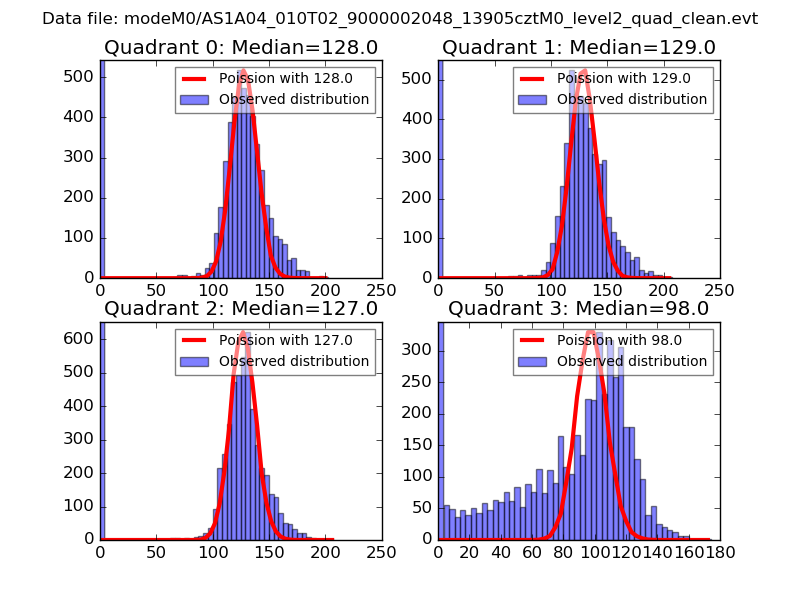 |
 |
| Quadrant-wise count rates Data is divided into 100 sec bins |
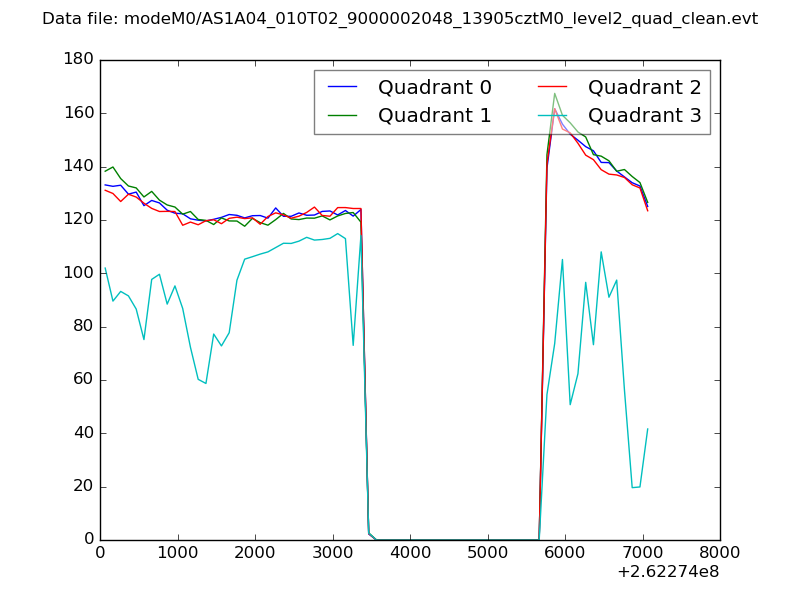 |
|
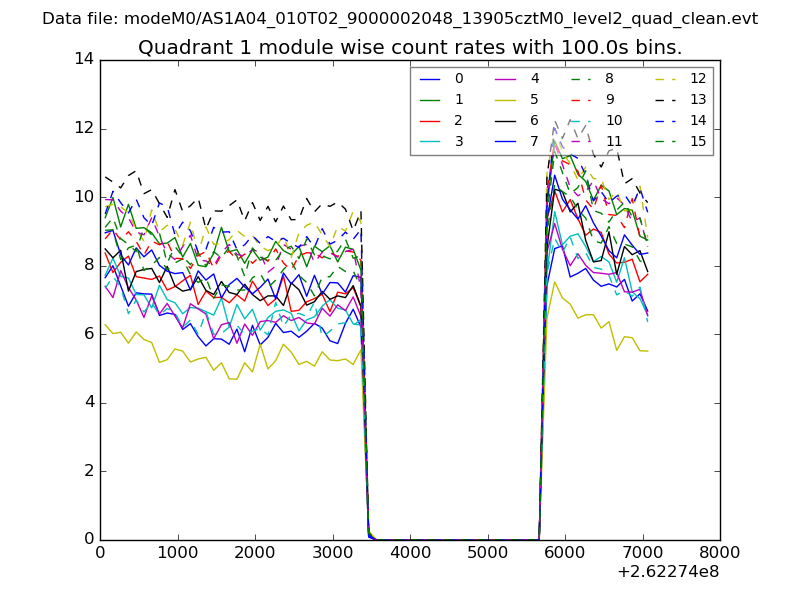
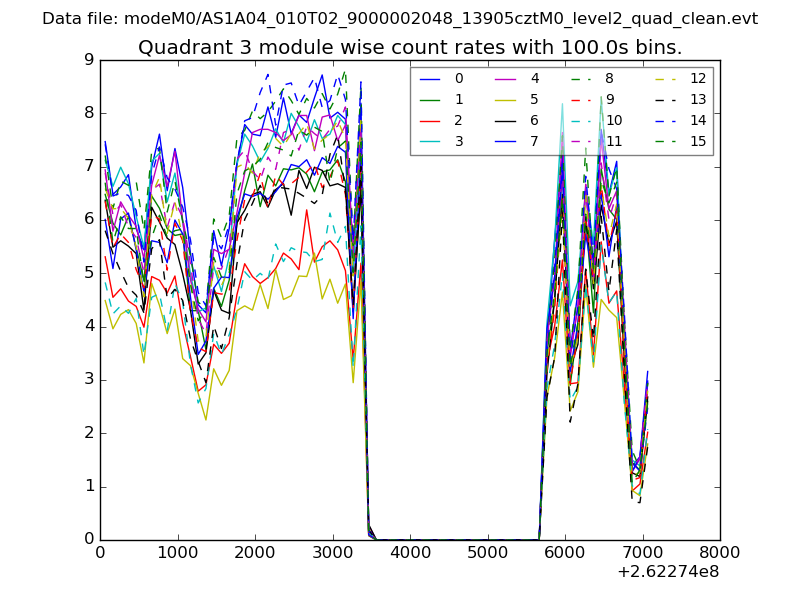
| Module-wise count rates for Quadrant A Data is divided into 100 sec bins |
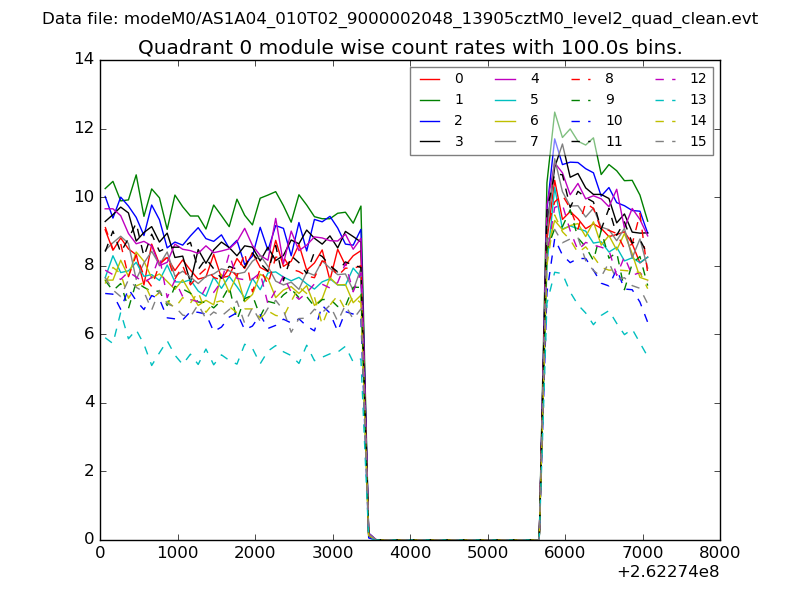 |
 |
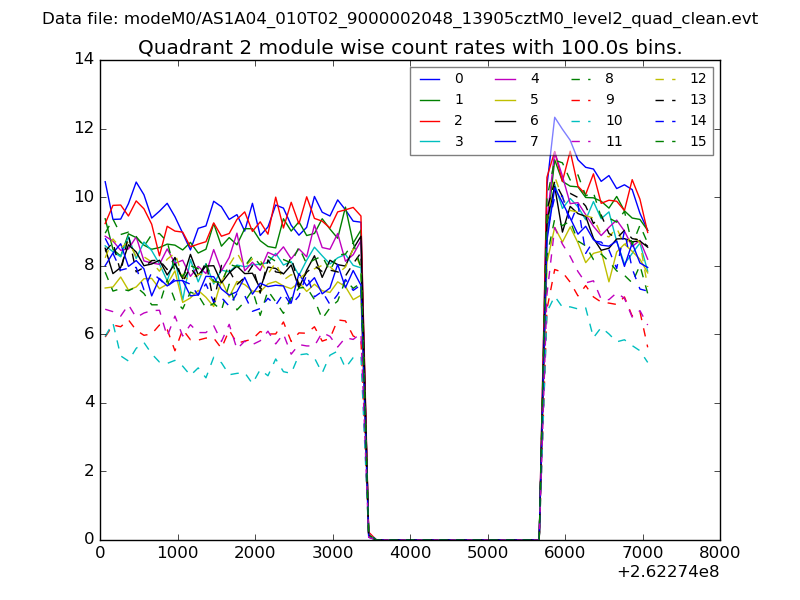
| Module-wise count rates for Quadrant B Data is divided into 100 sec bins |
 |
 |
| Module-wise count rates for Quadrant C Data is divided into 100 sec bins |
 |
 |
| Module-wise count rates for Quadrant D Data is divided into 100 sec bins |
 |
 |
| Parameter | Plot |
|---|---|
| CZT HV Monitor | 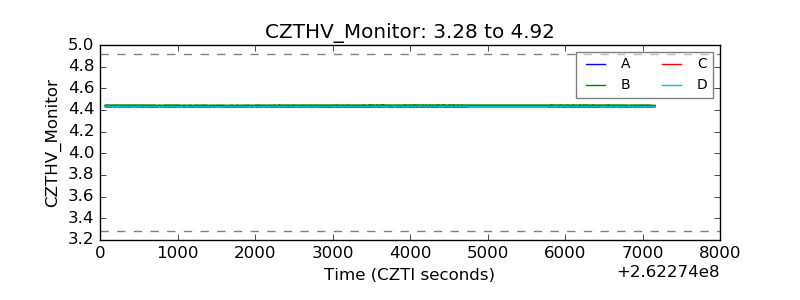 |
| D_VDD | 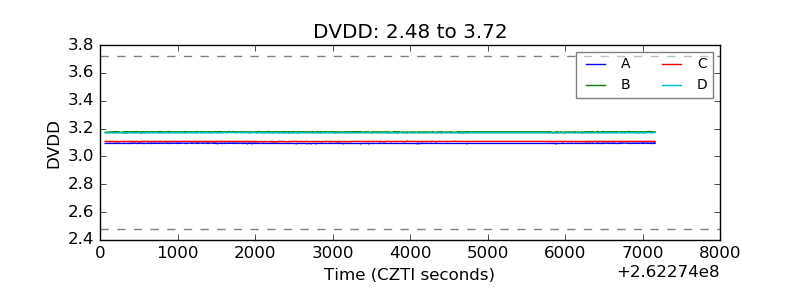 |
| Temperature 1 | 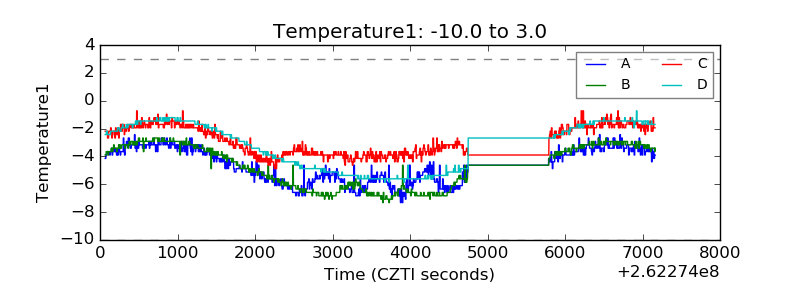 |
| Veto HV Monitor | 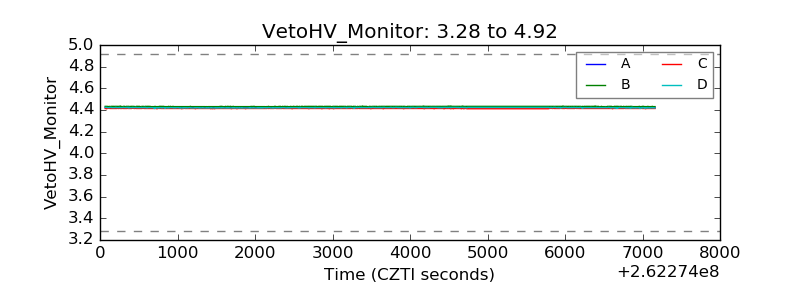 |
| Veto LLD | 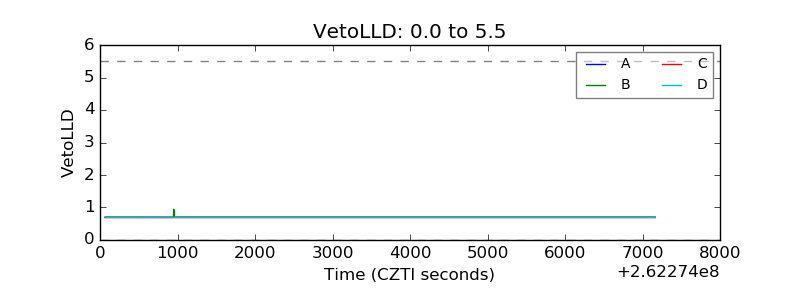 |
| Alpha Counter | 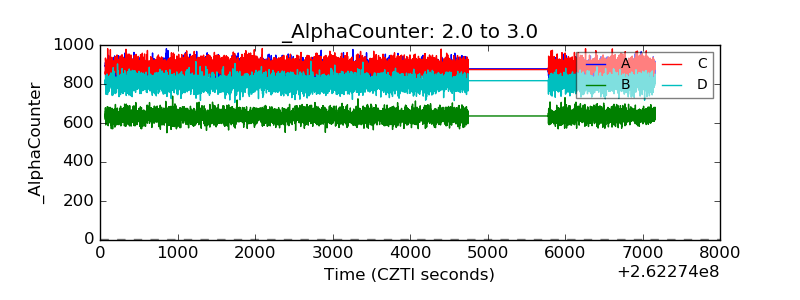 |
| _CPM_Rate | 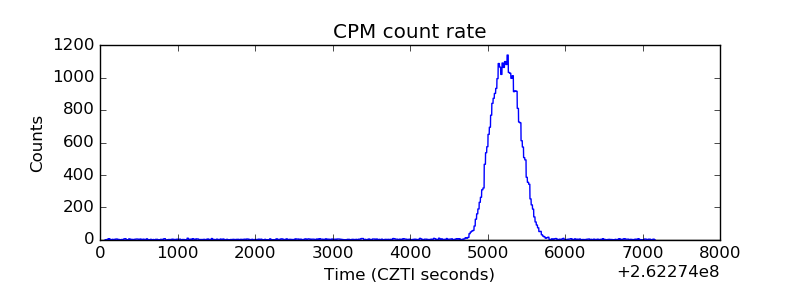 |
| CZT Counter | 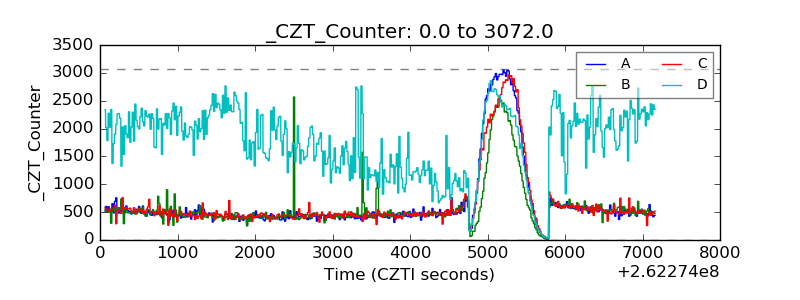 |
| +2.5 Volts monitor | 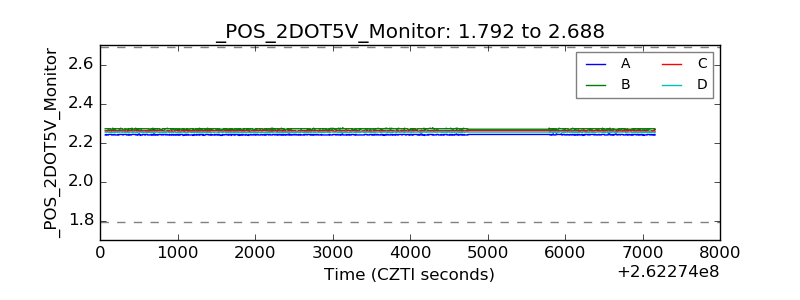 |
| +5 Volts monitor | 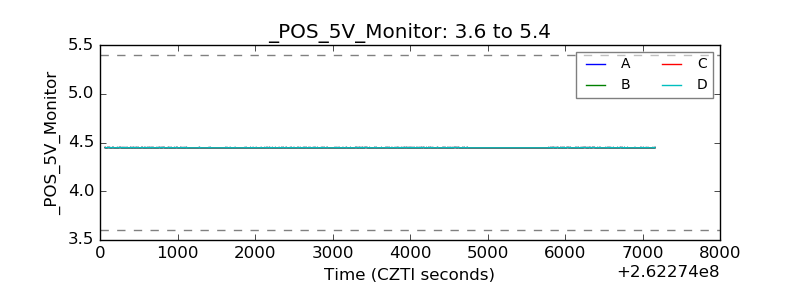 |
| _ROLL_ROT | 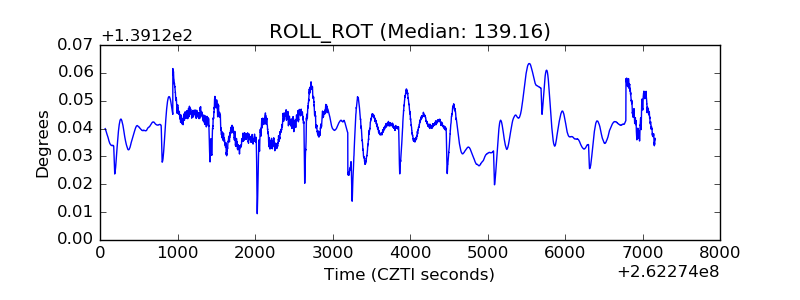 |
| _Roll_DEC | 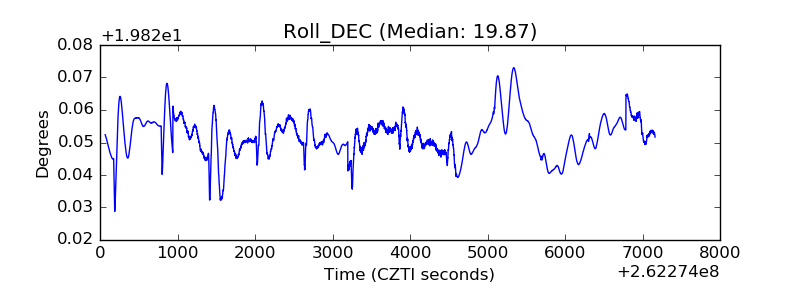 |
| _Roll_RA | 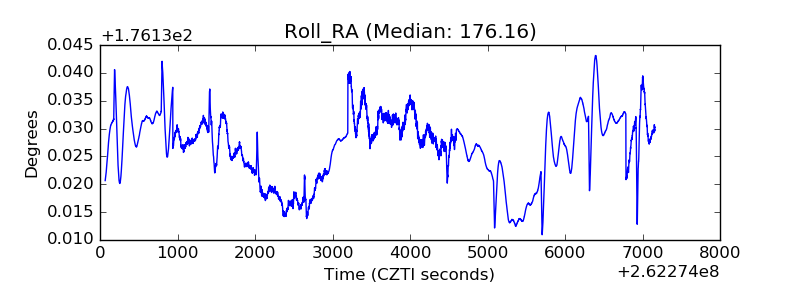 |
| Veto Counter | 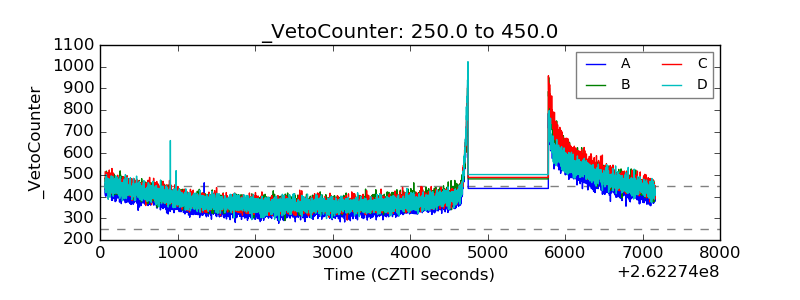 |