| Param | Original file | Final file |
|---|---|---|
| Filename | modeM0/AS1A04_010T02_9000002048_13907cztM0_level2.evt | modeM0/AS1A04_010T02_9000002048_13907cztM0_level2_quad_clean.evt |
| Size (bytes) | 823,400,640 | 87,099,840 |
| Size | 785.3 MB | 83.1 MB |
| Events in quadrant A | 3,142,083 | 671,596 |
| Events in quadrant B | 3,236,017 | 675,561 |
| Events in quadrant C | 3,181,765 | 667,961 |
| Events in quadrant D | 14,943,884 | 174,552 |
| Mode M0 | |||
|---|---|---|---|
| Quadrant | BADHDUFLAG | Total packets | Discarded packets |
| A | 0 | 13556 | 3 |
| B | 0 | 13836 | 2 |
| C | 0 | 13625 | 2 |
| D | 0 | 48776 | 2 |
| Mode SS | |||
|---|---|---|---|
| Quadrant | BADHDUFLAG | Total packets | Discarded packets |
| A | 0 | 130 | 0 |
| B | 0 | 130 | 0 |
| C | 0 | 130 | 0 |
| D | 0 | 130 | 0 |
| Mode M9 | |||
|---|---|---|---|
| Quadrant | BADHDUFLAG | Total packets | Discarded packets |
| A | 0 | 15 | 0 |
| B | 0 | 15 | 0 |
| C | 0 | 15 | 0 |
| D | 0 | 16 | 0 |
| Quadrant | Total seconds | Saturated seconds | Saturation percentage |
|---|---|---|---|
| A | 6388 | 54 | 0.845335% |
| B | 6388 | 55 | 0.860989% |
| C | 6388 | 45 | 0.704446% |
| D | 6388 | 5775 | 90.403882% |
Noise dominated data is calculated using 1-second bins in cleaned event files. If a bin has >2000 counts, and if more than 50% of those come from <1% of pixels, then it is considered to be noise-dominated and hence unusable.
| Quadrant | # 1 sec bins | Bins with >0 counts | Bins with >2000 counts | High rate bins dominated by noise | Noise dominated (total time) | Noise dominated (detector-on time) | Marked lightcurve |
|---|---|---|---|---|---|---|---|
| A | 7549 | 6389 | 0 | 0 | 0.00% | 0.00% | 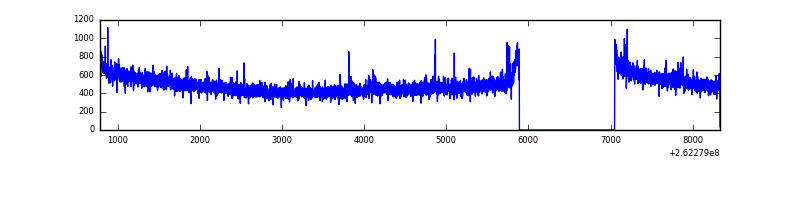 |
| B | 7549 | 6389 | 2 | 2 | 0.03% | 0.03% | 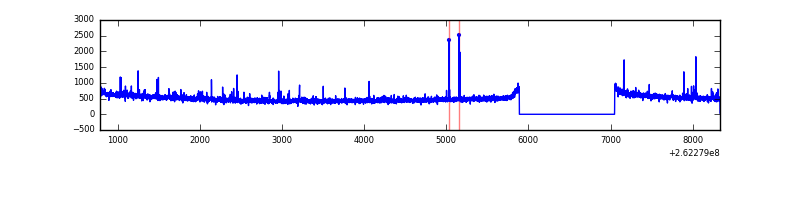 |
| C | 7549 | 6389 | 0 | 0 | 0.00% | 0.00% | 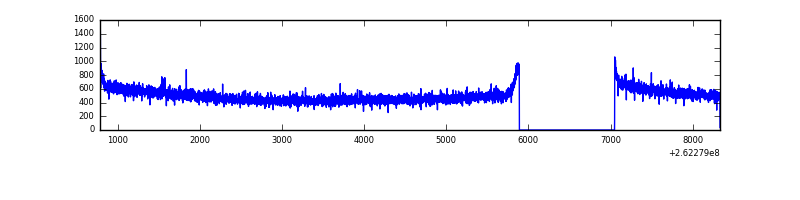 |
| D | 7548 | 6388 | 5432 | 5432 | 71.97% | 85.03% | 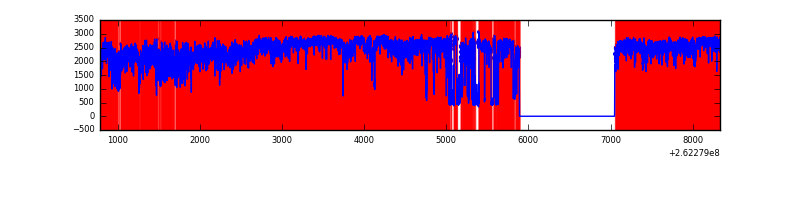 |
Top three noisy pixels from each quadrant. If the there are fewer than three noisy pixels in the level2.evt file, extra rows are filled as -1
| Pixel properties | Quadrant properties | ||||||
|---|---|---|---|---|---|---|---|
| Quadrant | DetID | PixID | Counts | Sigma | Mean | Median | Sigma |
| A | 9 | 143 | 16251 | 93.41 | 807 | 791 | 165.5 |
| A | 1 | 162 | 14488 | 82.76 | 807 | 791 | 165.5 |
| A | 0 | 226 | 7168 | 38.53 | 807 | 791 | 165.5 |
| B | 4 | 173 | 41244 | 265.31 | 799 | 781 | 152.5 |
| B | 0 | 189 | 28705 | 183.09 | 799 | 781 | 152.5 |
| B | 12 | 111 | 17479 | 109.49 | 799 | 781 | 152.5 |
| C | 3 | 233 | 112225 | 611.3 | 787 | 791 | 182.3 |
| C | 13 | 61 | 5519 | 25.93 | 787 | 791 | 182.3 |
| C | 12 | 4 | 3210 | 13.27 | 787 | 791 | 182.3 |
| D | 13 | 122 | 13356900 | 192042.78 | 291 | 285 | 69.6 |
| D | 1 | 52 | 344930 | 4955.34 | 291 | 285 | 69.6 |
| D | 13 | 189 | 42903 | 612.77 | 291 | 285 | 69.6 |
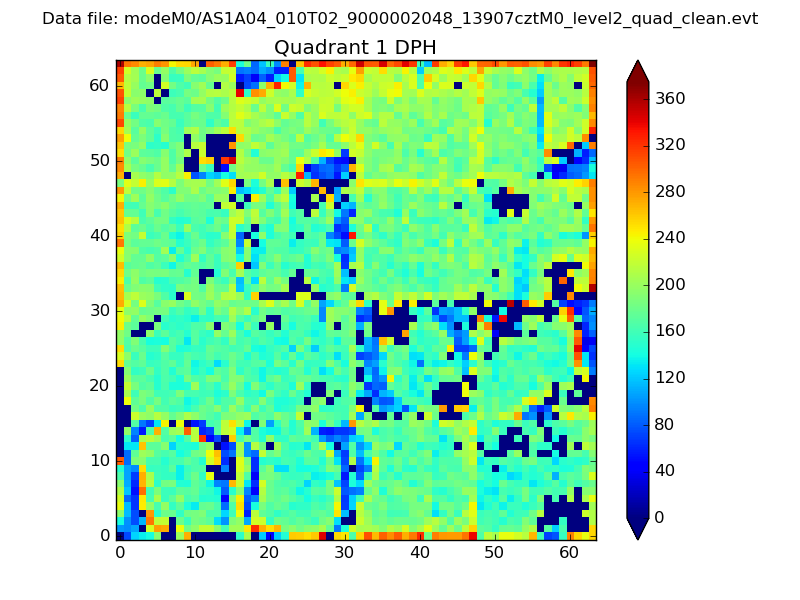
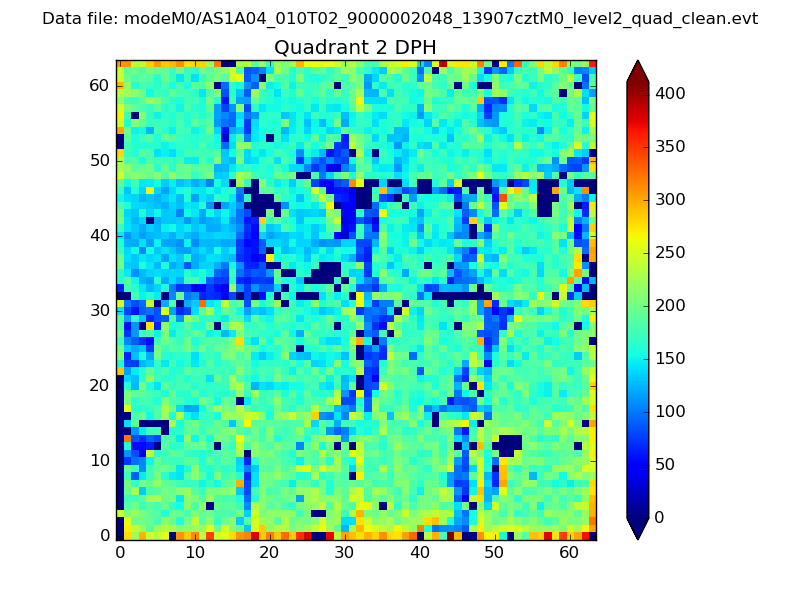
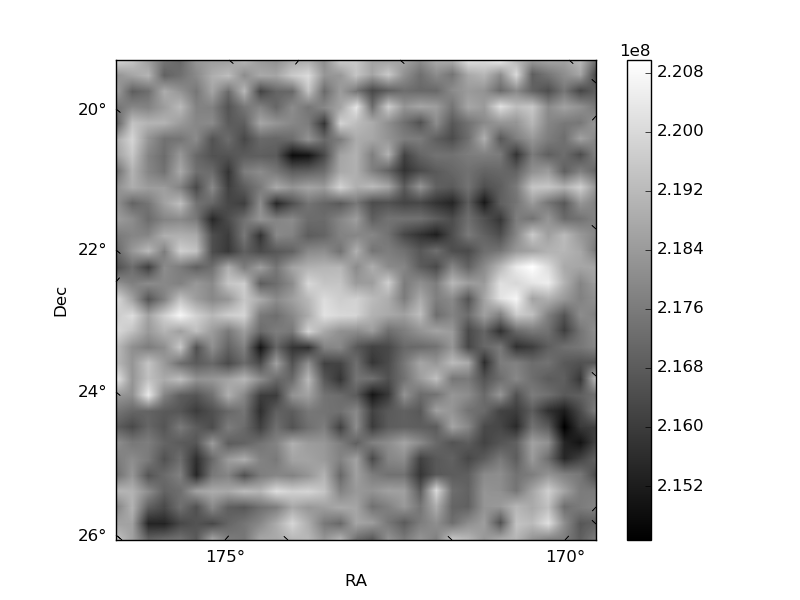
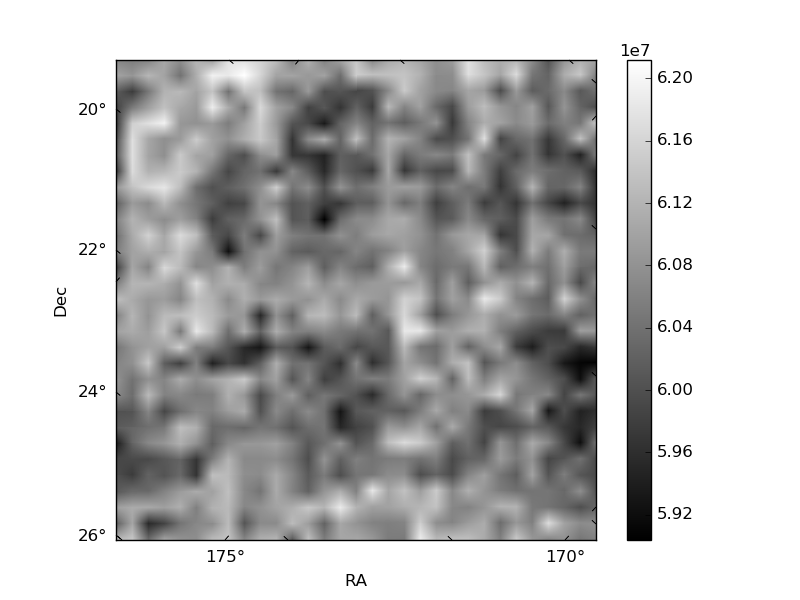
Histogram calculated using DETX and DETY for each event in the final _common_clean file
| Quadrant A |  |
 |
Quadrant B |
|---|---|---|---|
| Quadrant D | 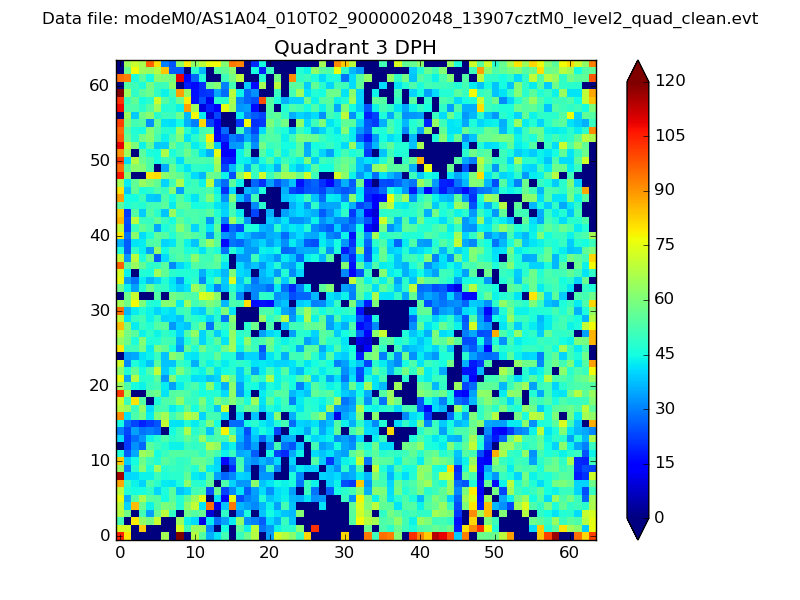 |
 |
Quadrant C |
| Plot type | Count rate plots | Images |
|---|---|---|
| Comparison with Poisson distribution Blue bars denote a histogram of data divided into 1 sec bins. Red curve is a Poisson curve with rate = median count rate of data. |
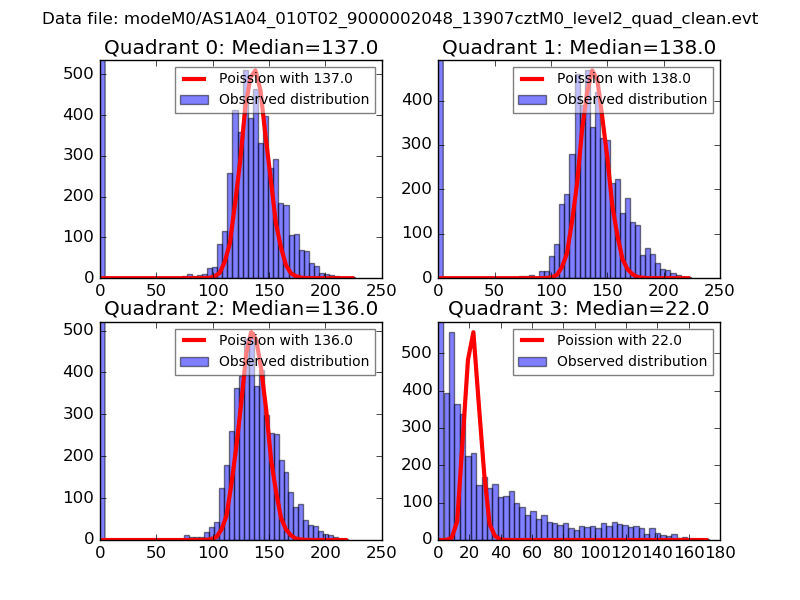 |
 |
| Quadrant-wise count rates Data is divided into 100 sec bins |
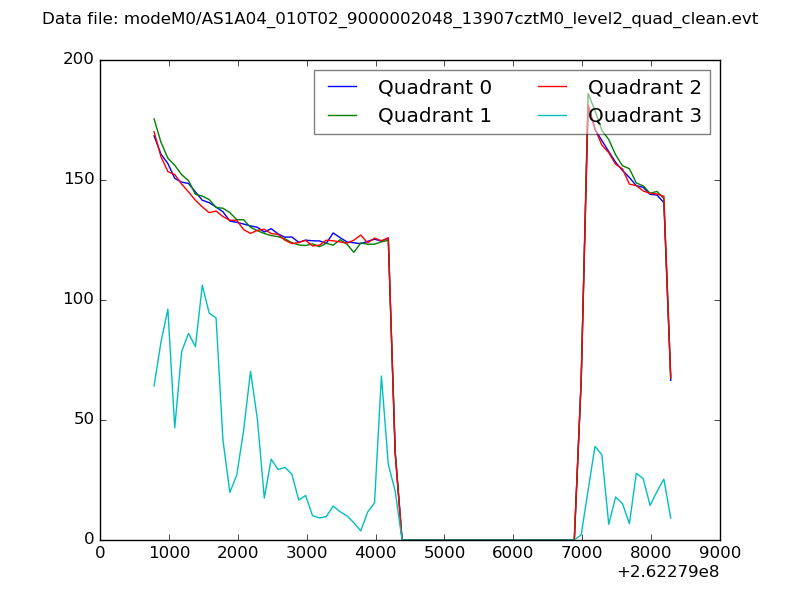 |
|
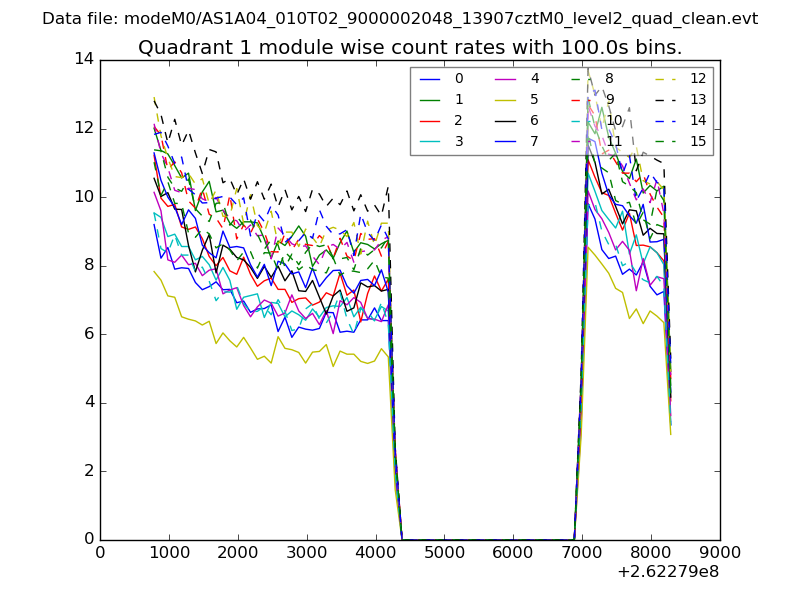
| Module-wise count rates for Quadrant A Data is divided into 100 sec bins |
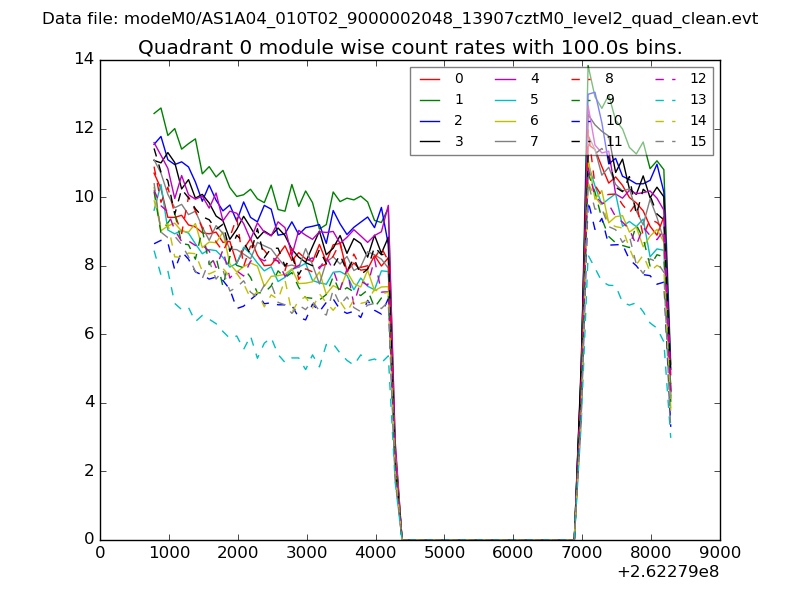 |
 |
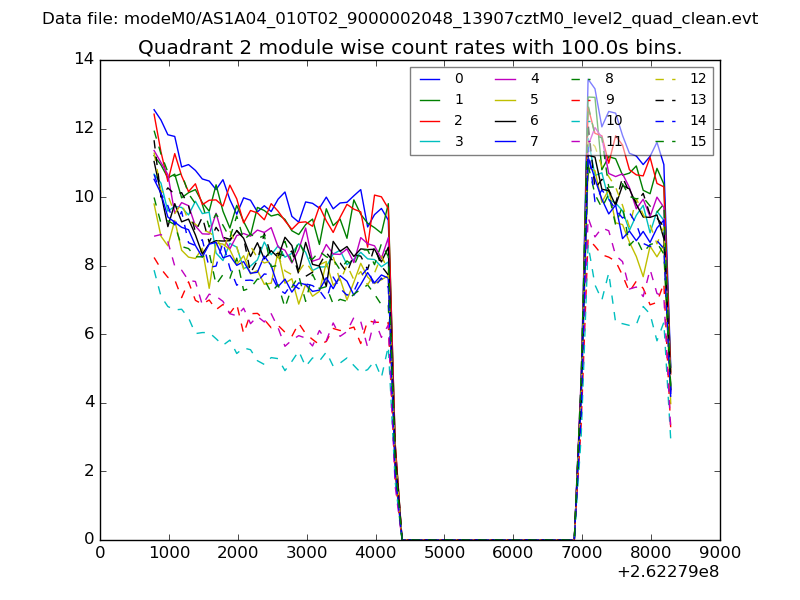
| Module-wise count rates for Quadrant B Data is divided into 100 sec bins |
 |
 |
| Module-wise count rates for Quadrant C Data is divided into 100 sec bins |
 |
 |
| Module-wise count rates for Quadrant D Data is divided into 100 sec bins |
 |
 |
| Parameter | Plot |
|---|---|
| CZT HV Monitor | 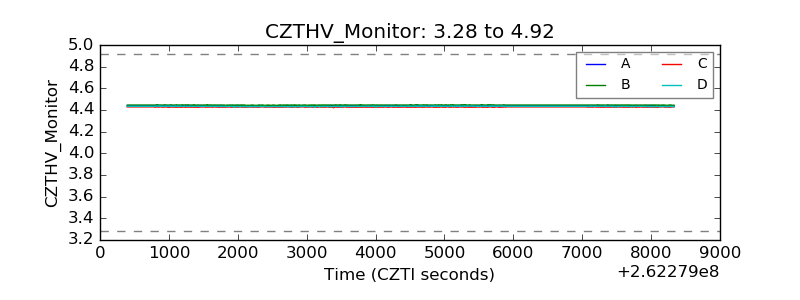 |
| D_VDD | 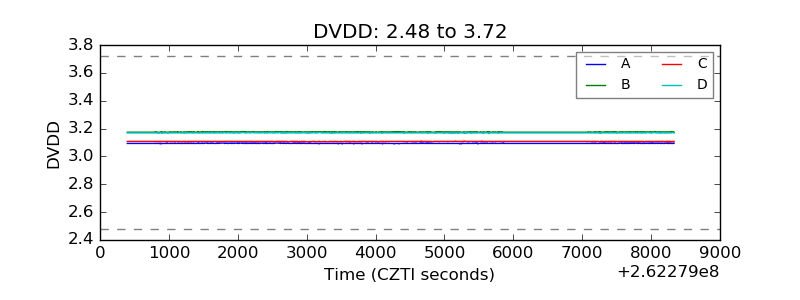 |
| Temperature 1 | 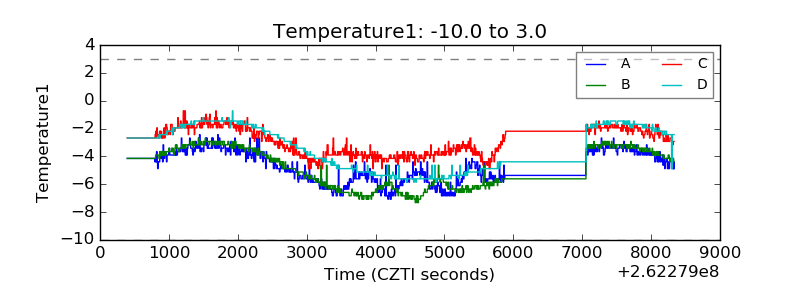 |
| Veto HV Monitor | 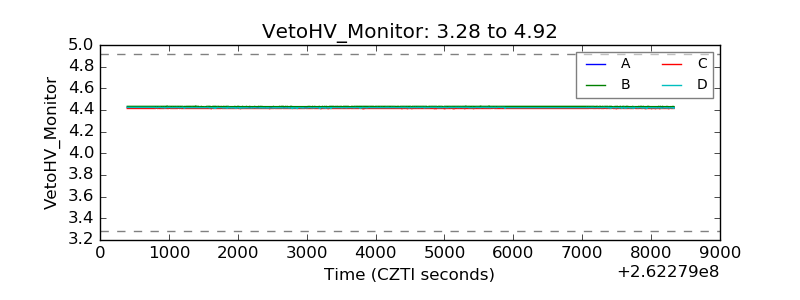 |
| Veto LLD | 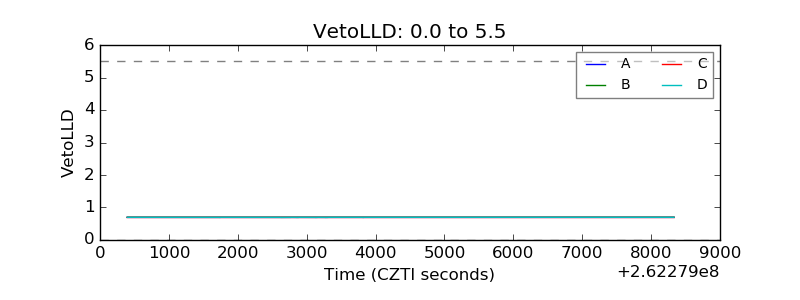 |
| Alpha Counter | 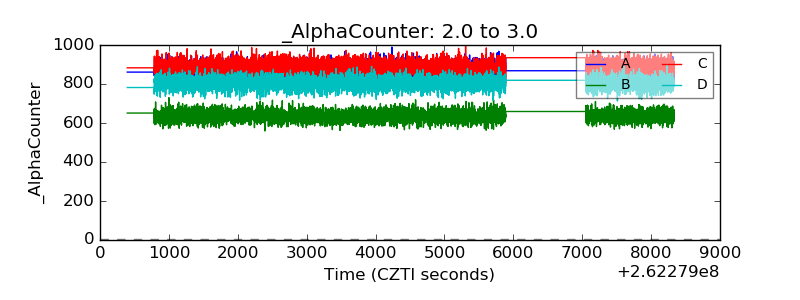 |
| _CPM_Rate | 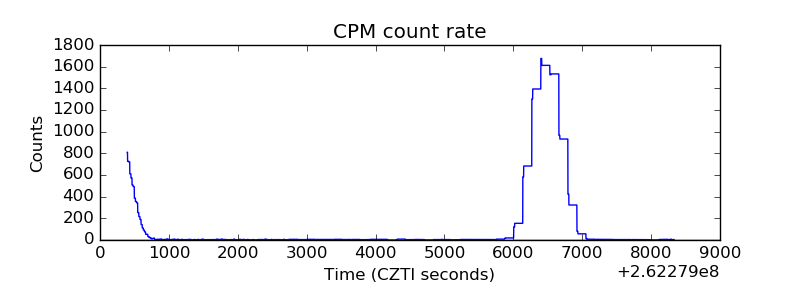 |
| CZT Counter | 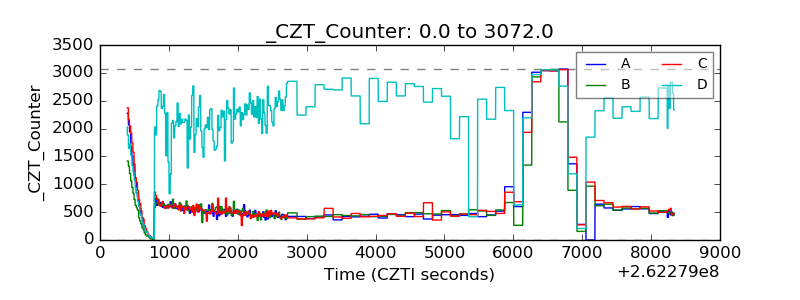 |
| +2.5 Volts monitor |  |
| +5 Volts monitor |  |
| _ROLL_ROT | 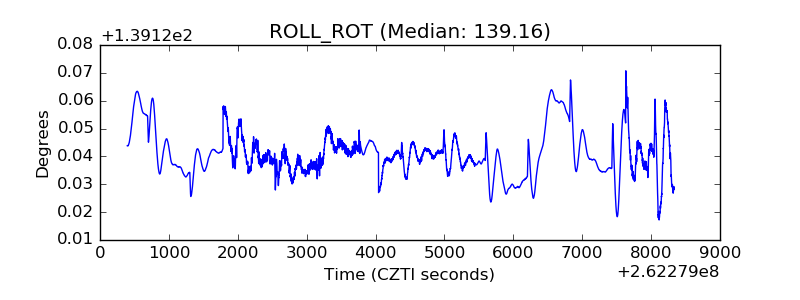 |
| _Roll_DEC | 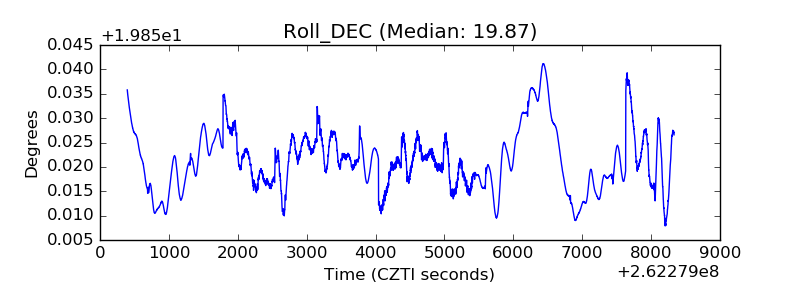 |
| _Roll_RA | 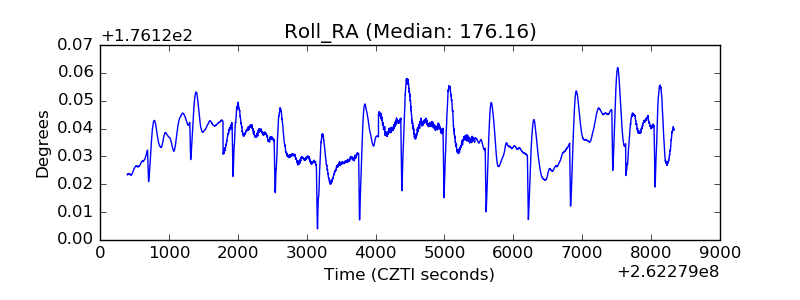 |
| Veto Counter | 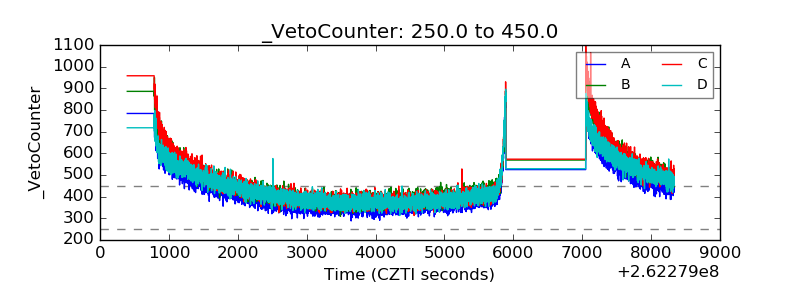 |