| Param | Original file | Final file |
|---|---|---|
| Filename | modeM0/AS1A04_010T02_9000002048_13908cztM0_level2.evt | modeM0/AS1A04_010T02_9000002048_13908cztM0_level2_quad_clean.evt |
| Size (bytes) | 608,624,640 | 81,835,200 |
| Size | 580.4 MB | 78.0 MB |
| Events in quadrant A | 2,969,348 | 589,563 |
| Events in quadrant B | 2,996,545 | 596,187 |
| Events in quadrant C | 2,983,080 | 589,000 |
| Events in quadrant D | 9,083,067 | 289,884 |
| Mode M0 | |||
|---|---|---|---|
| Quadrant | BADHDUFLAG | Total packets | Discarded packets |
| A | 0 | 12642 | 2 |
| B | 0 | 12770 | 2 |
| C | 0 | 12678 | 2 |
| D | 0 | 31019 | 2 |
| Mode SS | |||
|---|---|---|---|
| Quadrant | BADHDUFLAG | Total packets | Discarded packets |
| A | 0 | 120 | 0 |
| B | 0 | 120 | 0 |
| C | 0 | 120 | 0 |
| D | 0 | 120 | 0 |
| Mode M9 | |||
|---|---|---|---|
| Quadrant | BADHDUFLAG | Total packets | Discarded packets |
| A | 0 | 16 | 0 |
| B | 0 | 16 | 0 |
| C | 0 | 16 | 0 |
| D | 0 | 17 | 0 |
| Quadrant | Total seconds | Saturated seconds | Saturation percentage |
|---|---|---|---|
| A | 5902 | 37 | 0.626906% |
| B | 5902 | 57 | 0.965774% |
| C | 5902 | 32 | 0.542189% |
| D | 5902 | 2639 | 44.713656% |
Noise dominated data is calculated using 1-second bins in cleaned event files. If a bin has >2000 counts, and if more than 50% of those come from <1% of pixels, then it is considered to be noise-dominated and hence unusable.
| Quadrant | # 1 sec bins | Bins with >0 counts | Bins with >2000 counts | High rate bins dominated by noise | Noise dominated (total time) | Noise dominated (detector-on time) | Marked lightcurve |
|---|---|---|---|---|---|---|---|
| A | 7158 | 5904 | 0 | 0 | 0.00% | 0.00% |  |
| B | 7158 | 5904 | 1 | 1 | 0.01% | 0.02% | 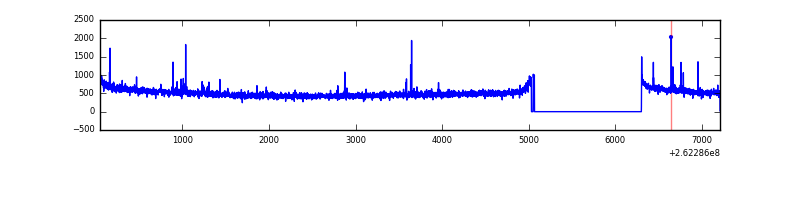 |
| C | 7158 | 5903 | 0 | 0 | 0.00% | 0.00% | 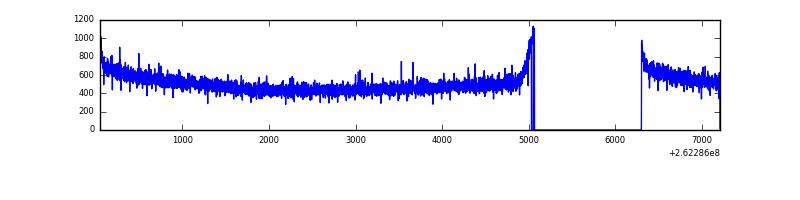 |
| D | 7158 | 5904 | 2326 | 2326 | 32.50% | 39.40% |  |
Top three noisy pixels from each quadrant. If the there are fewer than three noisy pixels in the level2.evt file, extra rows are filled as -1
| Pixel properties | Quadrant properties | ||||||
|---|---|---|---|---|---|---|---|
| Quadrant | DetID | PixID | Counts | Sigma | Mean | Median | Sigma |
| A | 9 | 143 | 34270 | 221.16 | 756 | 742 | 151.6 |
| A | 1 | 162 | 16877 | 106.43 | 756 | 742 | 151.6 |
| A | 0 | 226 | 6776 | 39.8 | 756 | 742 | 151.6 |
| B | 0 | 189 | 22762 | 154.67 | 751 | 734 | 142.4 |
| B | 4 | 173 | 20051 | 135.64 | 751 | 734 | 142.4 |
| B | 12 | 111 | 16209 | 108.66 | 751 | 734 | 142.4 |
| C | 3 | 233 | 97070 | 566.77 | 740 | 745 | 170.0 |
| C | 13 | 61 | 5248 | 26.5 | 740 | 745 | 170.0 |
| C | 14 | 220 | 1822 | 6.34 | 740 | 745 | 170.0 |
| D | 13 | 122 | 6975795 | 59388.56 | 491 | 480 | 117.5 |
| D | 1 | 52 | 129837 | 1101.36 | 491 | 480 | 117.5 |
| D | 13 | 189 | 45034 | 379.34 | 491 | 480 | 117.5 |
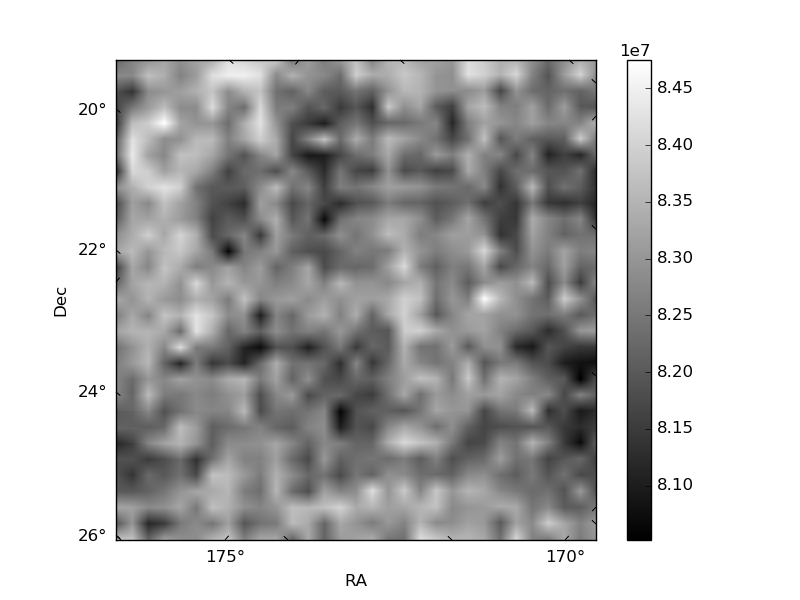
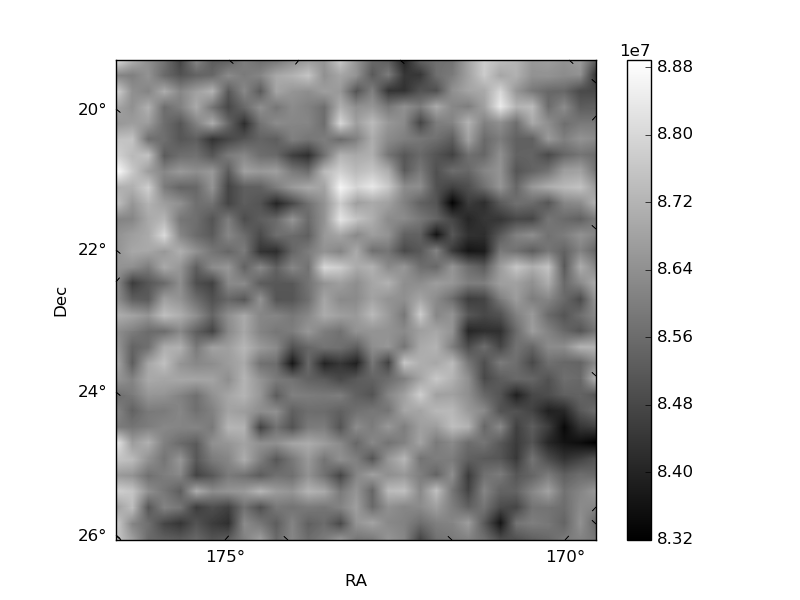
Histogram calculated using DETX and DETY for each event in the final _common_clean file
| Quadrant A | 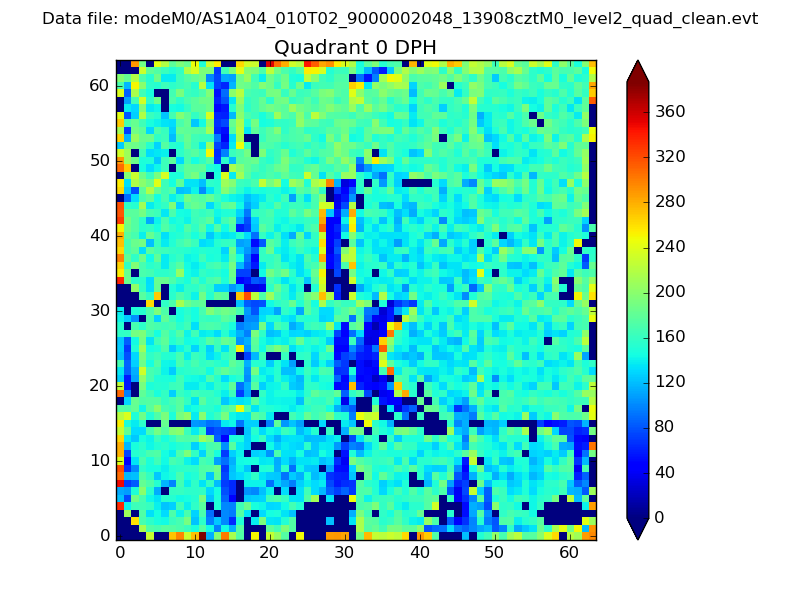 |
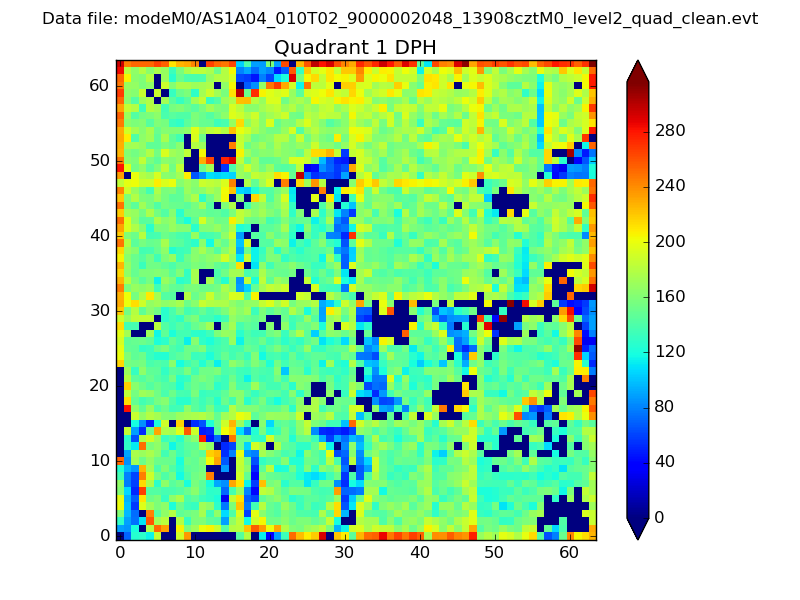 |
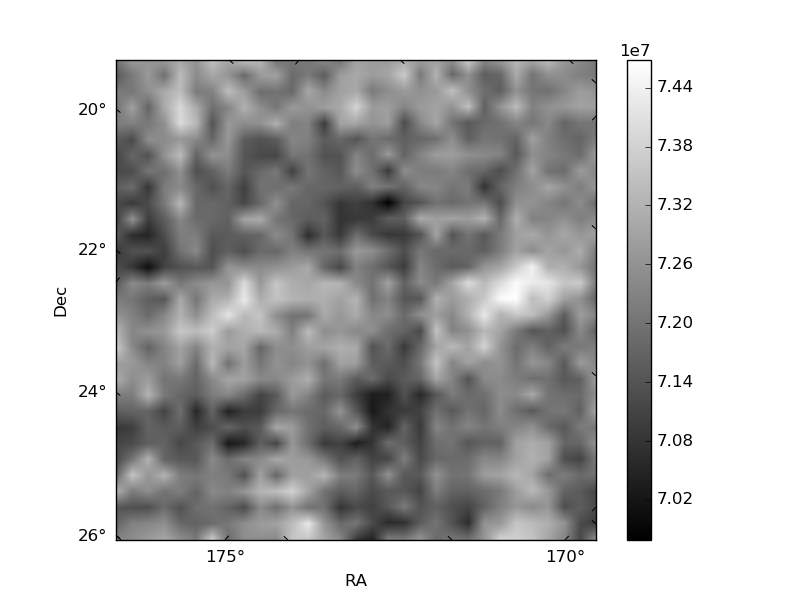
Quadrant B |
|---|---|---|---|
| Quadrant D |  |
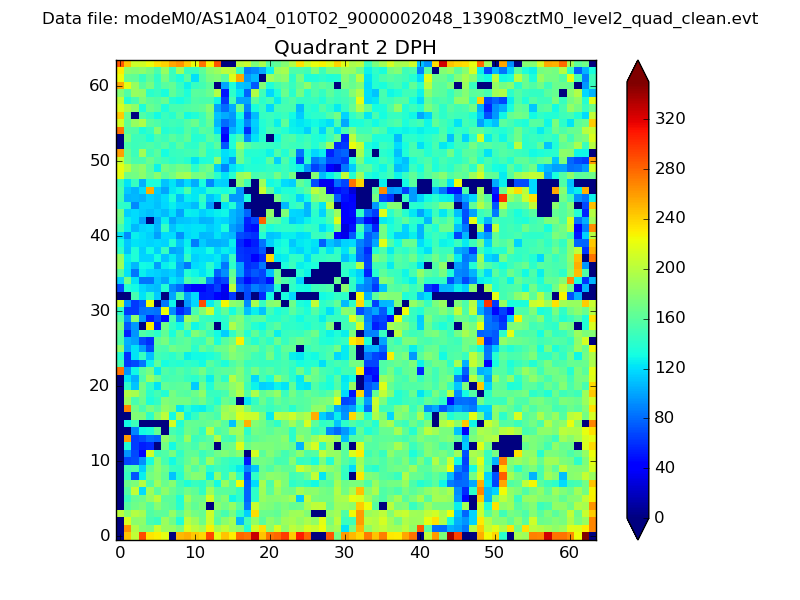 |
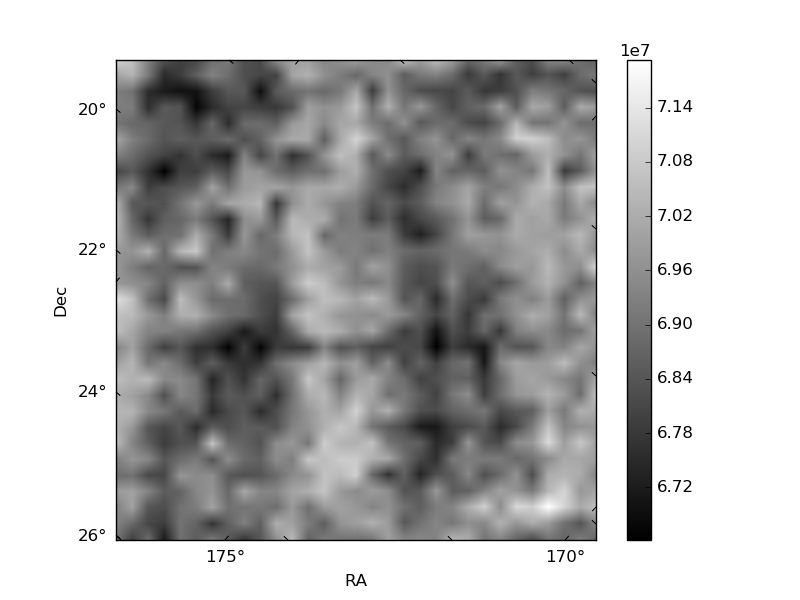
Quadrant C |
| Plot type | Count rate plots | Images |
|---|---|---|
| Comparison with Poisson distribution Blue bars denote a histogram of data divided into 1 sec bins. Red curve is a Poisson curve with rate = median count rate of data. |
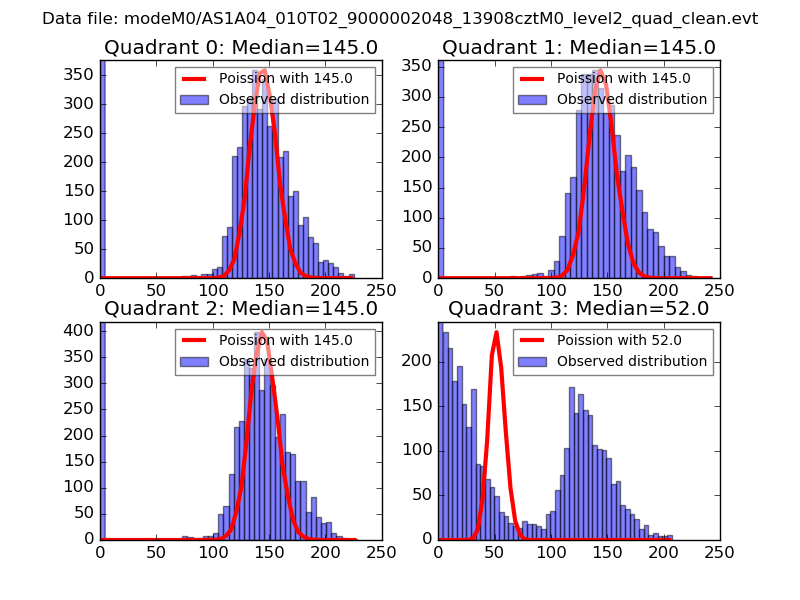 |
 |
| Quadrant-wise count rates Data is divided into 100 sec bins |
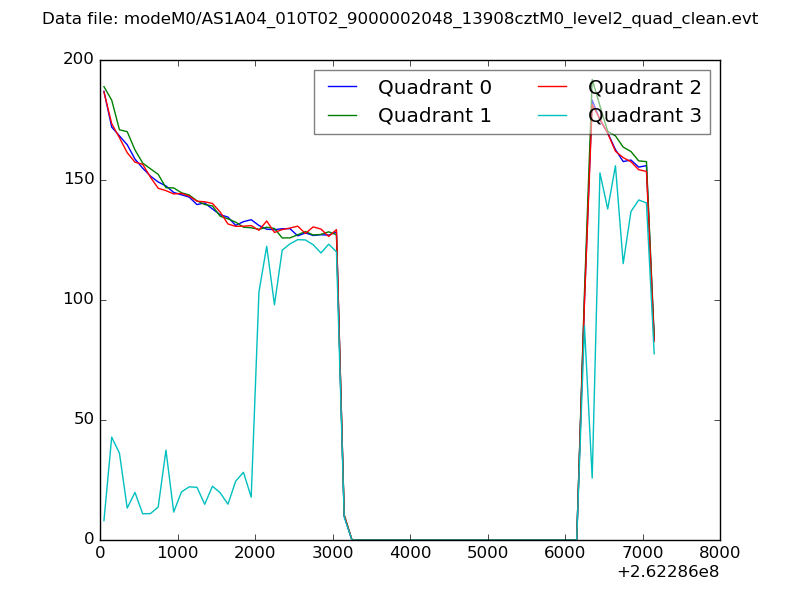 |
|
| Module-wise count rates for Quadrant A Data is divided into 100 sec bins |
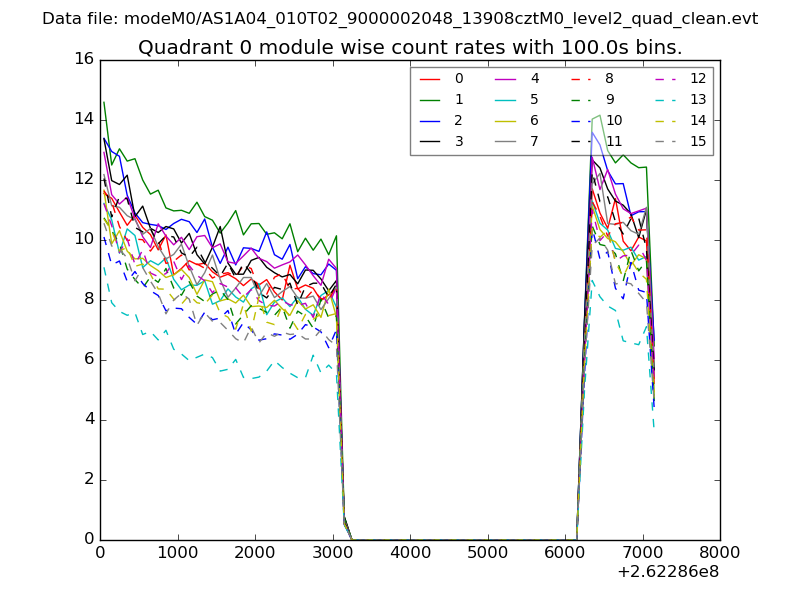 |
 |
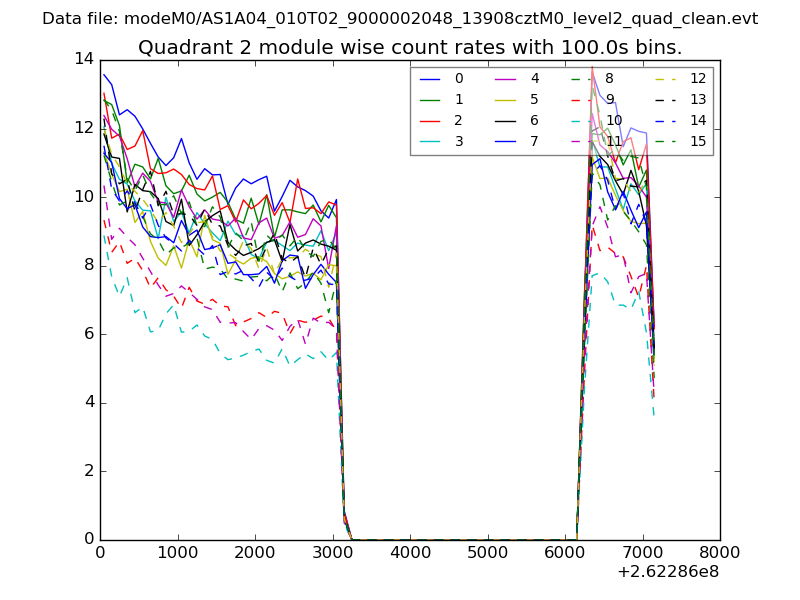
| Module-wise count rates for Quadrant B Data is divided into 100 sec bins |
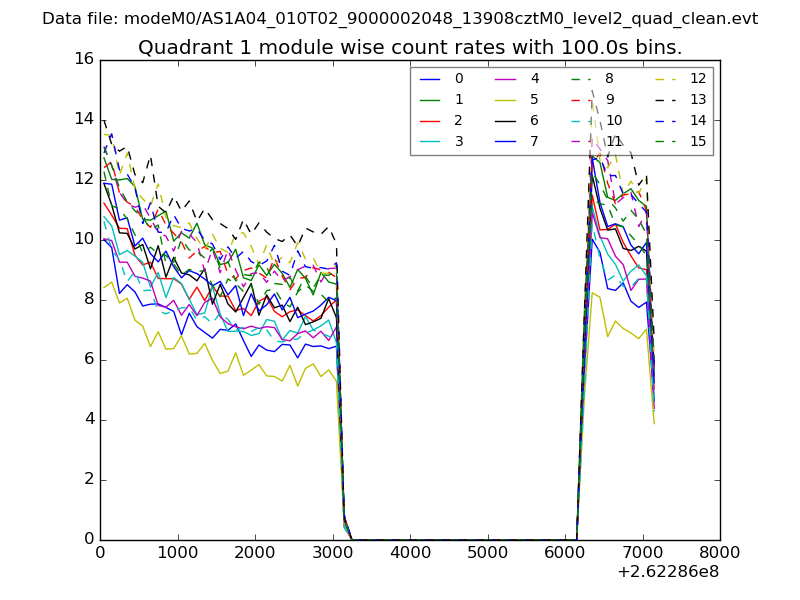 |
 |
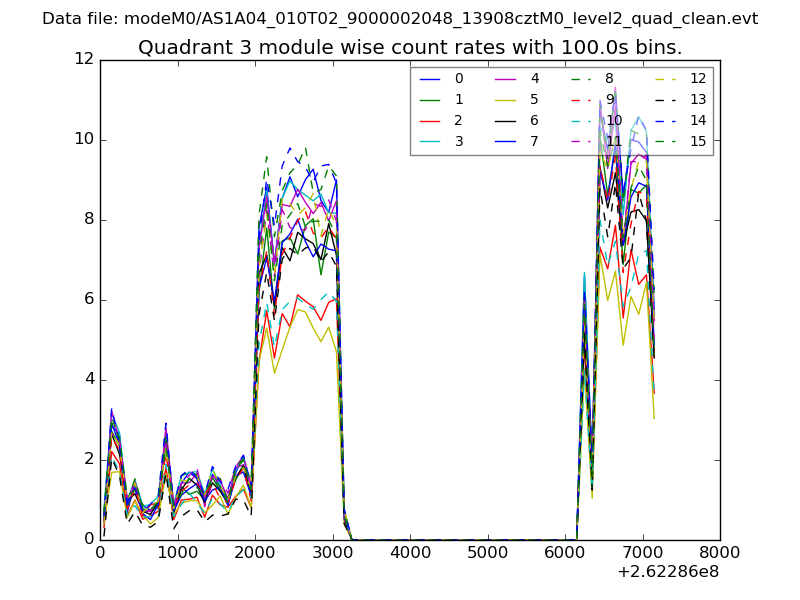
| Module-wise count rates for Quadrant C Data is divided into 100 sec bins |
 |
 |
| Module-wise count rates for Quadrant D Data is divided into 100 sec bins |
 |
 |
| Parameter | Plot |
|---|---|
| CZT HV Monitor | 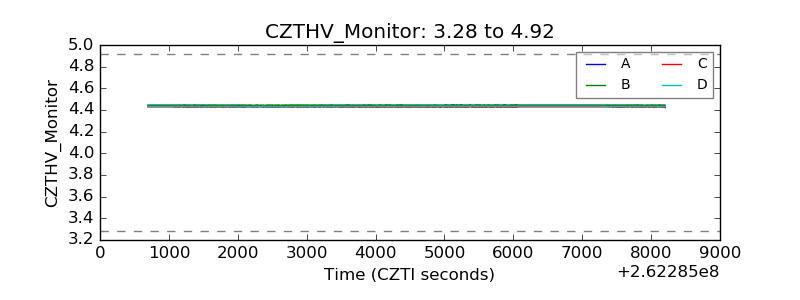 |
| D_VDD | 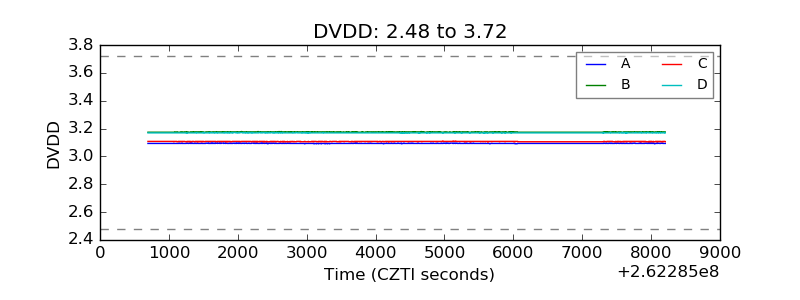 |
| Temperature 1 | 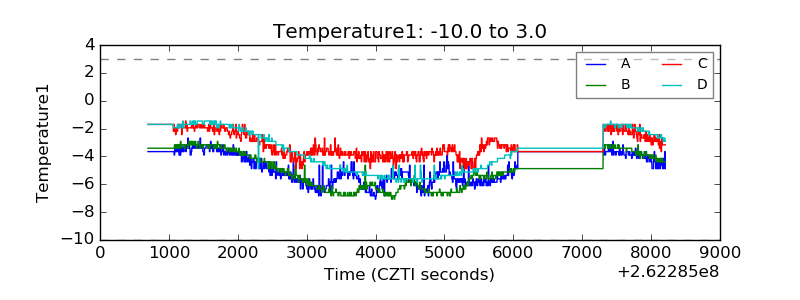 |
| Veto HV Monitor | 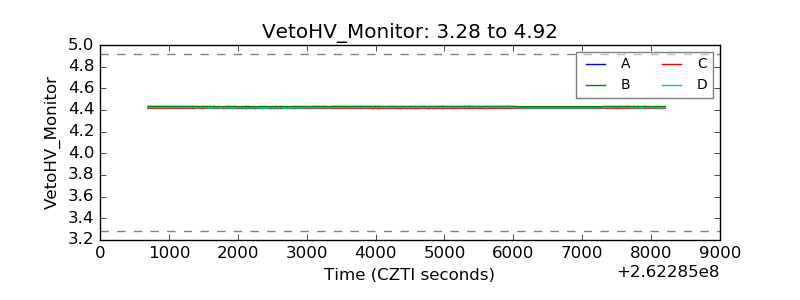 |
| Veto LLD | 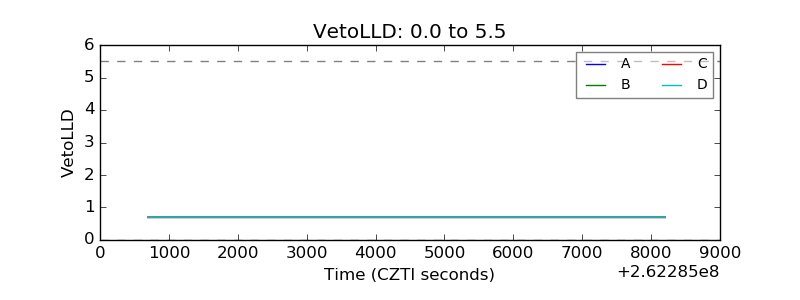 |
| Alpha Counter | 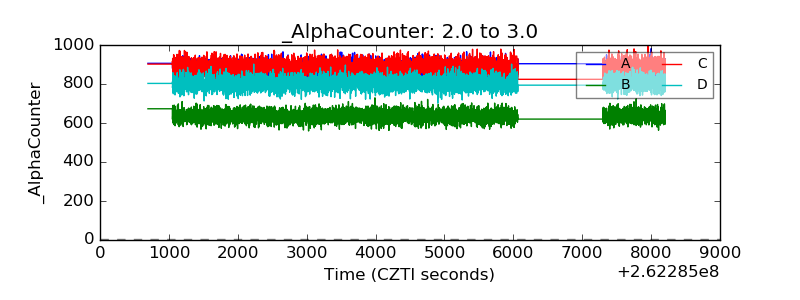 |
| _CPM_Rate | 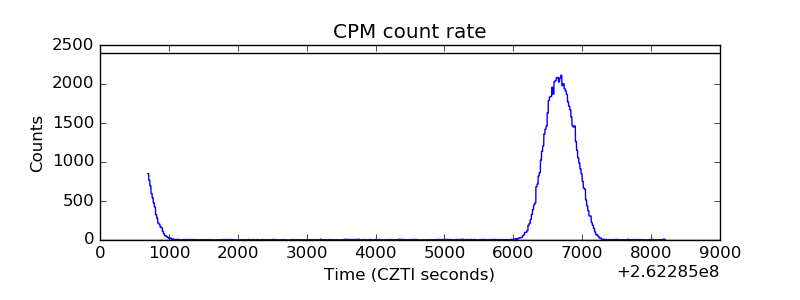 |
| CZT Counter | 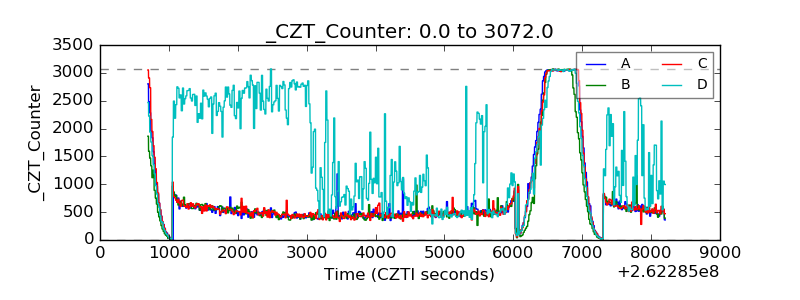 |
| +2.5 Volts monitor |  |
| +5 Volts monitor |  |
| _ROLL_ROT | 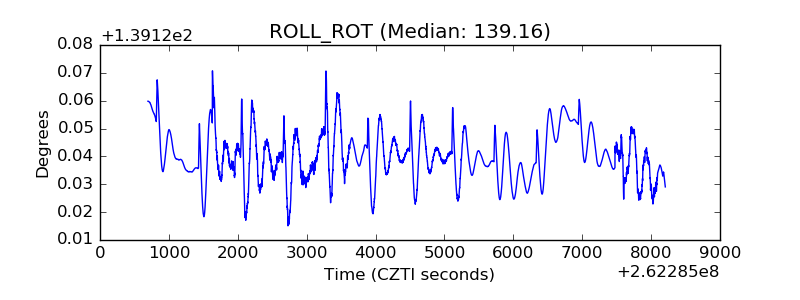 |
| _Roll_DEC | 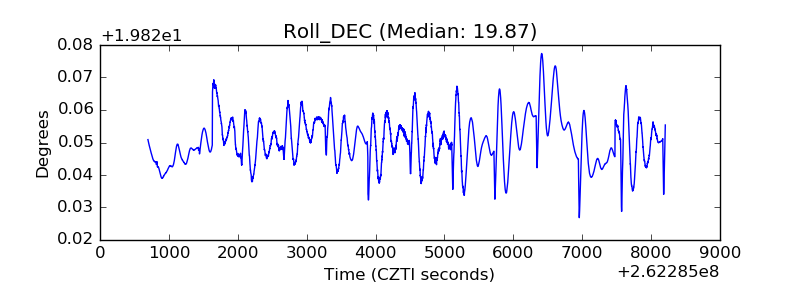 |
| _Roll_RA | 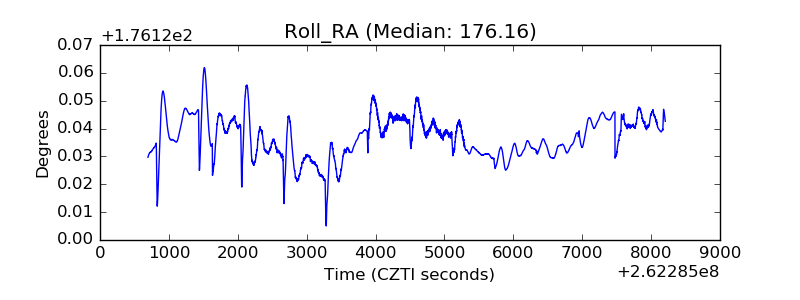 |
| Veto Counter | 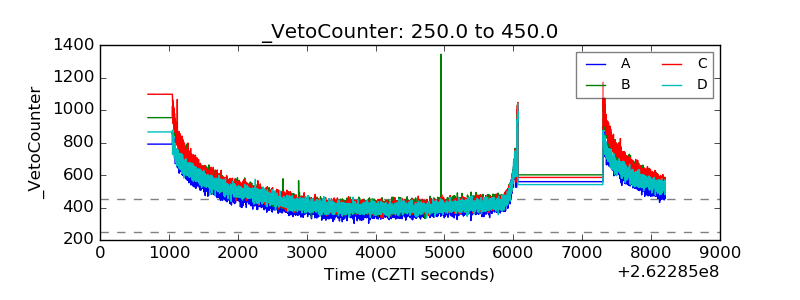 |