| Param | Original file | Final file |
|---|---|---|
| Filename | modeM0/AS1A04_010T02_9000002048_13909cztM0_level2.evt | modeM0/AS1A04_010T02_9000002048_13909cztM0_level2_quad_clean.evt |
| Size (bytes) | 92,658,240 | 21,202,560 |
| Size | 88.4 MB | 20.2 MB |
| Events in quadrant A | 519,131 | 149,963 |
| Events in quadrant B | 535,206 | 153,891 |
| Events in quadrant C | 526,150 | 149,519 |
| Events in quadrant D | 1,161,065 | 117,382 |
| Mode M0 | |||
|---|---|---|---|
| Quadrant | BADHDUFLAG | Total packets | Discarded packets |
| A | 0 | 2102 | 1 |
| B | 0 | 2189 | 1 |
| C | 0 | 2134 | 1 |
| D | 0 | 4065 | 1 |
| Mode SS | |||
|---|---|---|---|
| Quadrant | BADHDUFLAG | Total packets | Discarded packets |
| A | 0 | 18 | 0 |
| B | 0 | 18 | 0 |
| C | 0 | 18 | 0 |
| D | 0 | 18 | 0 |
| Mode M9 | |||
|---|---|---|---|
| Quadrant | BADHDUFLAG | Total packets | Discarded packets |
| A | 0 | 1 | 0 |
| B | 0 | 1 | 0 |
| C | 0 | 1 | 0 |
| D | 0 | 2 | 0 |
| Quadrant | Total seconds | Saturated seconds | Saturation percentage |
|---|---|---|---|
| A | 907 | 1 | 0.110254% |
| B | 907 | 3 | 0.330761% |
| C | 907 | 1 | 0.110254% |
| D | 907 | 254 | 28.004410% |
Noise dominated data is calculated using 1-second bins in cleaned event files. If a bin has >2000 counts, and if more than 50% of those come from <1% of pixels, then it is considered to be noise-dominated and hence unusable.
| Quadrant | # 1 sec bins | Bins with >0 counts | Bins with >2000 counts | High rate bins dominated by noise | Noise dominated (total time) | Noise dominated (detector-on time) | Marked lightcurve |
|---|---|---|---|---|---|---|---|
| A | 908 | 908 | 0 | 0 | 0.00% | 0.00% | 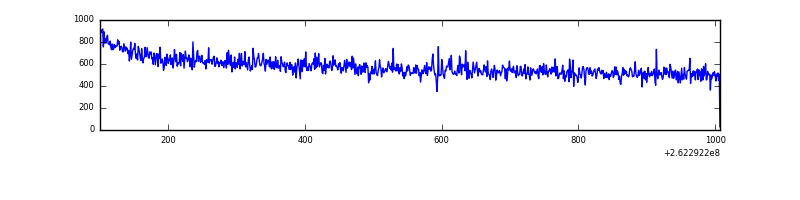 |
| B | 908 | 908 | 1 | 1 | 0.11% | 0.11% | 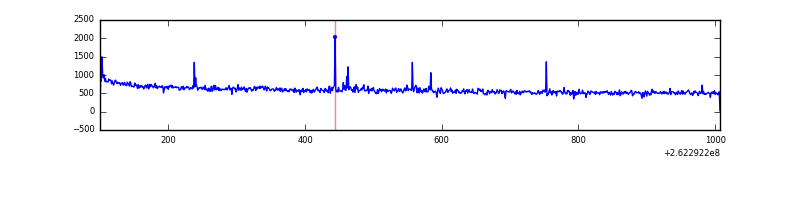 |
| C | 908 | 908 | 0 | 0 | 0.00% | 0.00% | 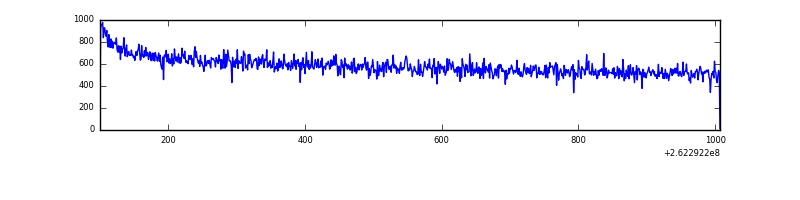 |
| D | 908 | 908 | 157 | 157 | 17.29% | 17.29% | 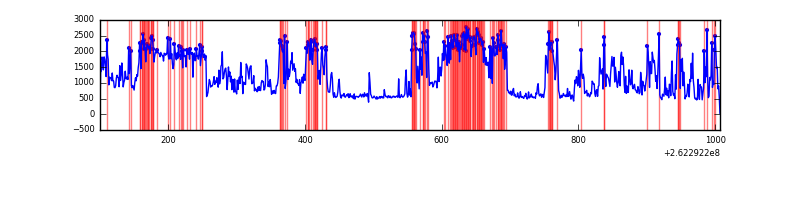 |
Top three noisy pixels from each quadrant. If the there are fewer than three noisy pixels in the level2.evt file, extra rows are filled as -1
| Pixel properties | Quadrant properties | ||||||
|---|---|---|---|---|---|---|---|
| Quadrant | DetID | PixID | Counts | Sigma | Mean | Median | Sigma |
| A | 1 | 162 | 2507 | 84.44 | 134 | 131 | 28.1 |
| A | 0 | 226 | 1177 | 37.17 | 134 | 131 | 28.1 |
| A | 12 | 194 | 1045 | 32.48 | 134 | 131 | 28.1 |
| B | 0 | 189 | 6248 | 229.6 | 133 | 131 | 26.6 |
| B | 3 | 209 | 3294 | 118.72 | 133 | 131 | 26.6 |
| B | 12 | 111 | 2666 | 95.15 | 133 | 131 | 26.6 |
| C | 3 | 233 | 13749 | 428.5 | 131 | 131 | 31.8 |
| C | 13 | 61 | 909 | 24.48 | 131 | 131 | 31.8 |
| C | 14 | 220 | 661 | 16.68 | 131 | 131 | 31.8 |
| D | 13 | 122 | 641610 | 23360.71 | 111 | 108 | 27.5 |
| D | 1 | 52 | 87508 | 3182.73 | 111 | 108 | 27.5 |
| D | 15 | 145 | 3383 | 119.26 | 111 | 108 | 27.5 |
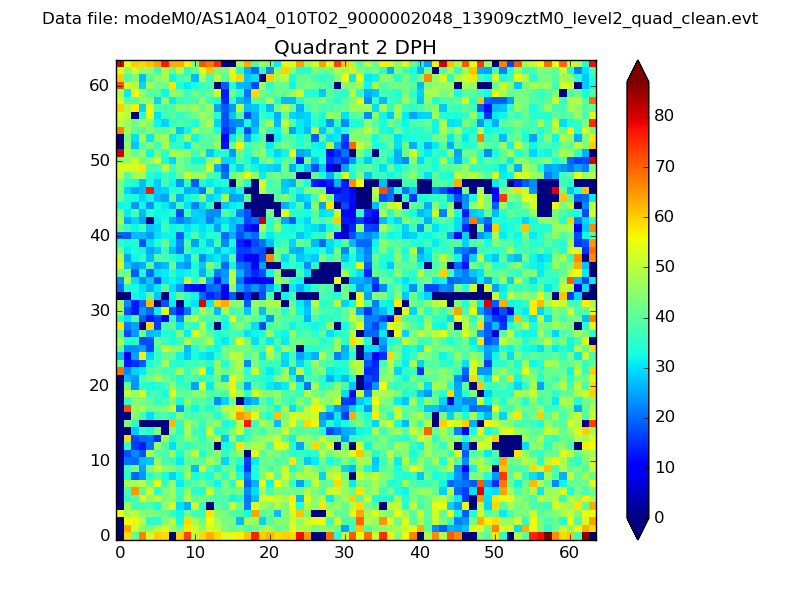
Histogram calculated using DETX and DETY for each event in the final _common_clean file
| Quadrant A | 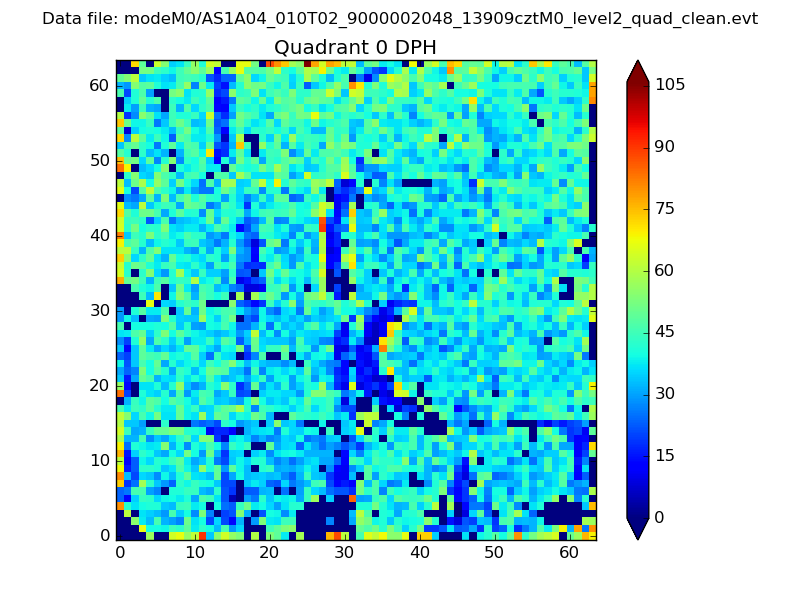 |
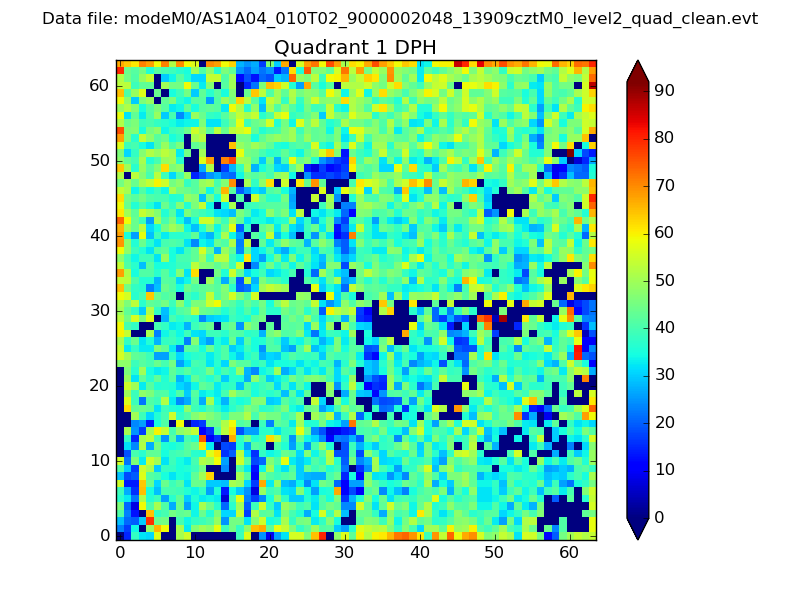 |
Quadrant B |
|---|---|---|---|
| Quadrant D | 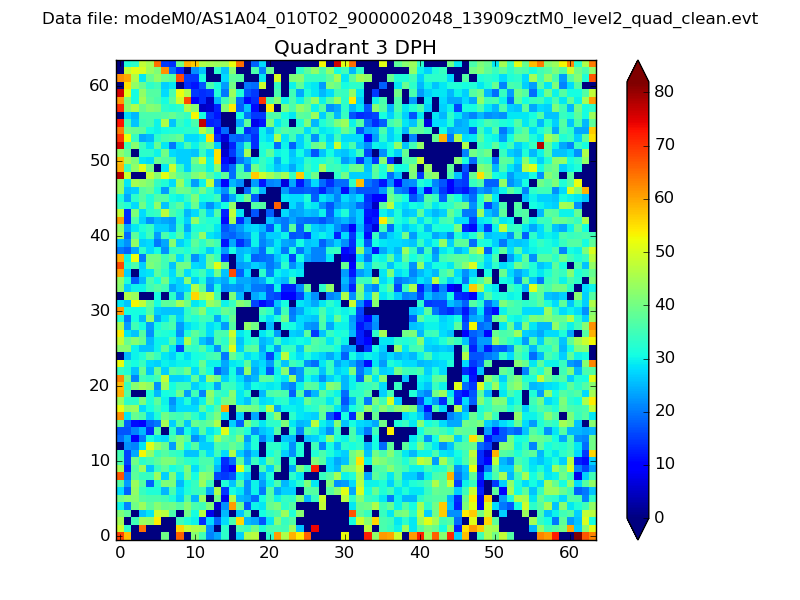 |
 |
Quadrant C |
| Plot type | Count rate plots | Images |
|---|---|---|
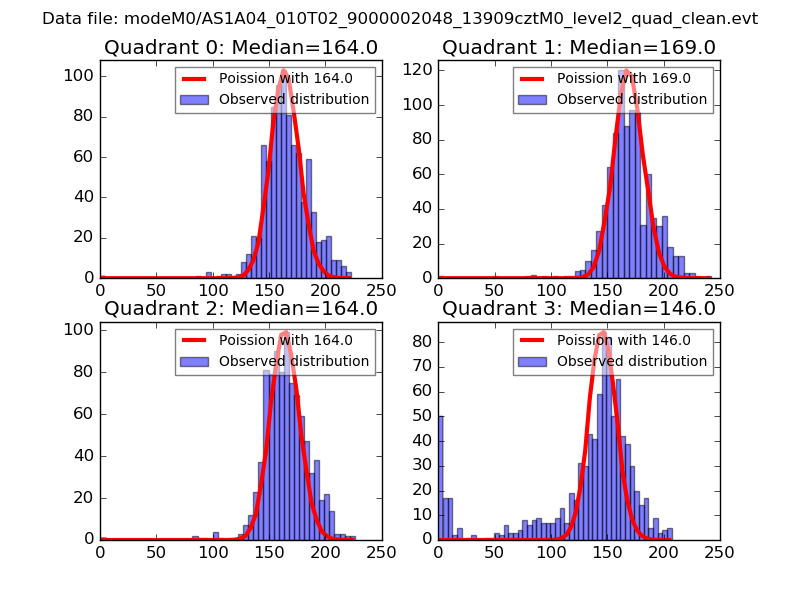
| Comparison with Poisson distribution Blue bars denote a histogram of data divided into 1 sec bins. Red curve is a Poisson curve with rate = median count rate of data. |
 |
 |
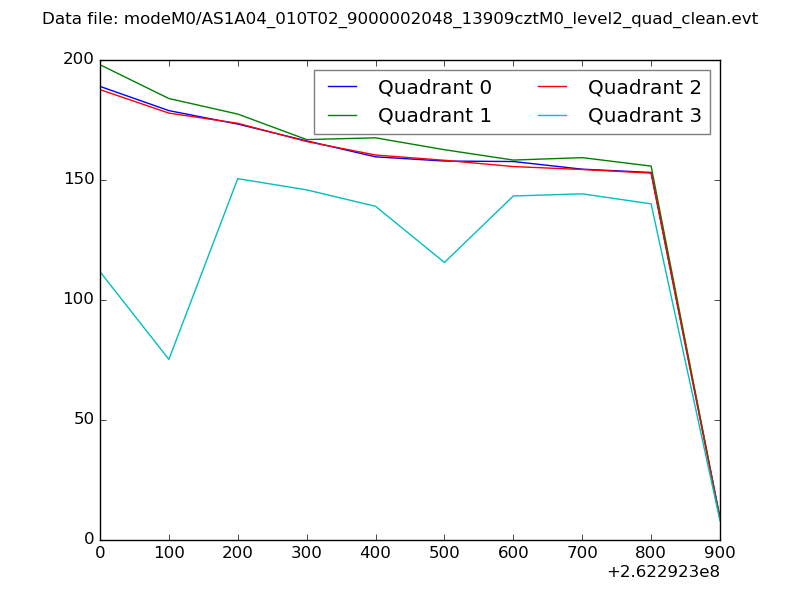
| Quadrant-wise count rates Data is divided into 100 sec bins |
 |
|
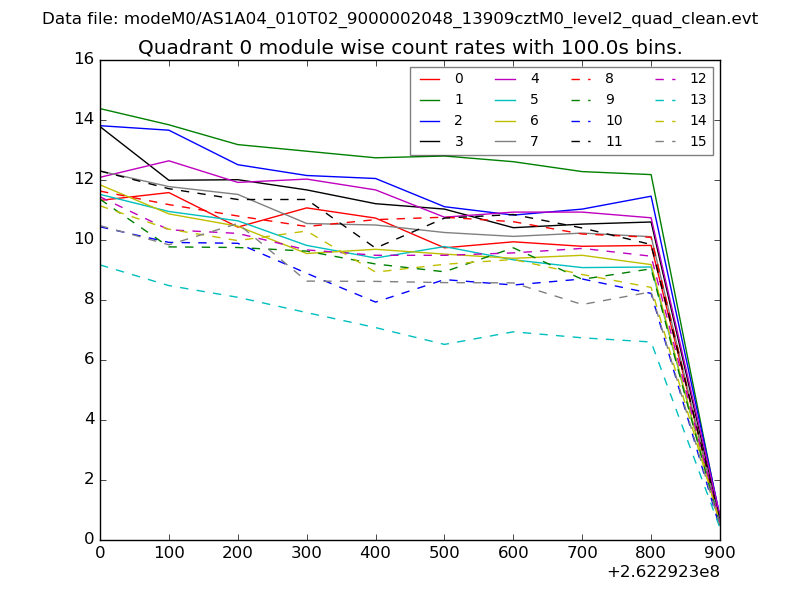
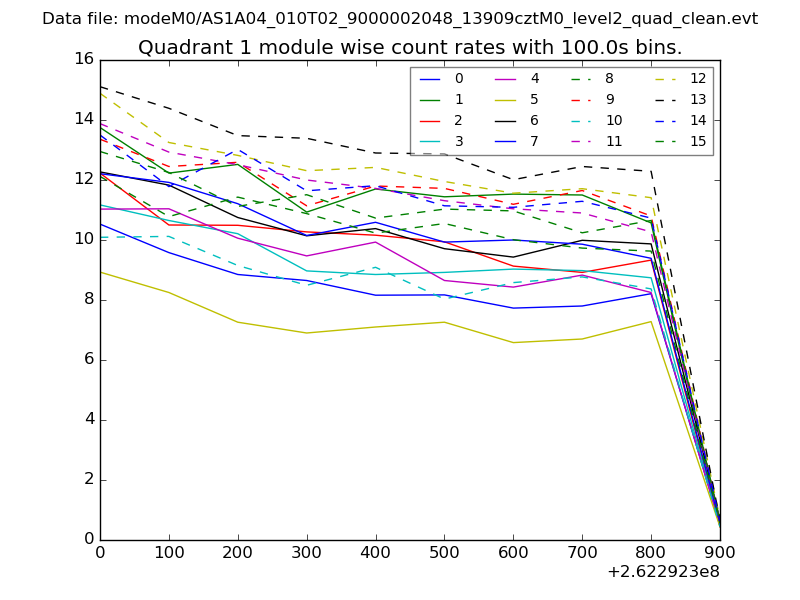
| Module-wise count rates for Quadrant A Data is divided into 100 sec bins |
 |
 |
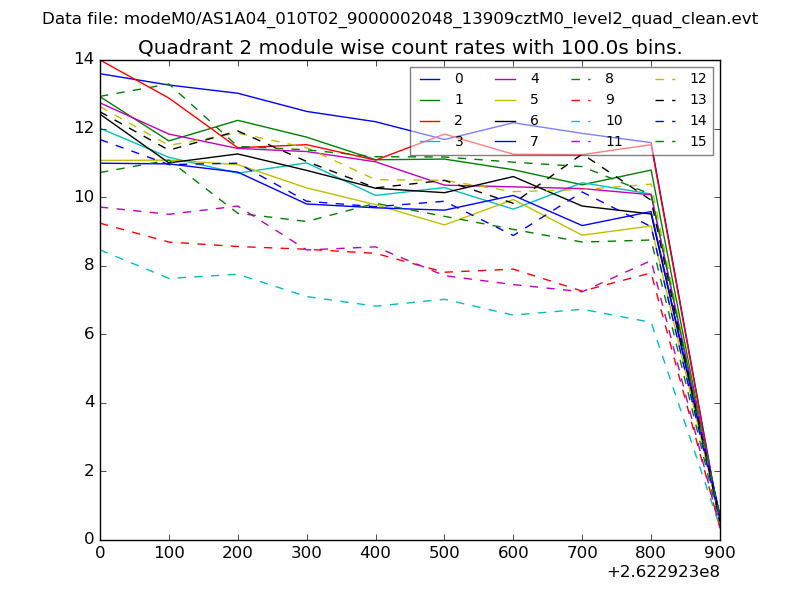
| Module-wise count rates for Quadrant B Data is divided into 100 sec bins |
 |
 |
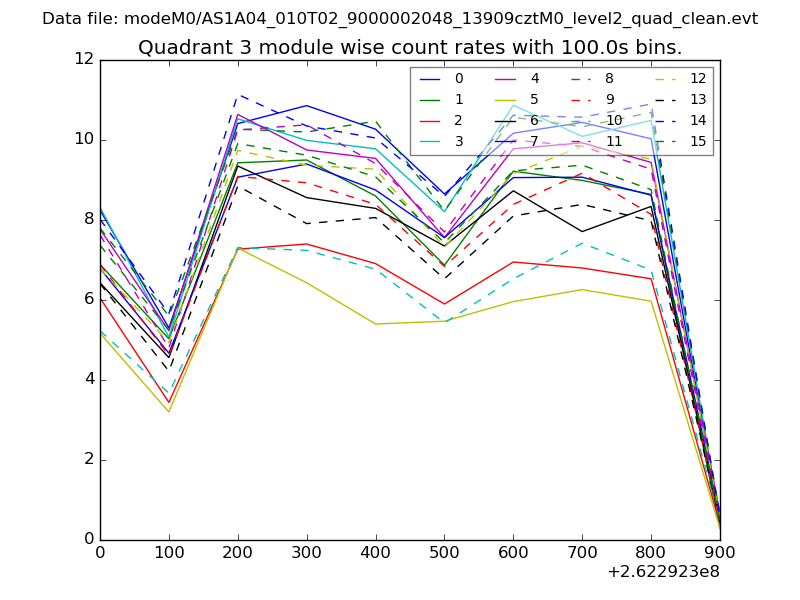
| Module-wise count rates for Quadrant C Data is divided into 100 sec bins |
 |
 |
| Module-wise count rates for Quadrant D Data is divided into 100 sec bins |
 |
 |
| Parameter | Plot |
|---|---|
| CZT HV Monitor | 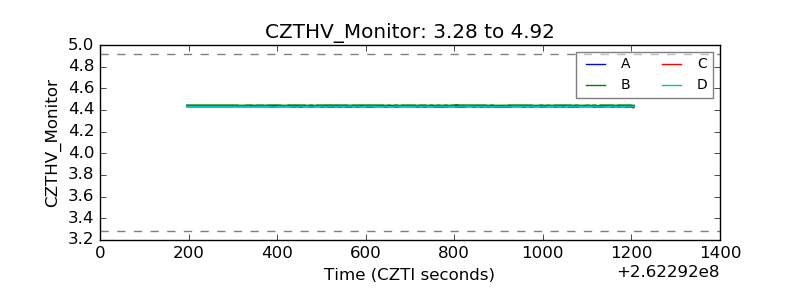 |
| D_VDD | 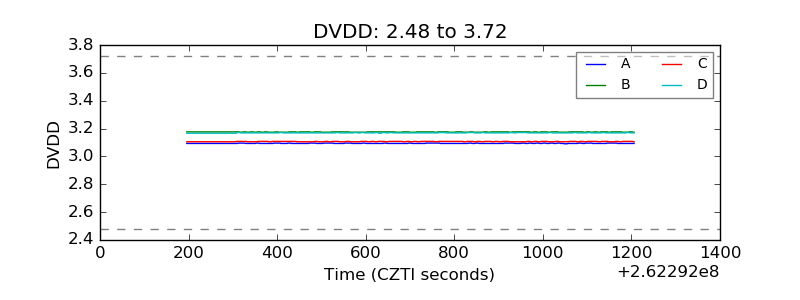 |
| Temperature 1 | 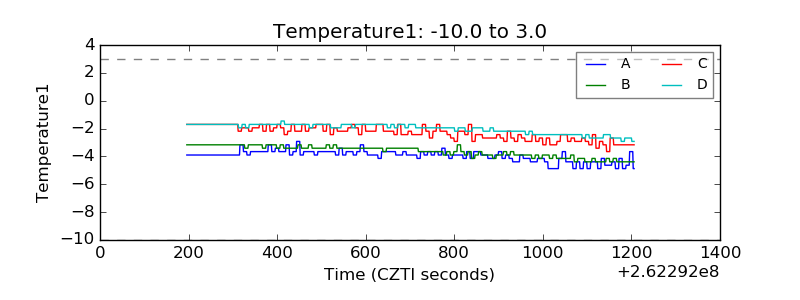 |
| Veto HV Monitor | 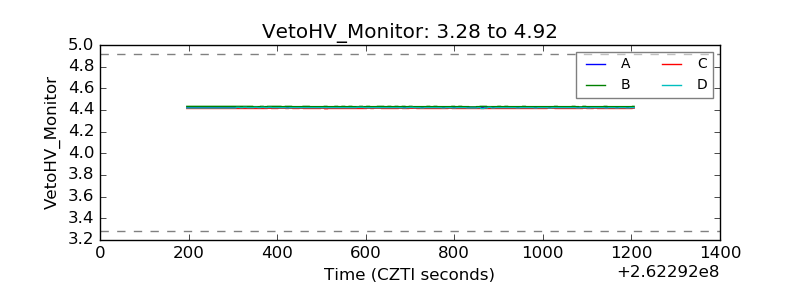 |
| Veto LLD | 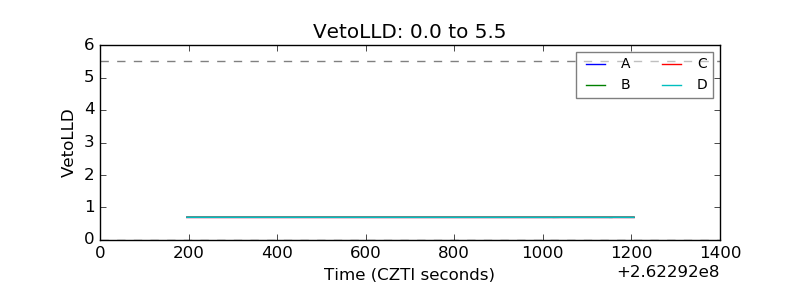 |
| Alpha Counter | 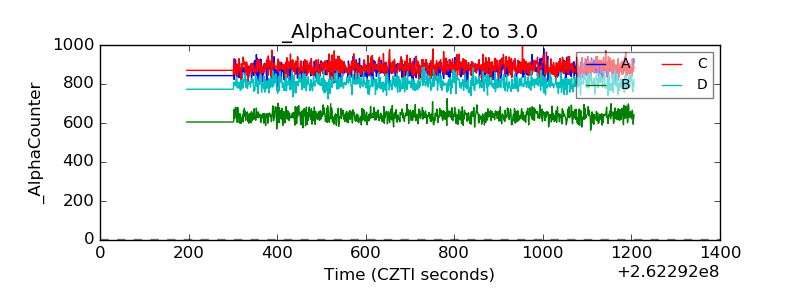 |
| _CPM_Rate | 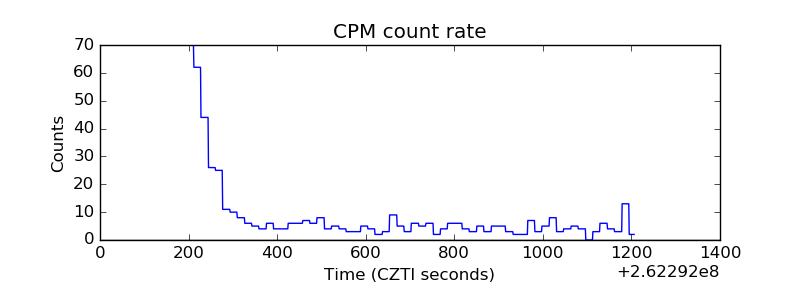 |
| CZT Counter | 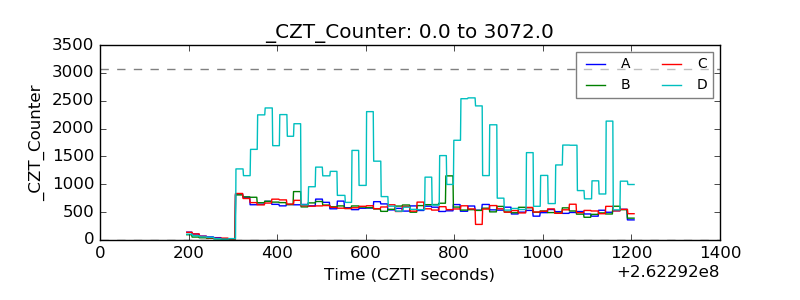 |
| +2.5 Volts monitor | 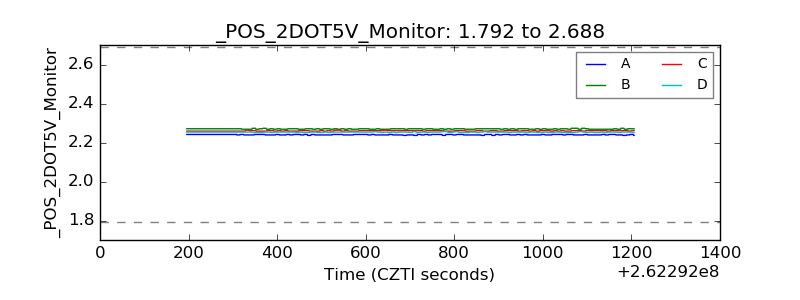 |
| +5 Volts monitor |  |
| _ROLL_ROT |  |
| _Roll_DEC | 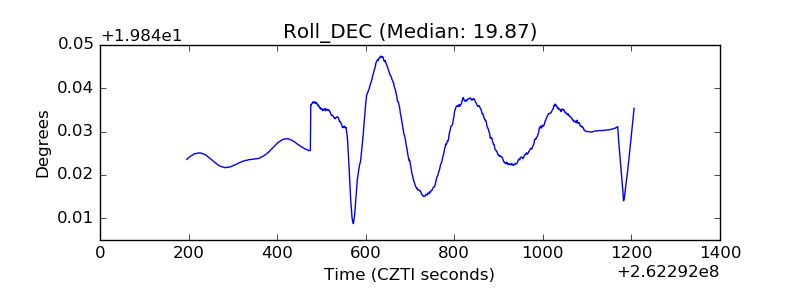 |
| _Roll_RA | 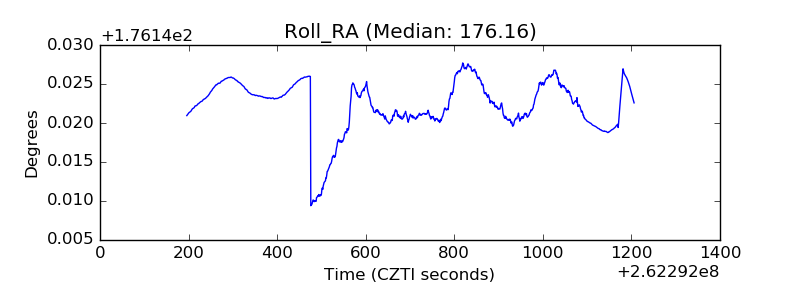 |
| Veto Counter | 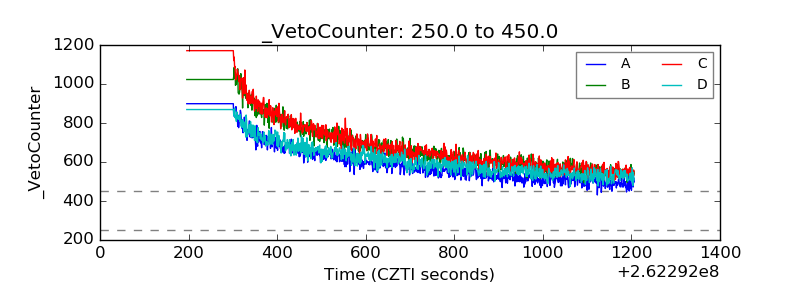 |