| Param | Original file | Final file |
|---|---|---|
| Filename | modeM0/AS1A04_012T02_9000002050cztM0_level2.fits | modeM0/AS1A04_012T02_9000002050cztM0_level2_quad_clean.evt |
| Size (bytes) | 442,143,360 | 377,138,880 |
| Size | 421.7 MB | 359.7 MB |
| Events in quadrant A | 2,675,908 | 2,131,031 |
| Events in quadrant B | 2,608,196 | 2,157,537 |
| Events in quadrant C | 2,670,106 | 2,066,556 |
| Events in quadrant D | 2,217,938 | 1,848,242 |
| Mode M9 | |||
|---|---|---|---|
| Quadrant | BADHDUFLAG | Total packets | Discarded packets |
| A | 0 | 62 | 0 |
| B | 0 | 62 | 0 |
| C | 0 | 62 | 0 |
| D | 0 | 62 | 0 |
| Mode SS | |||
|---|---|---|---|
| Quadrant | BADHDUFLAG | Total packets | Discarded packets |
| A | 0 | 948 | 0 |
| B | 0 | 948 | 0 |
| C | 0 | 948 | 0 |
| D | 0 | 948 | 0 |
| Mode M0 | |||
|---|---|---|---|
| Quadrant | BADHDUFLAG | Total packets | Discarded packets |
| A | 0 | 102763 | 0 |
| B | 0 | 98660 | 0 |
| C | 0 | 96958 | 0 |
| D | 0 | 139070 | 0 |
| Quadrant | Total seconds | Saturated seconds | Saturation percentage |
|---|---|---|---|
| A | 46886 | 953 | 2.032590% |
| B | 46886 | 743 | 1.584695% |
| C | 46886 | 410 | 0.874461% |
| D | 46886 | 2816 | 6.006057% |
Noise dominated data is calculated using 1-second bins in cleaned event files. If a bin has >2000 counts, and if more than 50% of those come from <1% of pixels, then it is considered to be noise-dominated and hence unusable.
| Quadrant | # 1 sec bins | Bins with >0 counts | Bins with >2000 counts | High rate bins dominated by noise | Noise dominated (total time) | Noise dominated (detector-on time) | Marked lightcurve |
|---|---|---|---|---|---|---|---|
| A | 52871 | 46880 | 0 | 0 | 0.00% | 0.00% |  |
| B | 52871 | 46880 | 0 | 0 | 0.00% | 0.00% |  |
| C | 52871 | 46881 | 0 | 0 | 0.00% | 0.00% |  |
| D | 52871 | 46867 | 0 | 0 | 0.00% | 0.00% |  |
Top three noisy pixels from each quadrant. If the there are fewer than three noisy pixels in the level2.evt file, extra rows are filled as -1
| Pixel properties | Quadrant properties | ||||||
|---|---|---|---|---|---|---|---|
| Quadrant | DetID | PixID | Counts | Sigma | Mean | Median | Sigma |
| A | 0 | 29 | 2603 | 11.08 | 695 | 647 | 176.6 |
| A | 7 | 110 | 2247 | 9.06 | 695 | 647 | 176.6 |
| A | 9 | 19 | 1971 | 7.5 | 695 | 647 | 176.6 |
| B | 2 | 9 | 2204 | 11.11 | 685 | 650 | 139.8 |
| B | 3 | 17 | 1806 | 8.27 | 685 | 650 | 139.8 |
| B | 5 | 225 | 1758 | 7.92 | 685 | 650 | 139.8 |
| C | 1 | 81 | 1942 | 6.95 | 703 | 652 | 185.6 |
| C | 1 | 80 | 1929 | 6.88 | 703 | 652 | 185.6 |
| C | 12 | 241 | 1888 | 6.66 | 703 | 652 | 185.6 |
| D | 7 | 5 | 1640 | 6.24 | 633 | 575 | 170.7 |
| D | 6 | 231 | 1587 | 5.93 | 633 | 575 | 170.7 |
| D | 7 | 3 | 1574 | 5.85 | 633 | 575 | 170.7 |
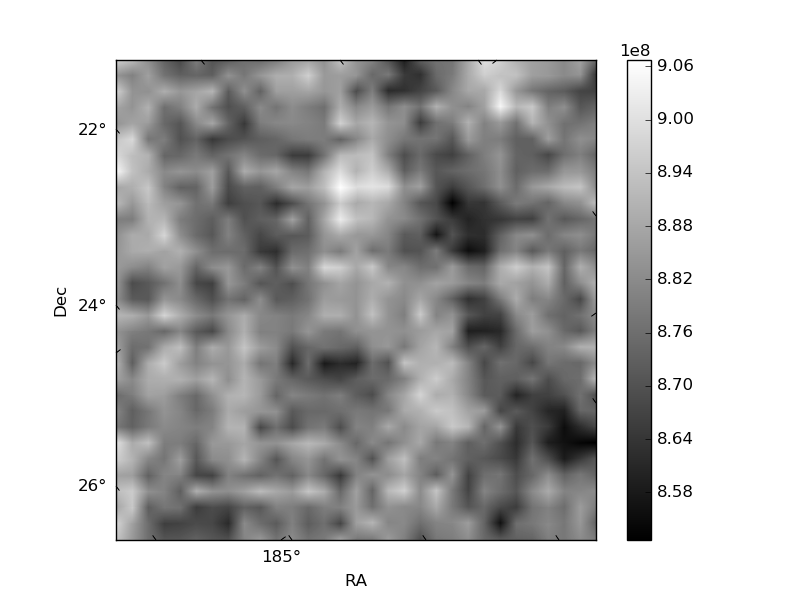
Histogram calculated using DETX and DETY for each event in the final _common_clean file
| Quadrant A |  |
 |
Quadrant B |
|---|---|---|---|
| Quadrant D |  |
 |
Quadrant C |
| Plot type | Count rate plots | Images |
|---|---|---|
| Comparison with Poisson distribution Blue bars denote a histogram of data divided into 1 sec bins. Red curve is a Poisson curve with rate = median count rate of data. |
 |
 |
| Quadrant-wise count rates Data is divided into 100 sec bins |
 |
|
| Module-wise count rates for Quadrant A Data is divided into 100 sec bins |
 |
 |
| Module-wise count rates for Quadrant B Data is divided into 100 sec bins |
 |
 |
| Module-wise count rates for Quadrant C Data is divided into 100 sec bins |
 |
 |
| Module-wise count rates for Quadrant D Data is divided into 100 sec bins |
 |
 |
| Parameter | Plot |
|---|---|
| CZT HV Monitor |  |
| D_VDD |  |
| Temperature 1 |  |
| Veto HV Monitor |  |
| Veto LLD |  |
| Alpha Counter |  |
| _CPM_Rate |  |
| CZT Counter |  |
| +2.5 Volts monitor |  |
| +5 Volts monitor |  |
| _ROLL_ROT | 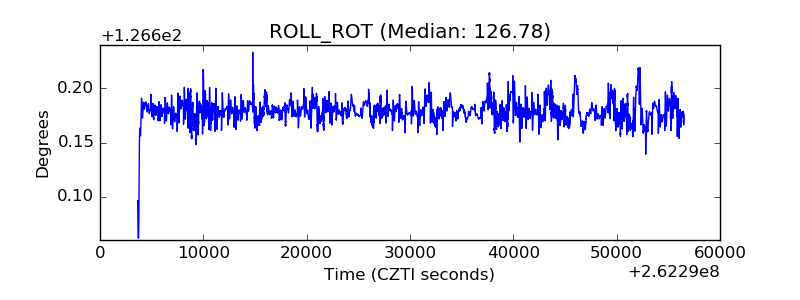 |
| _Roll_DEC |  |
| _Roll_RA |  |
| Veto Counter |  |