| Param | Original file | Final file |
|---|---|---|
| Filename | modeM0/AS1A04_012T02_9000002050_13910cztM0_level2.evt | modeM0/AS1A04_012T02_9000002050_13910cztM0_level2_quad_clean.evt |
| Size (bytes) | 493,833,600 | 87,880,320 |
| Size | 471.0 MB | 83.8 MB |
| Events in quadrant A | 3,051,708 | 564,662 |
| Events in quadrant B | 3,255,913 | 578,191 |
| Events in quadrant C | 3,057,041 | 570,985 |
| Events in quadrant D | 5,174,958 | 518,847 |
| Mode M9 | |||
|---|---|---|---|
| Quadrant | BADHDUFLAG | Total packets | Discarded packets |
| A | 0 | 20 | 0 |
| B | 0 | 20 | 0 |
| C | 0 | 20 | 0 |
| D | 0 | 21 | 0 |
| Mode SS | |||
|---|---|---|---|
| Quadrant | BADHDUFLAG | Total packets | Discarded packets |
| A | 0 | 124 | 0 |
| B | 0 | 124 | 0 |
| C | 0 | 124 | 0 |
| D | 0 | 124 | 0 |
| Mode M0 | |||
|---|---|---|---|
| Quadrant | BADHDUFLAG | Total packets | Discarded packets |
| A | 0 | 12982 | 3 |
| B | 0 | 13540 | 2 |
| C | 0 | 12907 | 2 |
| D | 0 | 19629 | 2 |
| Quadrant | Total seconds | Saturated seconds | Saturation percentage |
|---|---|---|---|
| A | 6138 | 22 | 0.358423% |
| B | 6138 | 53 | 0.863473% |
| C | 6138 | 8 | 0.130336% |
| D | 6138 | 377 | 6.142066% |
Noise dominated data is calculated using 1-second bins in cleaned event files. If a bin has >2000 counts, and if more than 50% of those come from <1% of pixels, then it is considered to be noise-dominated and hence unusable.
| Quadrant | # 1 sec bins | Bins with >0 counts | Bins with >2000 counts | High rate bins dominated by noise | Noise dominated (total time) | Noise dominated (detector-on time) | Marked lightcurve |
|---|---|---|---|---|---|---|---|
| A | 7489 | 6140 | 4 | 4 | 0.05% | 0.07% | 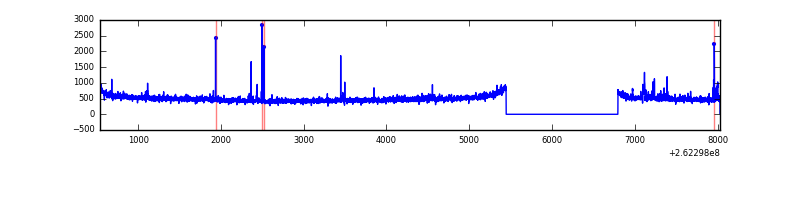 |
| B | 7489 | 6140 | 34 | 34 | 0.45% | 0.55% | 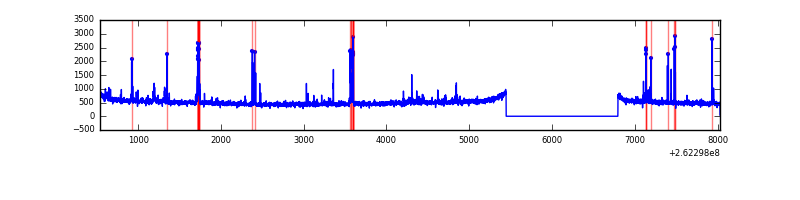 |
| C | 7489 | 6140 | 0 | 0 | 0.00% | 0.00% | 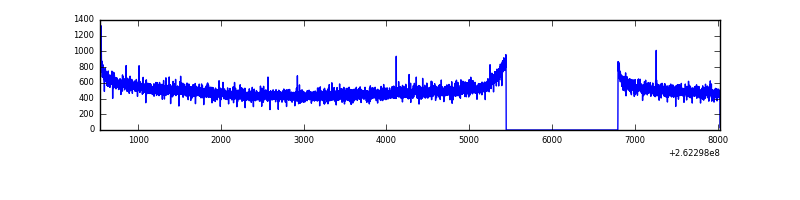 |
| D | 7489 | 6140 | 308 | 308 | 4.11% | 5.02% |  |
Top three noisy pixels from each quadrant. If the there are fewer than three noisy pixels in the level2.evt file, extra rows are filled as -1
| Pixel properties | Quadrant properties | ||||||
|---|---|---|---|---|---|---|---|
| Quadrant | DetID | PixID | Counts | Sigma | Mean | Median | Sigma |
| A | 9 | 143 | 62351 | 396.89 | 770 | 753 | 155.2 |
| A | 1 | 162 | 11912 | 71.9 | 770 | 753 | 155.2 |
| A | 8 | 15 | 10610 | 63.51 | 770 | 753 | 155.2 |
| B | 10 | 244 | 144407 | 996.83 | 771 | 754 | 144.1 |
| B | 4 | 80 | 36984 | 251.41 | 771 | 754 | 144.1 |
| B | 4 | 173 | 21841 | 146.33 | 771 | 754 | 144.1 |
| C | 3 | 233 | 107569 | 613.31 | 756 | 763 | 174.1 |
| C | 13 | 61 | 5413 | 26.7 | 756 | 763 | 174.1 |
| C | 5 | 193 | 2467 | 9.78 | 756 | 763 | 174.1 |
| D | 13 | 122 | 1684150 | 9808.61 | 727 | 711 | 171.6 |
| D | 1 | 52 | 514812 | 2995.43 | 727 | 711 | 171.6 |
| D | 8 | 195 | 108011 | 625.19 | 727 | 711 | 171.6 |
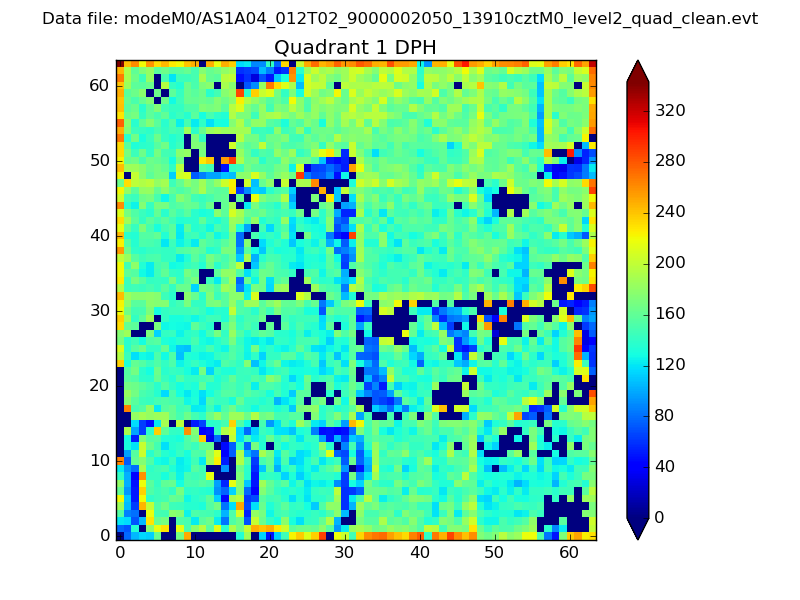
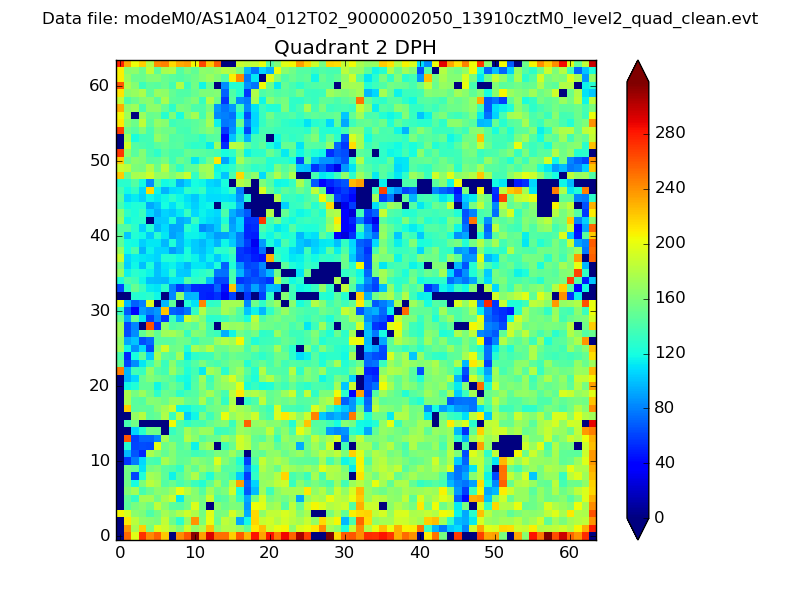
Histogram calculated using DETX and DETY for each event in the final _common_clean file
| Quadrant A | 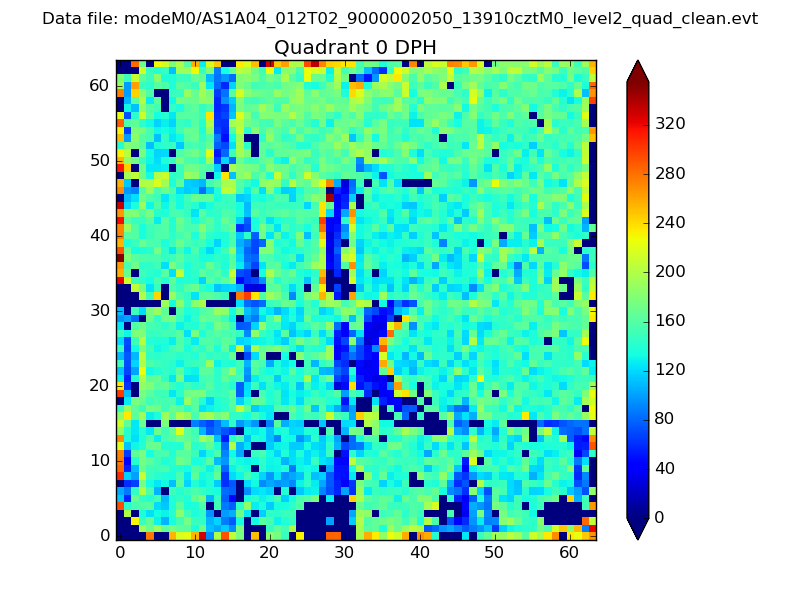 |
 |
Quadrant B |
|---|---|---|---|
| Quadrant D | 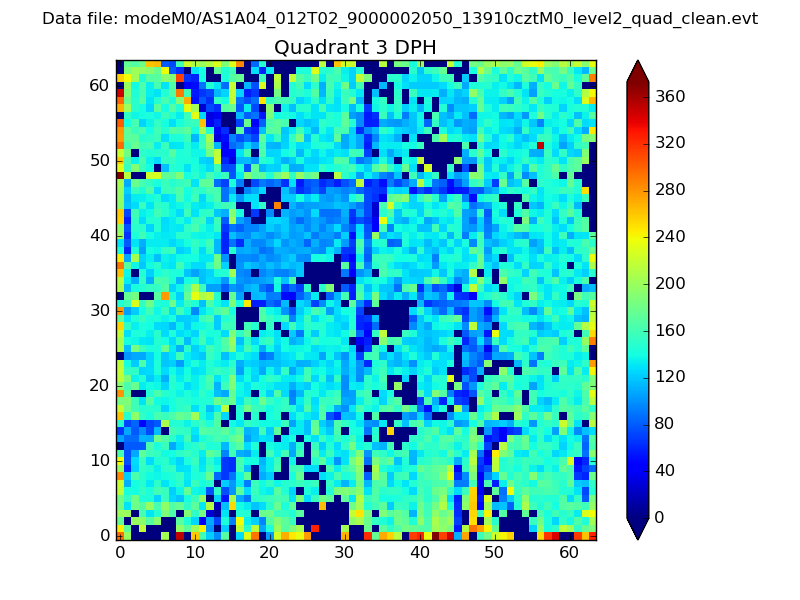 |
 |
Quadrant C |
| Plot type | Count rate plots | Images |
|---|---|---|
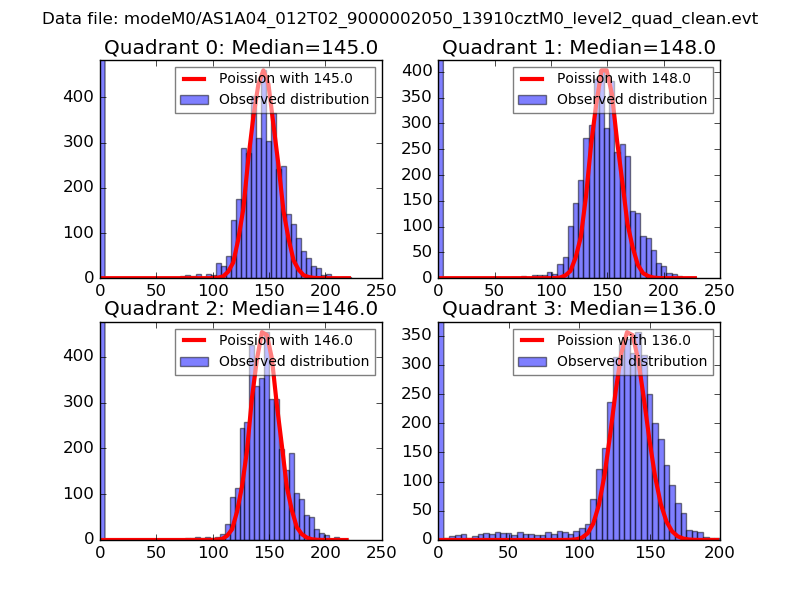
| Comparison with Poisson distribution Blue bars denote a histogram of data divided into 1 sec bins. Red curve is a Poisson curve with rate = median count rate of data. |
 |
 |
| Quadrant-wise count rates Data is divided into 100 sec bins |
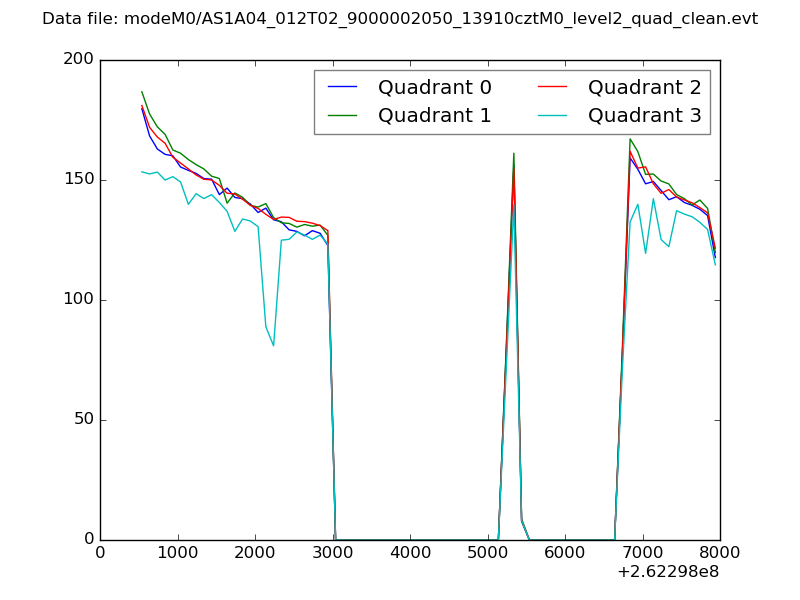 |
|
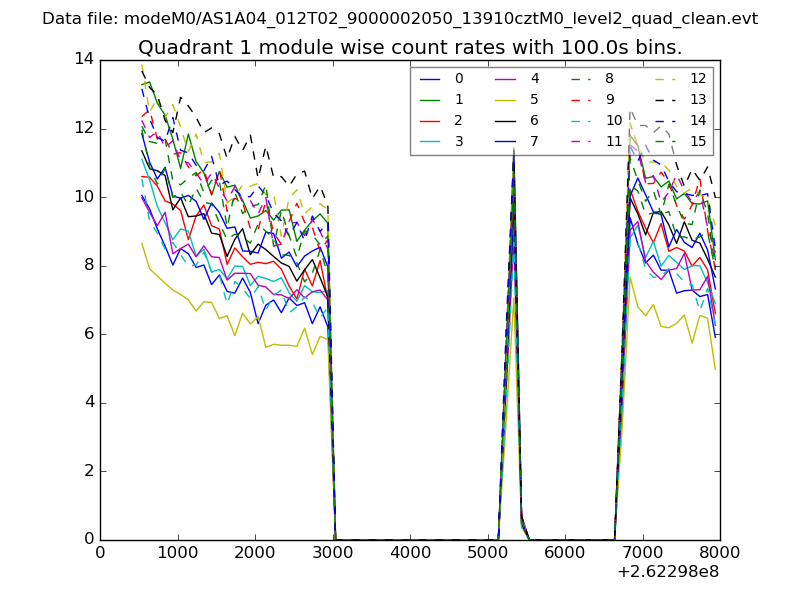
| Module-wise count rates for Quadrant A Data is divided into 100 sec bins |
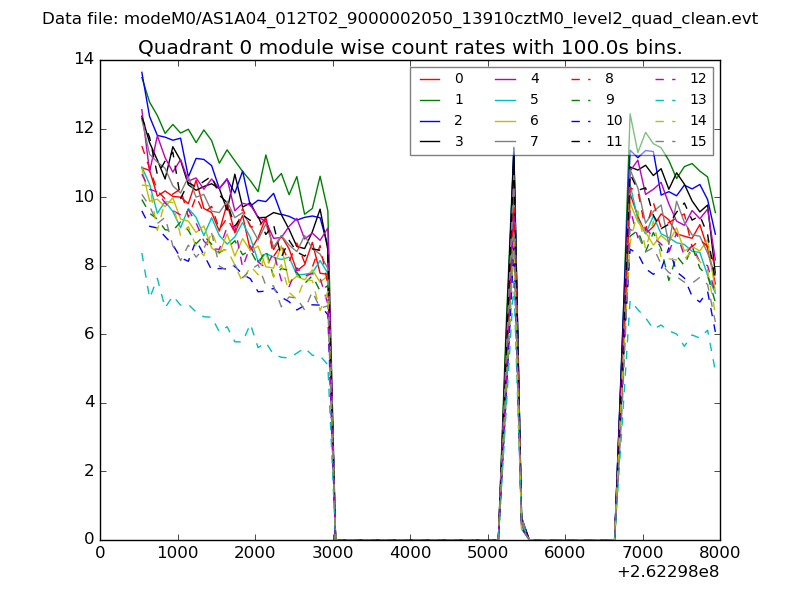 |
 |
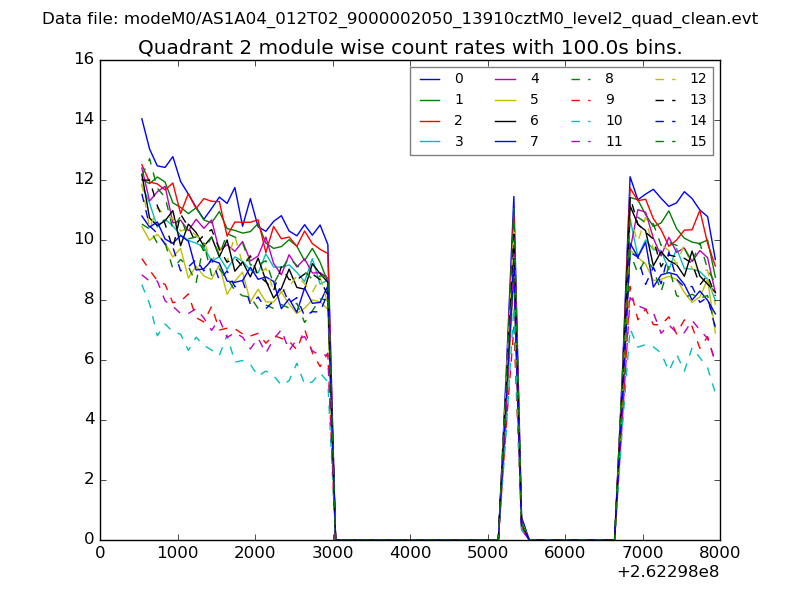
| Module-wise count rates for Quadrant B Data is divided into 100 sec bins |
 |
 |
| Module-wise count rates for Quadrant C Data is divided into 100 sec bins |
 |
 |
| Module-wise count rates for Quadrant D Data is divided into 100 sec bins |
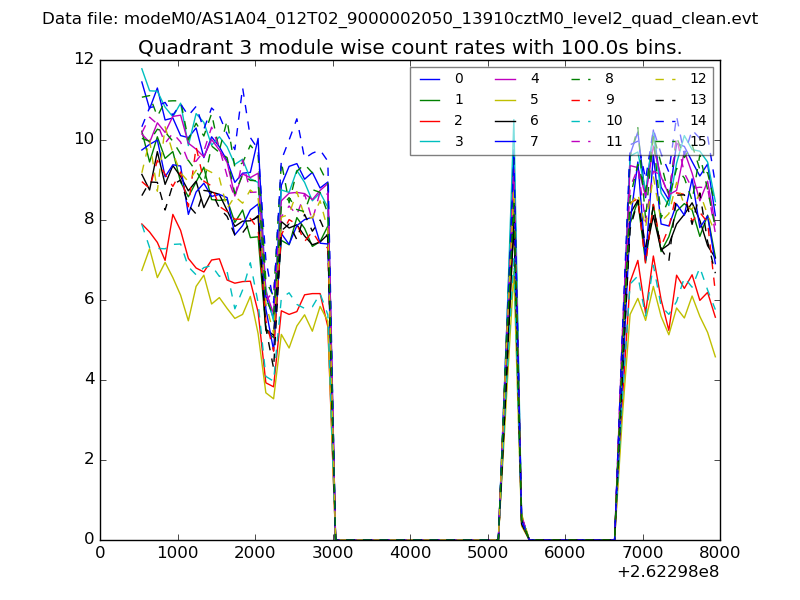 |
 |
| Parameter | Plot |
|---|---|
| CZT HV Monitor | 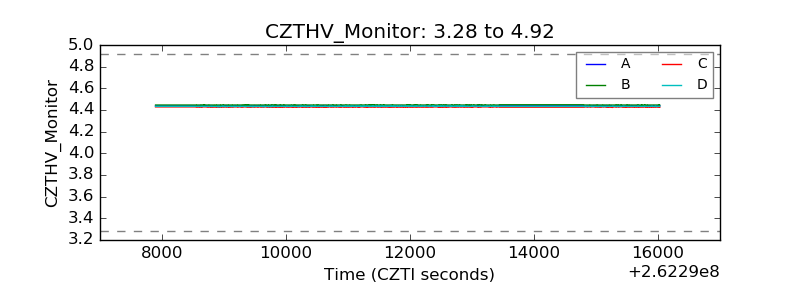 |
| D_VDD | 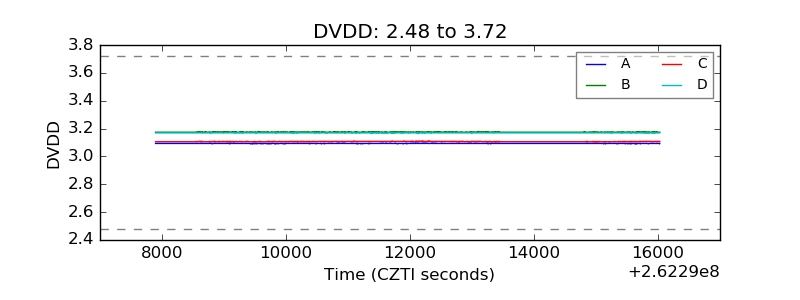 |
| Temperature 1 |  |
| Veto HV Monitor | 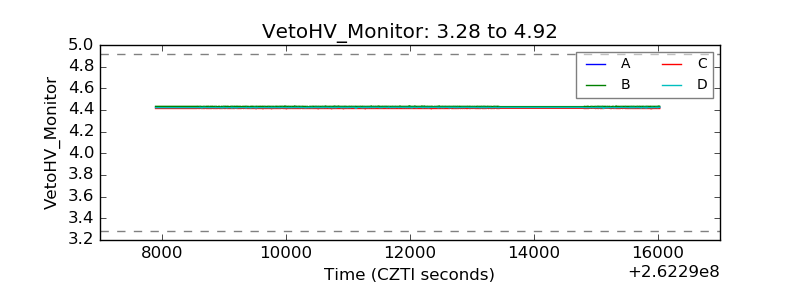 |
| Veto LLD |  |
| Alpha Counter | 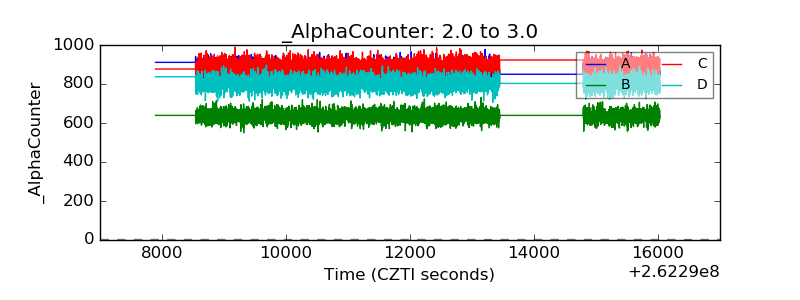 |
| _CPM_Rate | 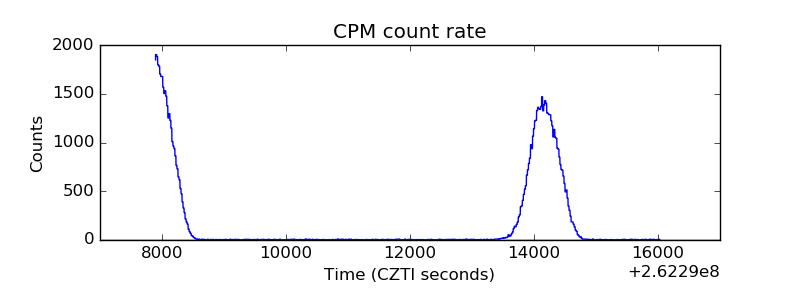 |
| CZT Counter | 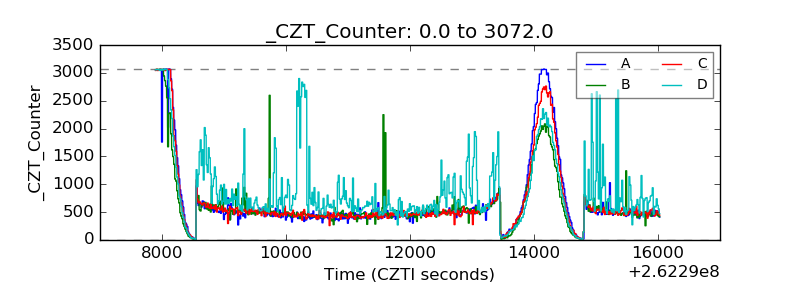 |
| +2.5 Volts monitor | 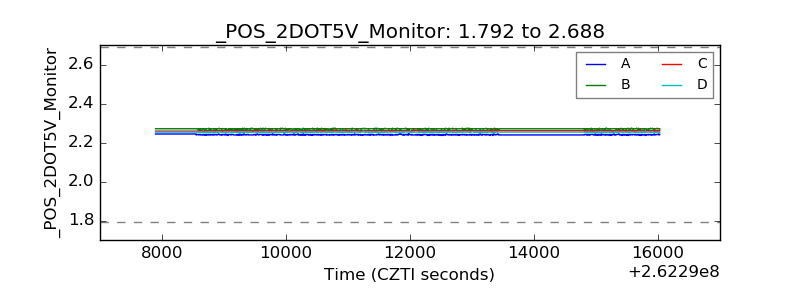 |
| +5 Volts monitor |  |
| _ROLL_ROT | 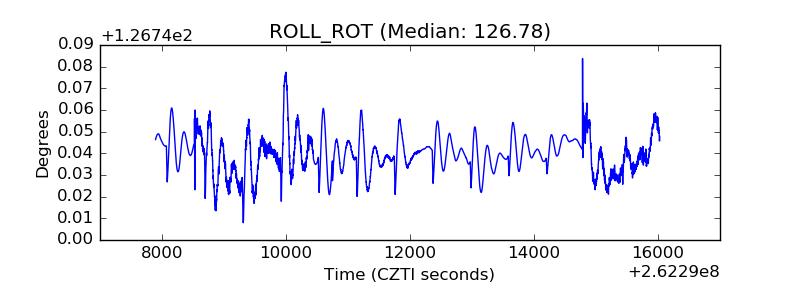 |
| _Roll_DEC | 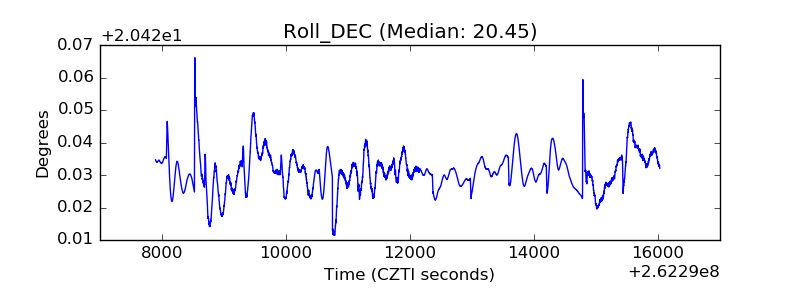 |
| _Roll_RA | 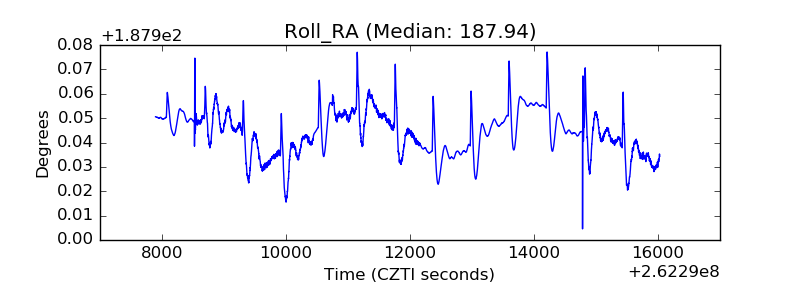 |
| Veto Counter | 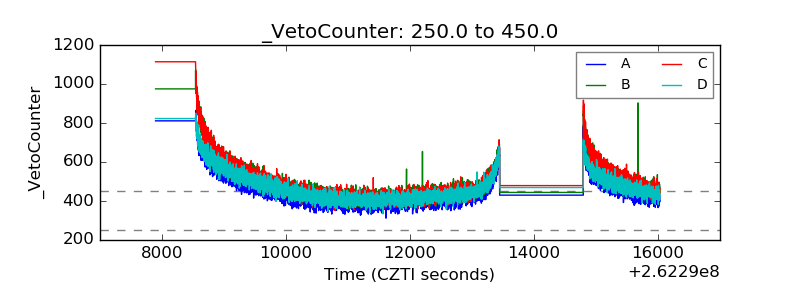 |