| Param | Original file | Final file |
|---|---|---|
| Filename | modeM0/AS1A04_012T02_9000002050_13912cztM0_level2.evt | modeM0/AS1A04_012T02_9000002050_13912cztM0_level2_quad_clean.evt |
| Size (bytes) | 523,802,880 | 99,236,160 |
| Size | 499.5 MB | 94.6 MB |
| Events in quadrant A | 4,360,521 | 626,241 |
| Events in quadrant B | 3,456,421 | 642,691 |
| Events in quadrant C | 3,407,239 | 634,806 |
| Events in quadrant D | 4,155,352 | 604,892 |
| Mode M9 | |||
|---|---|---|---|
| Quadrant | BADHDUFLAG | Total packets | Discarded packets |
| A | 0 | 21 | 0 |
| B | 0 | 21 | 0 |
| C | 0 | 21 | 0 |
| D | 0 | 21 | 0 |
| Mode SS | |||
|---|---|---|---|
| Quadrant | BADHDUFLAG | Total packets | Discarded packets |
| A | 0 | 146 | 0 |
| B | 0 | 146 | 0 |
| C | 0 | 146 | 0 |
| D | 0 | 146 | 0 |
| Mode M0 | |||
|---|---|---|---|
| Quadrant | BADHDUFLAG | Total packets | Discarded packets |
| A | 0 | 17776 | 3 |
| B | 0 | 15038 | 2 |
| C | 0 | 14877 | 2 |
| D | 0 | 17179 | 2 |
| Quadrant | Total seconds | Saturated seconds | Saturation percentage |
|---|---|---|---|
| A | 7134 | 248 | 3.476311% |
| B | 7134 | 57 | 0.798991% |
| C | 7134 | 22 | 0.308382% |
| D | 7134 | 100 | 1.401738% |
Noise dominated data is calculated using 1-second bins in cleaned event files. If a bin has >2000 counts, and if more than 50% of those come from <1% of pixels, then it is considered to be noise-dominated and hence unusable.
| Quadrant | # 1 sec bins | Bins with >0 counts | Bins with >2000 counts | High rate bins dominated by noise | Noise dominated (total time) | Noise dominated (detector-on time) | Marked lightcurve |
|---|---|---|---|---|---|---|---|
| A | 9200 | 7137 | 159 | 159 | 1.73% | 2.23% | 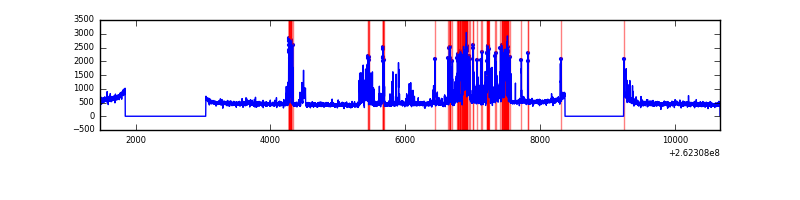 |
| B | 9200 | 7136 | 2 | 2 | 0.02% | 0.03% | 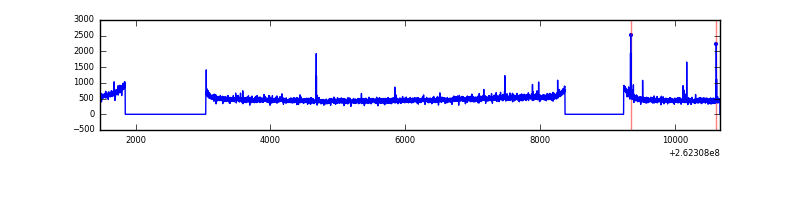 |
| C | 9200 | 7137 | 0 | 0 | 0.00% | 0.00% | 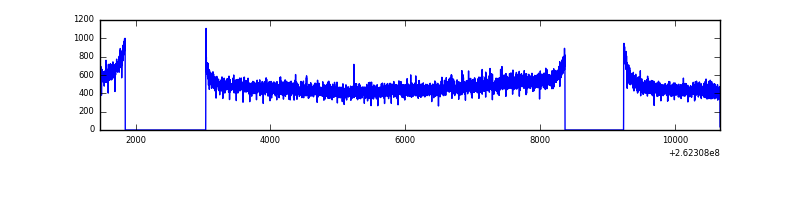 |
| D | 9200 | 7137 | 38 | 38 | 0.41% | 0.53% | 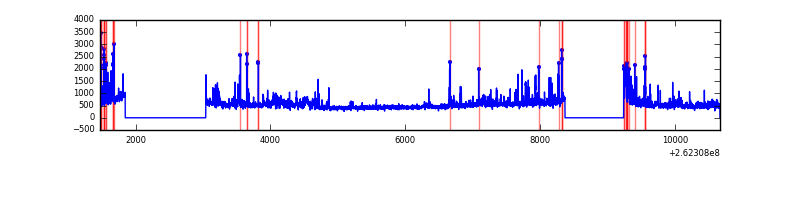 |
Top three noisy pixels from each quadrant. If the there are fewer than three noisy pixels in the level2.evt file, extra rows are filled as -1
| Pixel properties | Quadrant properties | ||||||
|---|---|---|---|---|---|---|---|
| Quadrant | DetID | PixID | Counts | Sigma | Mean | Median | Sigma |
| A | 9 | 143 | 1010054 | 5677.08 | 862 | 843 | 177.8 |
| A | 1 | 162 | 14552 | 77.12 | 862 | 843 | 177.8 |
| A | 8 | 15 | 13688 | 72.26 | 862 | 843 | 177.8 |
| B | 0 | 219 | 30136 | 175.56 | 868 | 845 | 166.8 |
| B | 12 | 111 | 20460 | 117.56 | 868 | 845 | 166.8 |
| B | 11 | 111 | 17583 | 100.32 | 868 | 845 | 166.8 |
| C | 3 | 233 | 106116 | 533.46 | 847 | 852 | 197.3 |
| C | 13 | 61 | 6215 | 27.18 | 847 | 852 | 197.3 |
| C | 12 | 4 | 2065 | 6.15 | 847 | 852 | 197.3 |
| D | 13 | 122 | 572679 | 2876.64 | 833 | 811 | 198.8 |
| D | 1 | 52 | 184107 | 922.03 | 833 | 811 | 198.8 |
| D | 5 | 222 | 91280 | 455.08 | 833 | 811 | 198.8 |
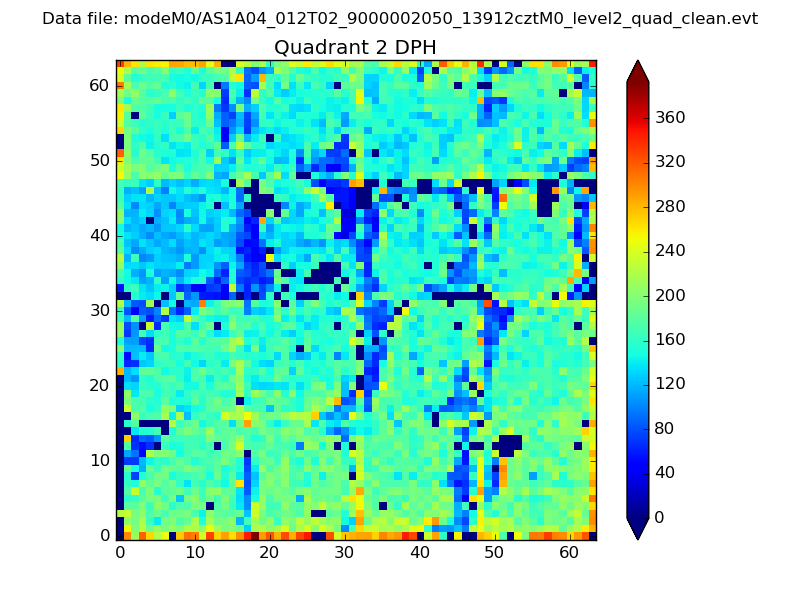
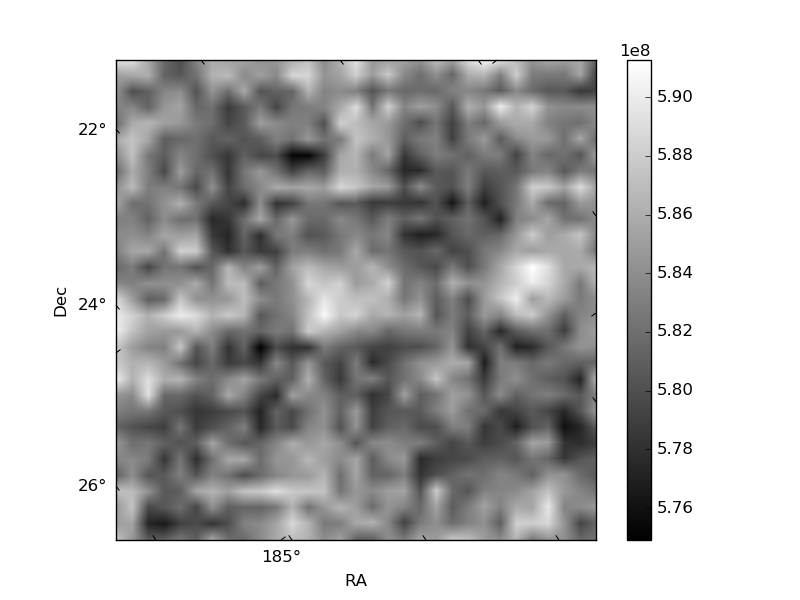
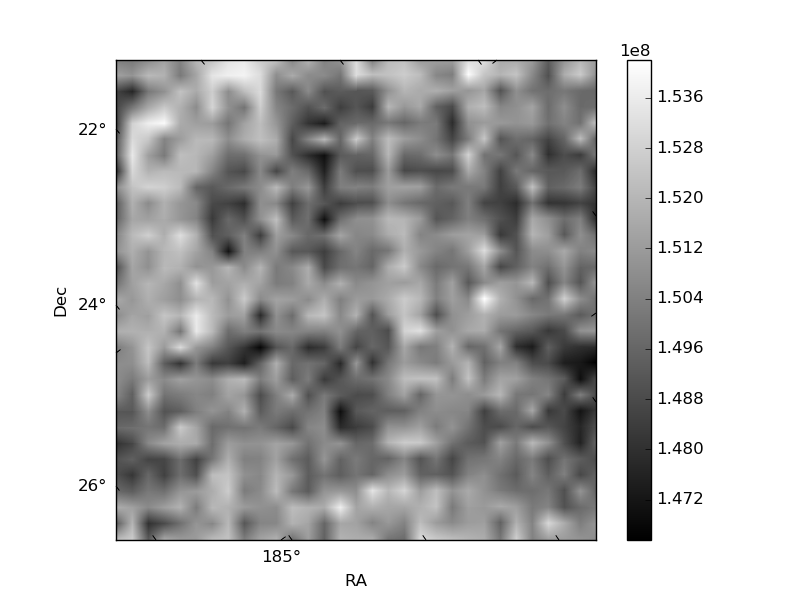
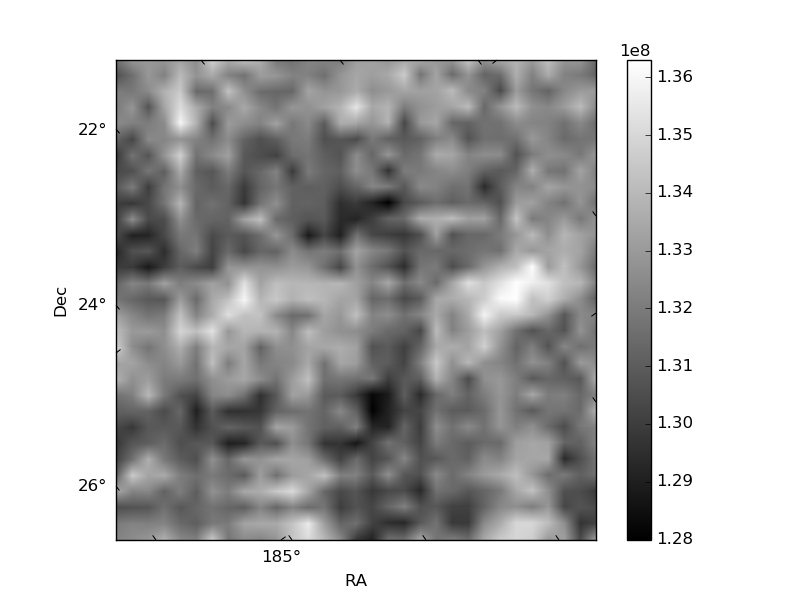
Histogram calculated using DETX and DETY for each event in the final _common_clean file
| Quadrant A | 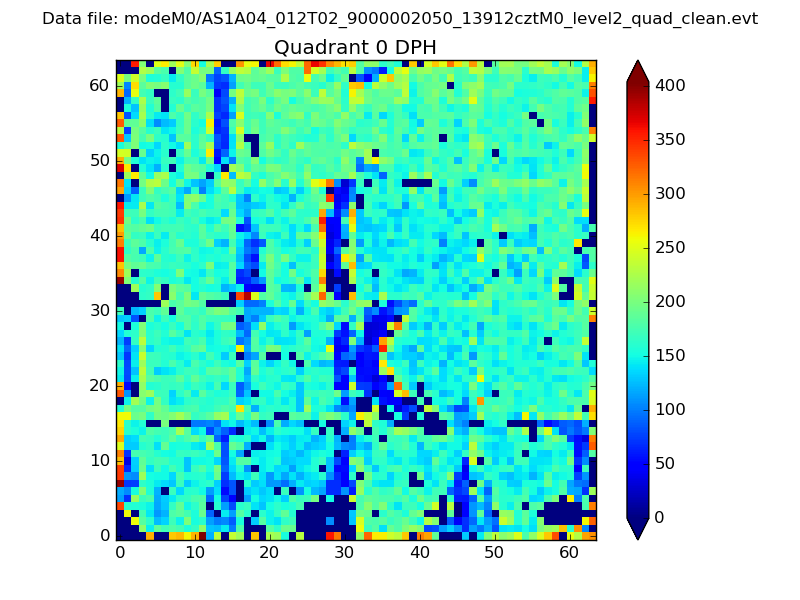 |
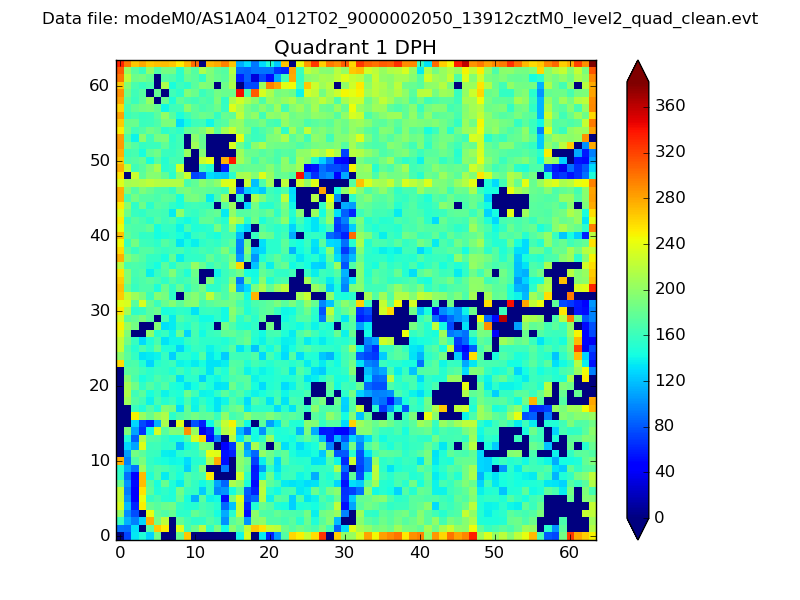 |
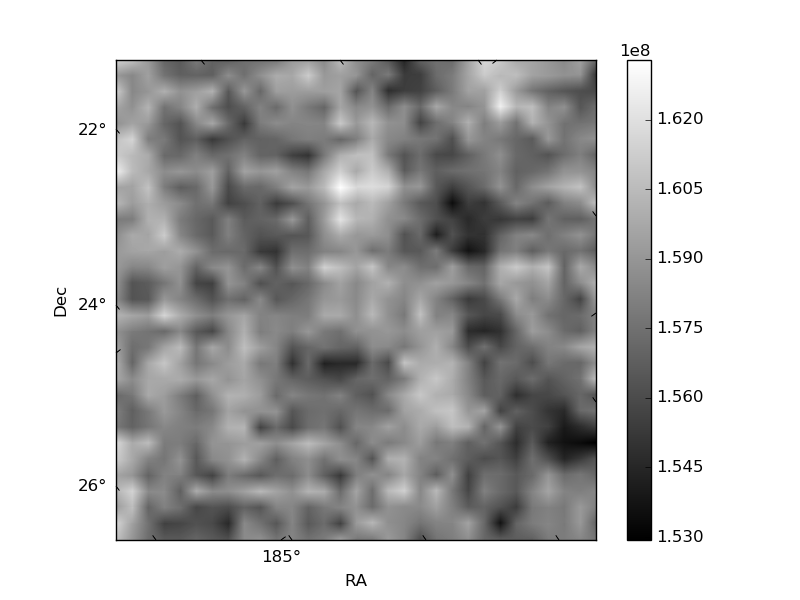
Quadrant B |
|---|---|---|---|
| Quadrant D | 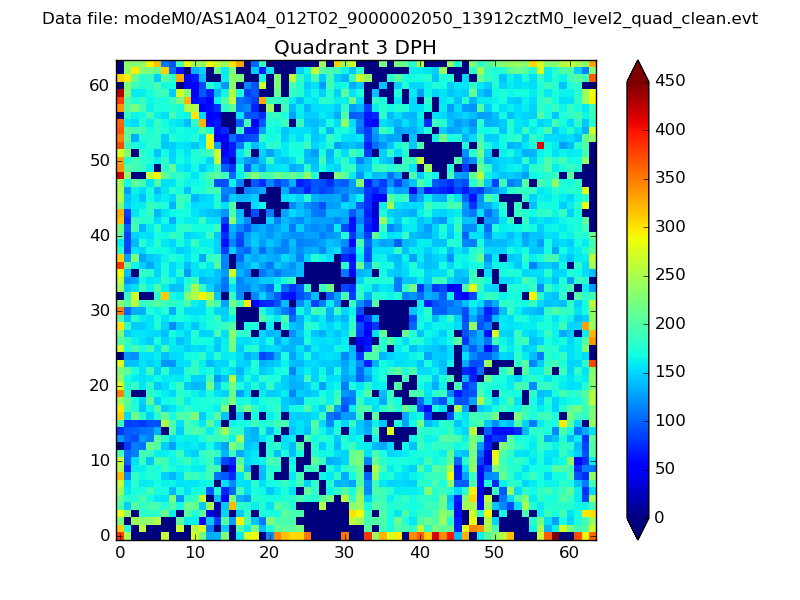 |
 |
Quadrant C |
| Plot type | Count rate plots | Images |
|---|---|---|
| Comparison with Poisson distribution Blue bars denote a histogram of data divided into 1 sec bins. Red curve is a Poisson curve with rate = median count rate of data. |
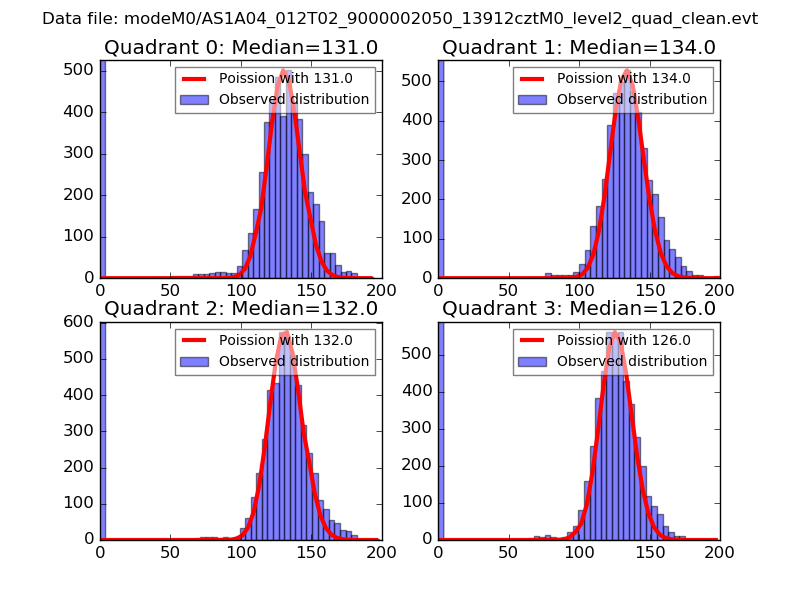 |
 |
| Quadrant-wise count rates Data is divided into 100 sec bins |
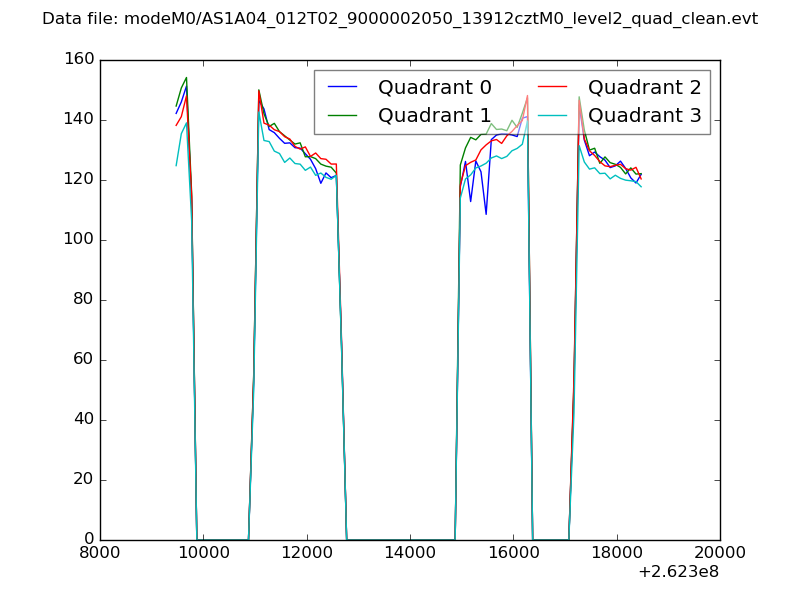 |
|
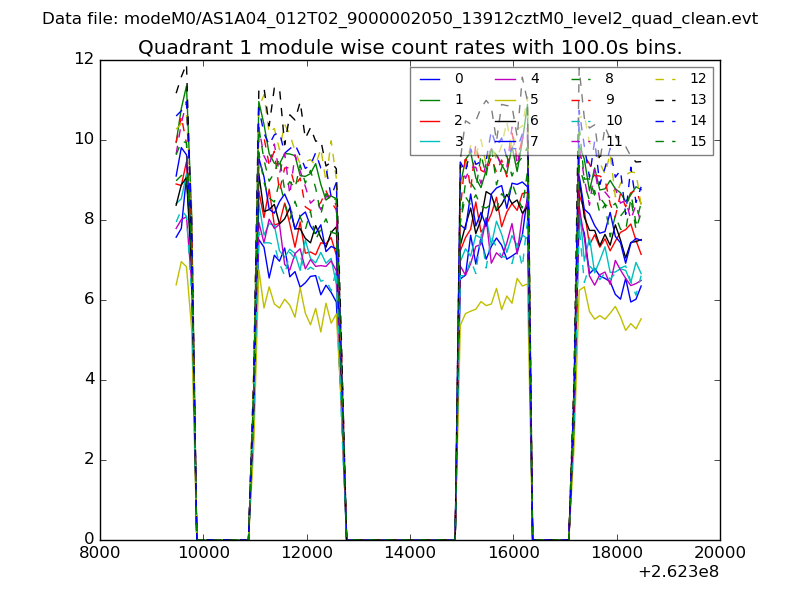
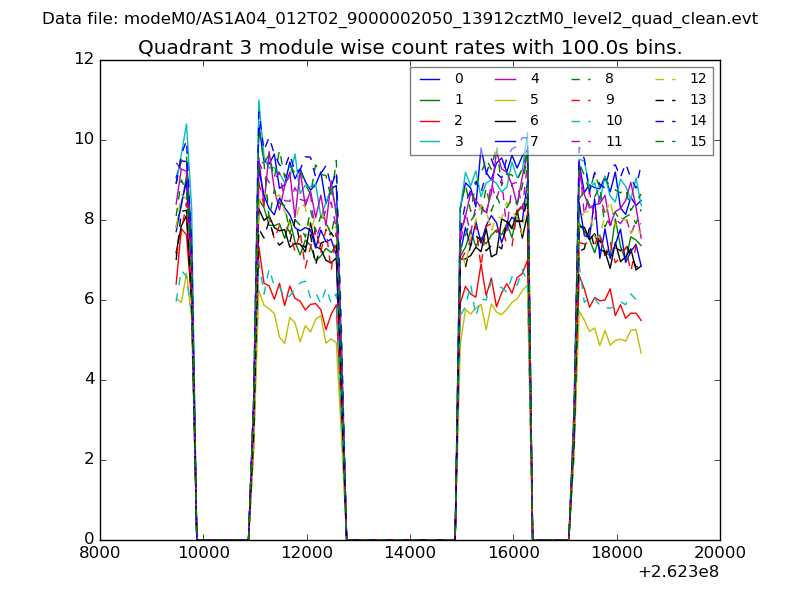
| Module-wise count rates for Quadrant A Data is divided into 100 sec bins |
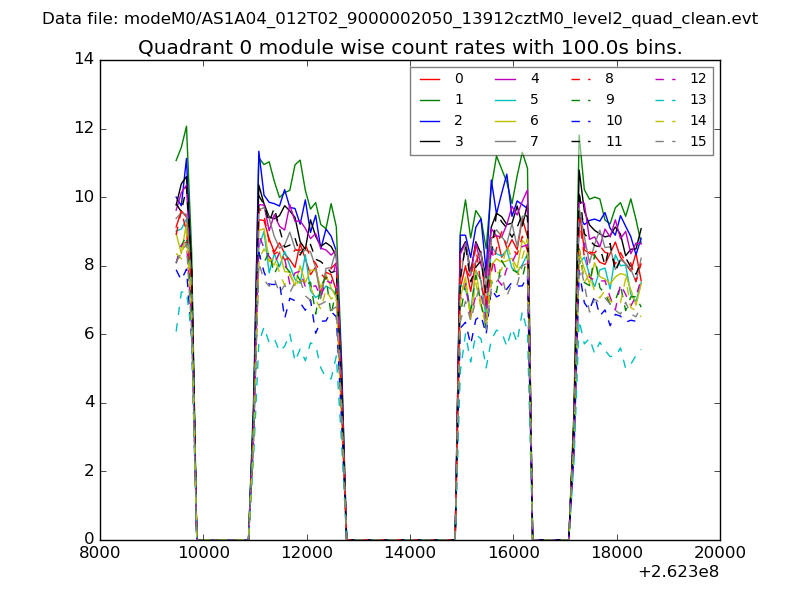 |
 |
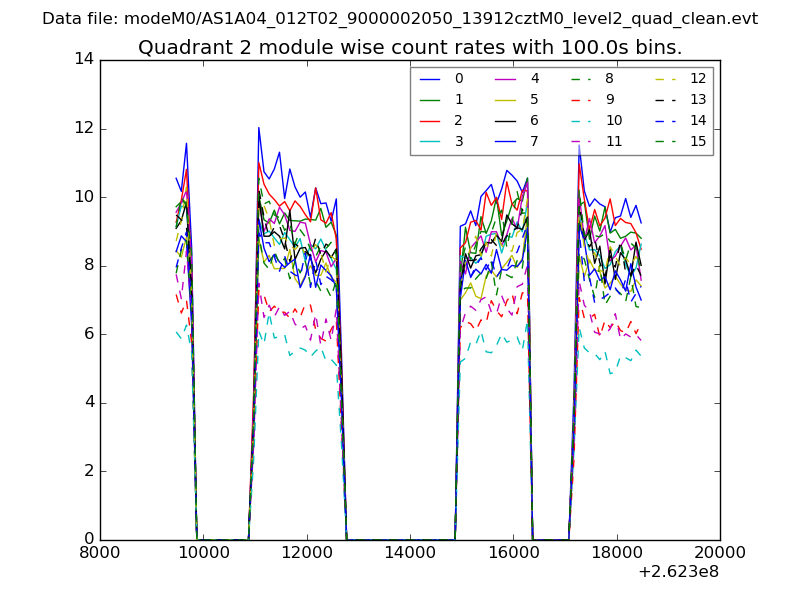
| Module-wise count rates for Quadrant B Data is divided into 100 sec bins |
 |
 |
| Module-wise count rates for Quadrant C Data is divided into 100 sec bins |
 |
 |
| Module-wise count rates for Quadrant D Data is divided into 100 sec bins |
 |
 |
| Parameter | Plot |
|---|---|
| CZT HV Monitor | 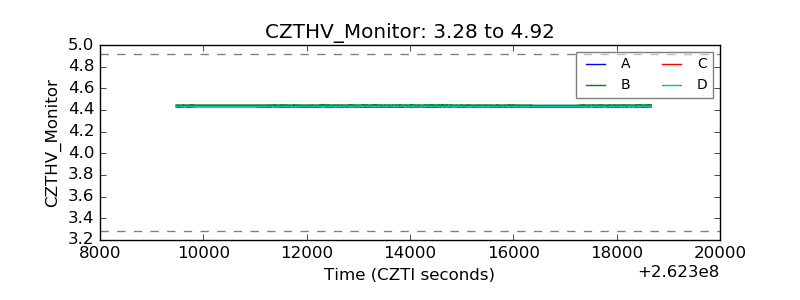 |
| D_VDD |  |
| Temperature 1 |  |
| Veto HV Monitor | 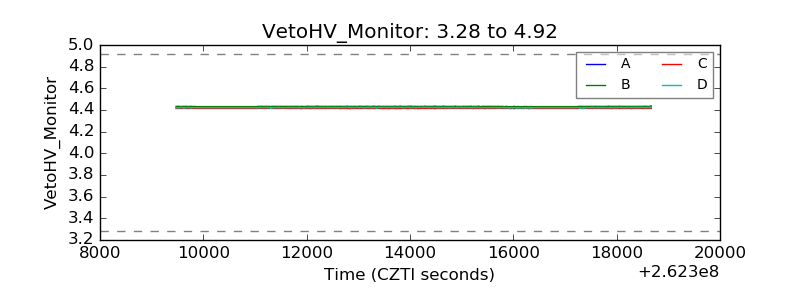 |
| Veto LLD |  |
| Alpha Counter | 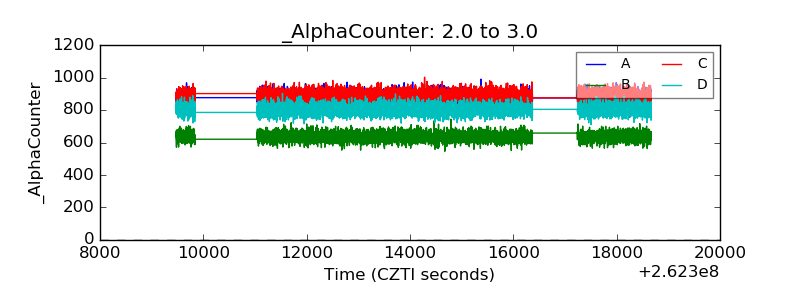 |
| _CPM_Rate | 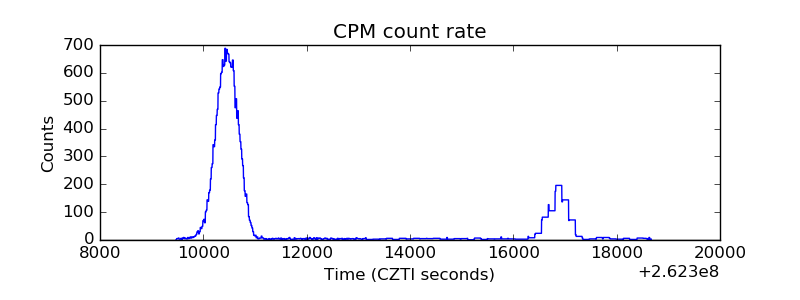 |
| CZT Counter |  |
| +2.5 Volts monitor |  |
| +5 Volts monitor |  |
| _ROLL_ROT | 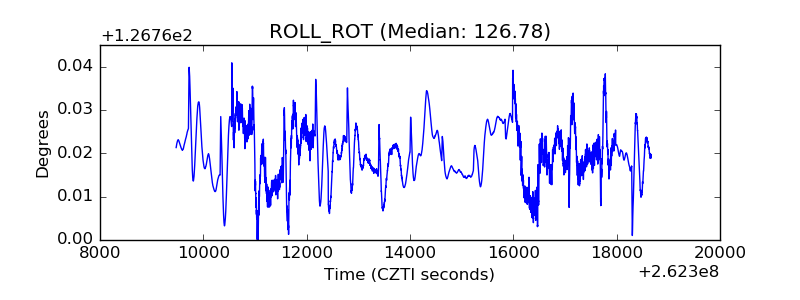 |
| _Roll_DEC | 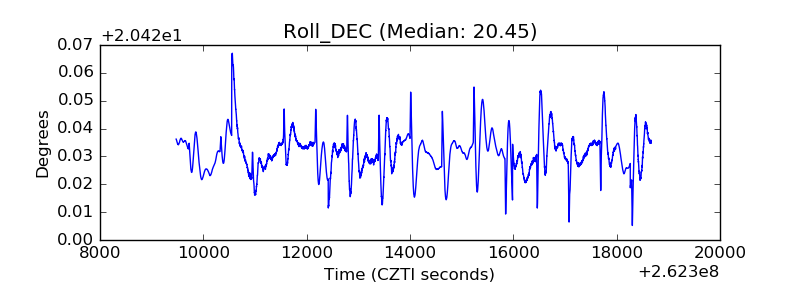 |
| _Roll_RA | 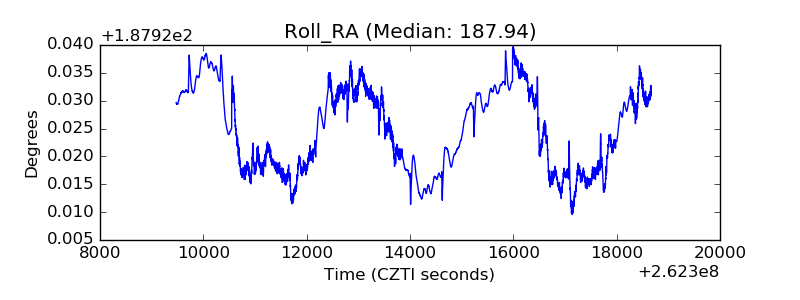 |
| Veto Counter | 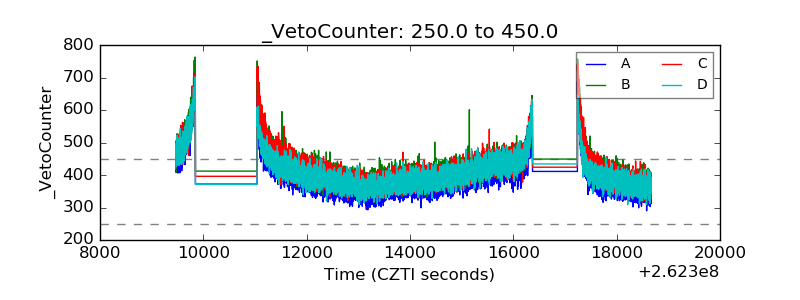 |