| Param | Original file | Final file |
|---|---|---|
| Filename | modeM0/AS1A04_012T02_9000002050_13913cztM0_level2.evt | modeM0/AS1A04_012T02_9000002050_13913cztM0_level2_quad_clean.evt |
| Size (bytes) | 539,081,280 | 90,408,960 |
| Size | 514.1 MB | 86.2 MB |
| Events in quadrant A | 3,556,778 | 563,065 |
| Events in quadrant B | 3,507,406 | 572,201 |
| Events in quadrant C | 3,340,091 | 567,443 |
| Events in quadrant D | 5,435,475 | 535,684 |
| Mode M9 | |||
|---|---|---|---|
| Quadrant | BADHDUFLAG | Total packets | Discarded packets |
| A | 0 | 8 | 0 |
| B | 0 | 8 | 0 |
| C | 0 | 8 | 0 |
| D | 0 | 9 | 0 |
| Mode SS | |||
|---|---|---|---|
| Quadrant | BADHDUFLAG | Total packets | Discarded packets |
| A | 0 | 144 | 0 |
| B | 0 | 144 | 0 |
| C | 0 | 144 | 0 |
| D | 0 | 144 | 0 |
| Mode M0 | |||
|---|---|---|---|
| Quadrant | BADHDUFLAG | Total packets | Discarded packets |
| A | 0 | 15390 | 3 |
| B | 0 | 15265 | 2 |
| C | 0 | 14697 | 2 |
| D | 0 | 21033 | 2 |
| Quadrant | Total seconds | Saturated seconds | Saturation percentage |
|---|---|---|---|
| A | 7177 | 63 | 0.877804% |
| B | 7177 | 65 | 0.905671% |
| C | 7177 | 13 | 0.181134% |
| D | 7177 | 234 | 3.260415% |
Noise dominated data is calculated using 1-second bins in cleaned event files. If a bin has >2000 counts, and if more than 50% of those come from <1% of pixels, then it is considered to be noise-dominated and hence unusable.
| Quadrant | # 1 sec bins | Bins with >0 counts | Bins with >2000 counts | High rate bins dominated by noise | Noise dominated (total time) | Noise dominated (detector-on time) | Marked lightcurve |
|---|---|---|---|---|---|---|---|
| A | 7693 | 7179 | 47 | 47 | 0.61% | 0.65% | 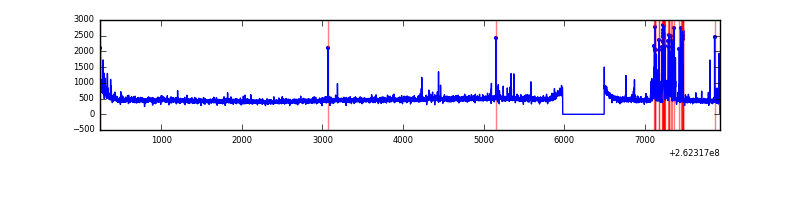 |
| B | 7693 | 7179 | 7 | 7 | 0.09% | 0.10% | 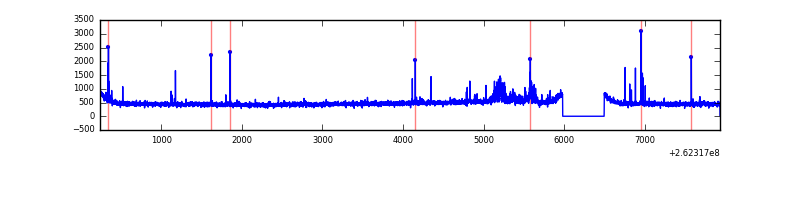 |
| C | 7693 | 7179 | 0 | 0 | 0.00% | 0.00% | 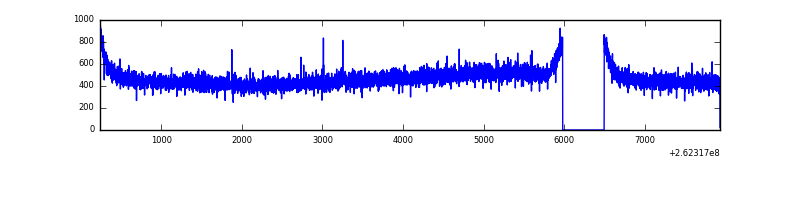 |
| D | 7693 | 7178 | 194 | 194 | 2.52% | 2.70% | 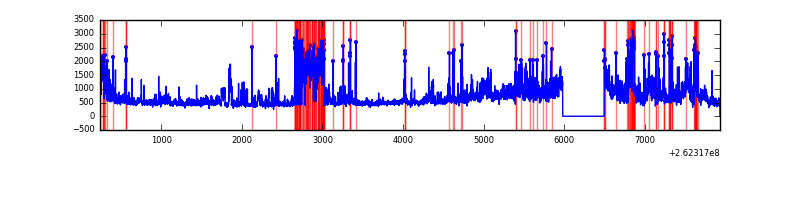 |
Top three noisy pixels from each quadrant. If the there are fewer than three noisy pixels in the level2.evt file, extra rows are filled as -1
| Pixel properties | Quadrant properties | ||||||
|---|---|---|---|---|---|---|---|
| Quadrant | DetID | PixID | Counts | Sigma | Mean | Median | Sigma |
| A | 9 | 143 | 247850 | 1420.22 | 847 | 827 | 173.9 |
| A | 8 | 15 | 36570 | 205.5 | 847 | 827 | 173.9 |
| A | 1 | 162 | 11831 | 63.27 | 847 | 827 | 173.9 |
| B | 4 | 142 | 95382 | 574.9 | 849 | 825 | 164.5 |
| B | 4 | 80 | 36160 | 214.83 | 849 | 825 | 164.5 |
| B | 0 | 219 | 28287 | 166.97 | 849 | 825 | 164.5 |
| C | 3 | 233 | 104085 | 532.17 | 830 | 833 | 194.0 |
| C | 13 | 61 | 6027 | 26.77 | 830 | 833 | 194.0 |
| C | 0 | 207 | 2094 | 6.5 | 830 | 833 | 194.0 |
| D | 13 | 122 | 1432844 | 7418.36 | 810 | 792 | 193.0 |
| D | 1 | 52 | 555624 | 2874.16 | 810 | 792 | 193.0 |
| D | 5 | 222 | 177922 | 917.57 | 810 | 792 | 193.0 |
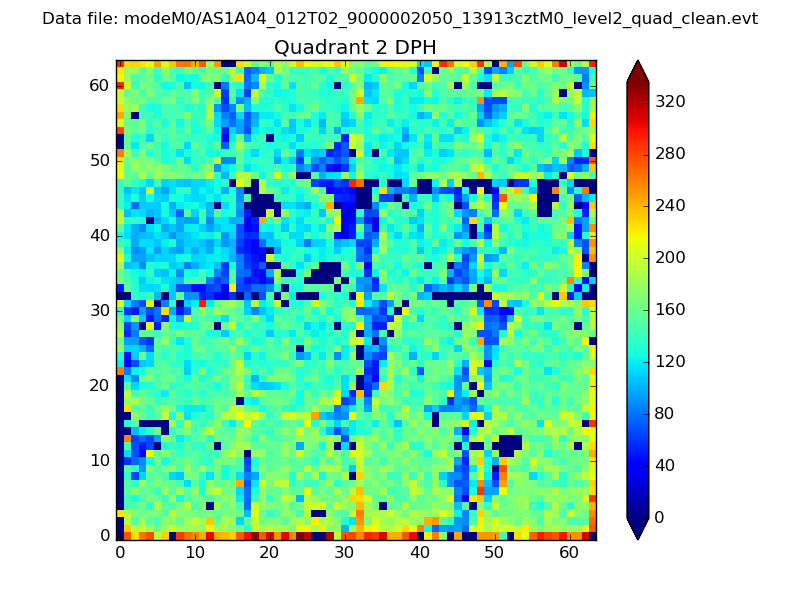
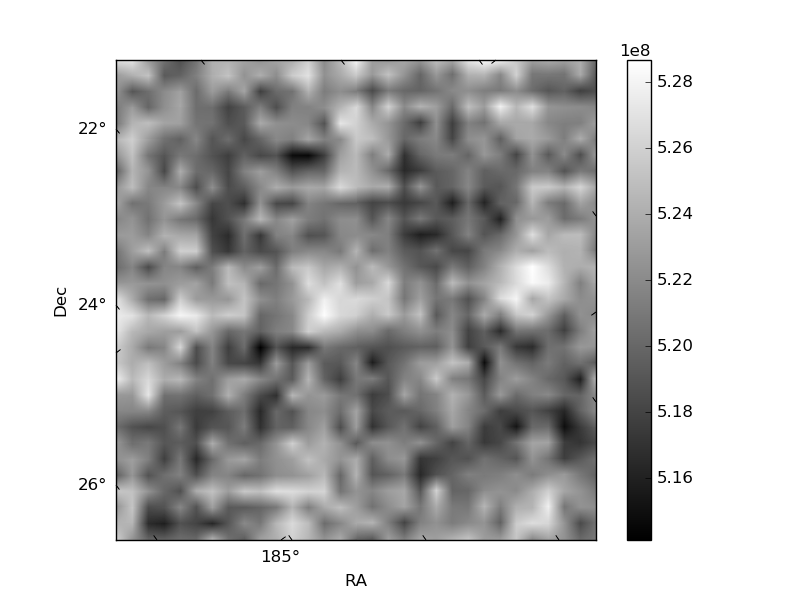
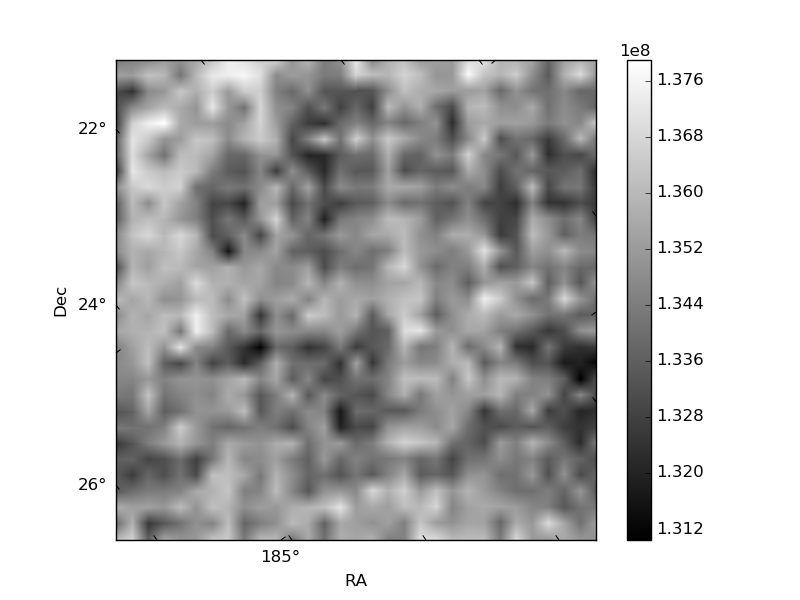
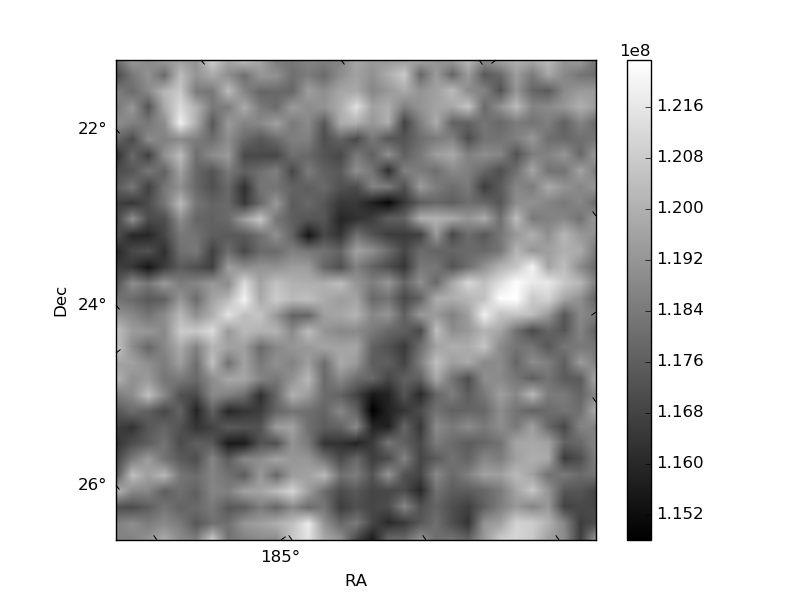
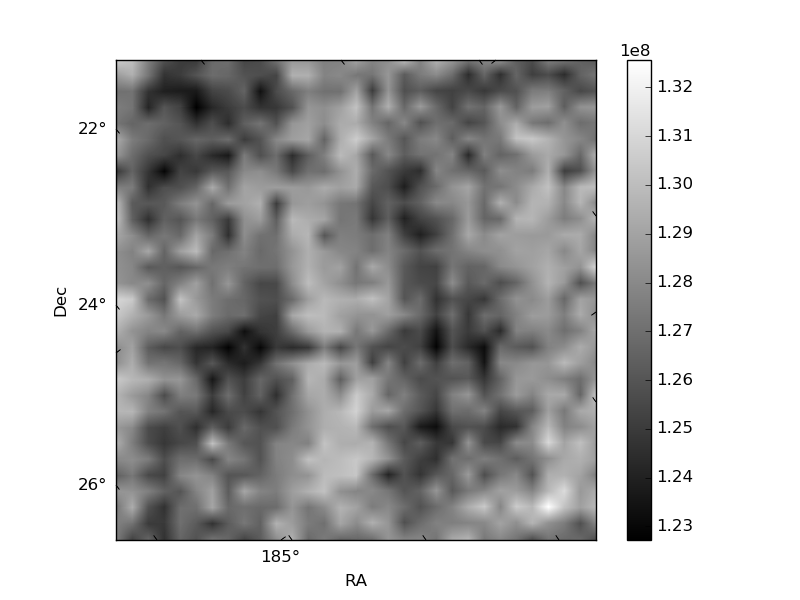
Histogram calculated using DETX and DETY for each event in the final _common_clean file
| Quadrant A | 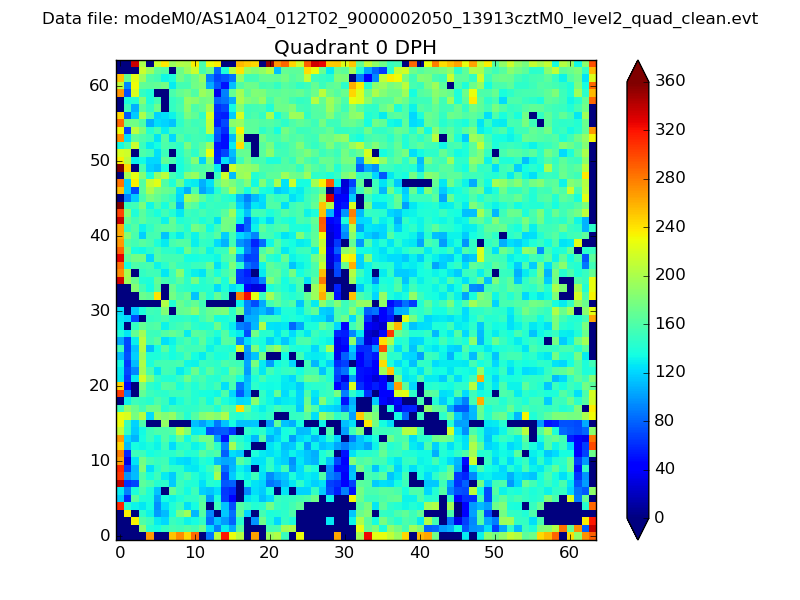 |
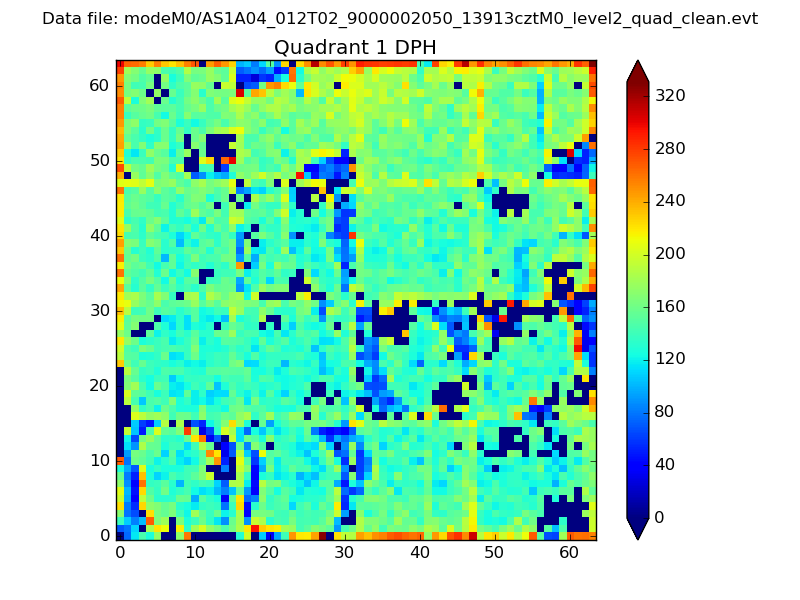 |
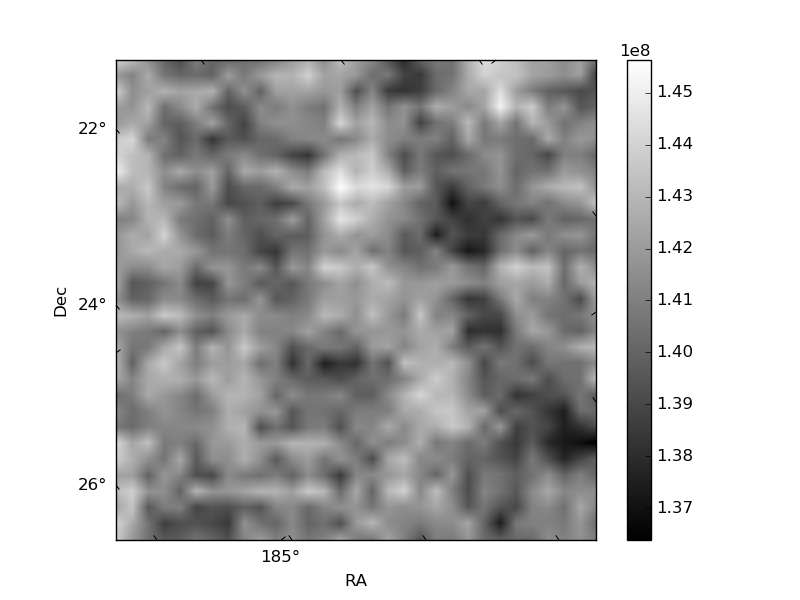
Quadrant B |
|---|---|---|---|
| Quadrant D | 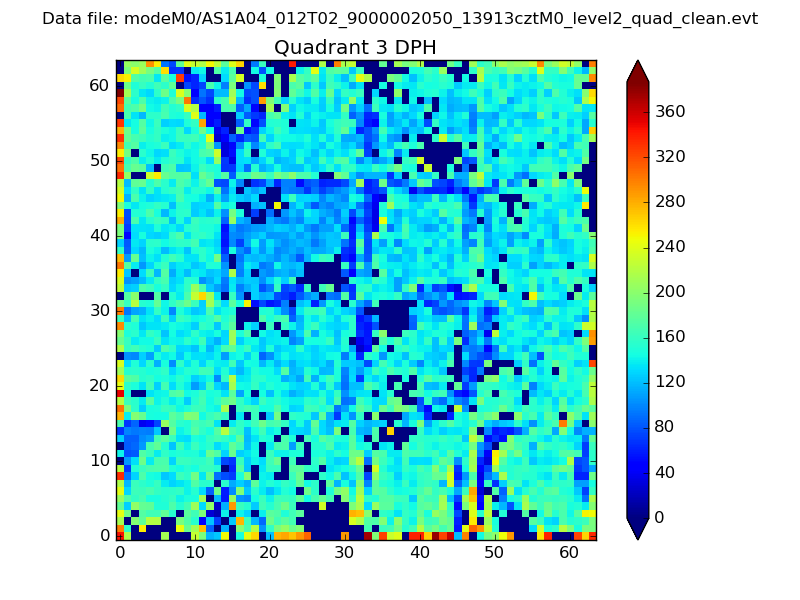 |
 |
Quadrant C |
| Plot type | Count rate plots | Images |
|---|---|---|
| Comparison with Poisson distribution Blue bars denote a histogram of data divided into 1 sec bins. Red curve is a Poisson curve with rate = median count rate of data. |
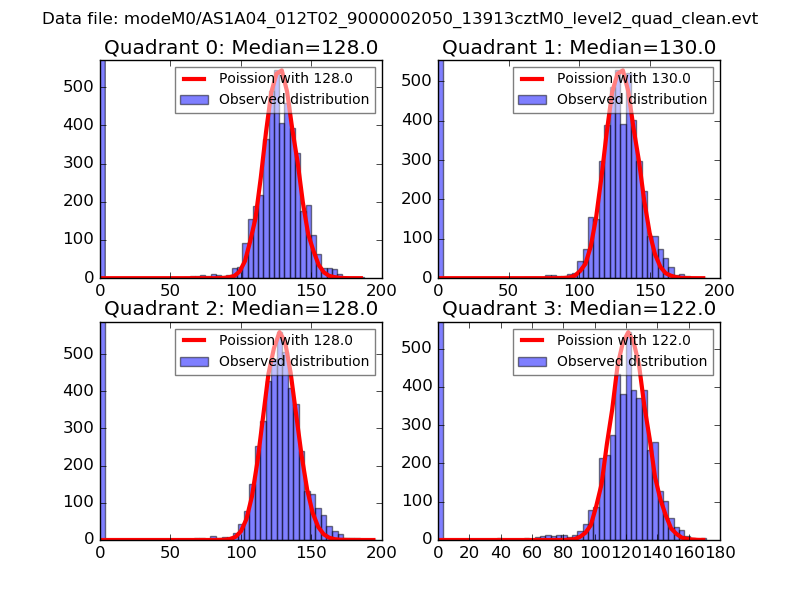 |
 |
| Quadrant-wise count rates Data is divided into 100 sec bins |
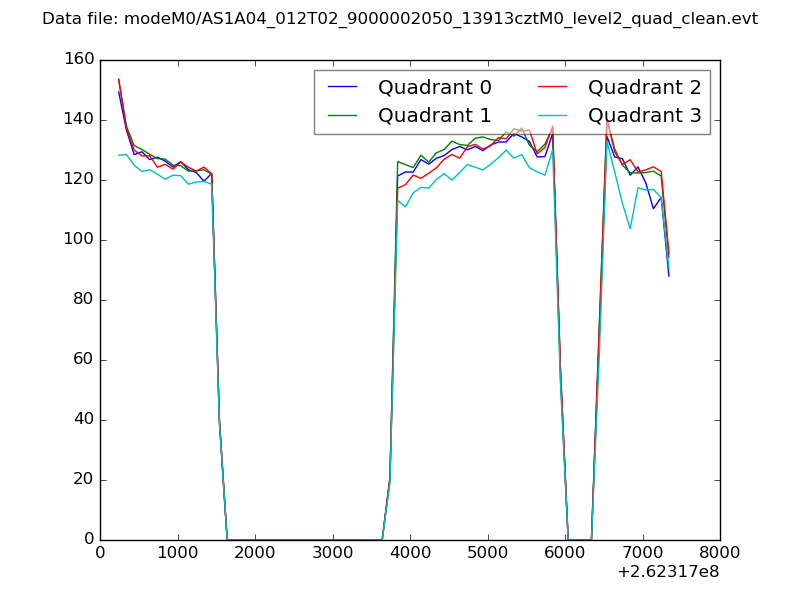 |
|
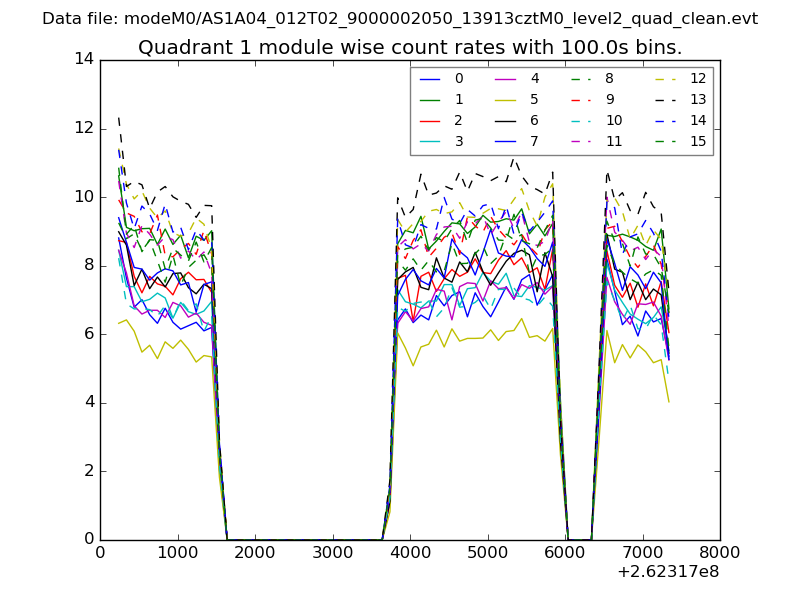
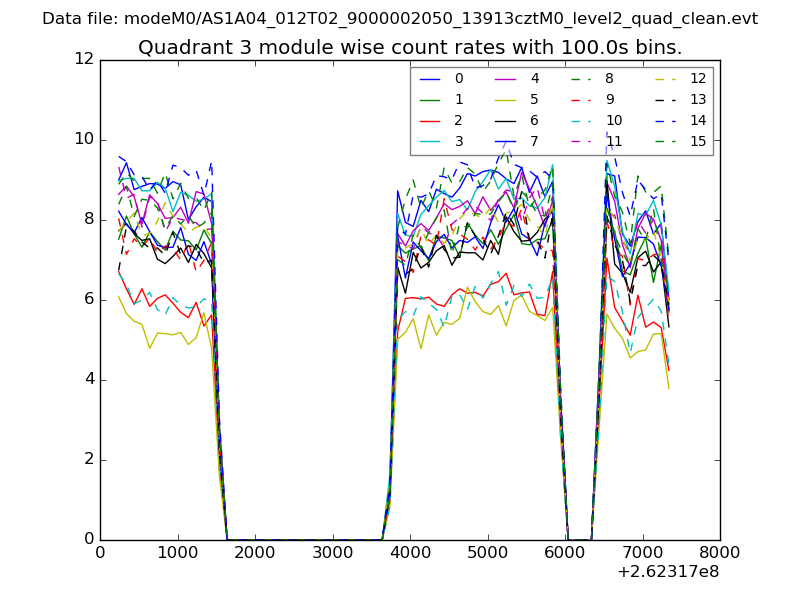
| Module-wise count rates for Quadrant A Data is divided into 100 sec bins |
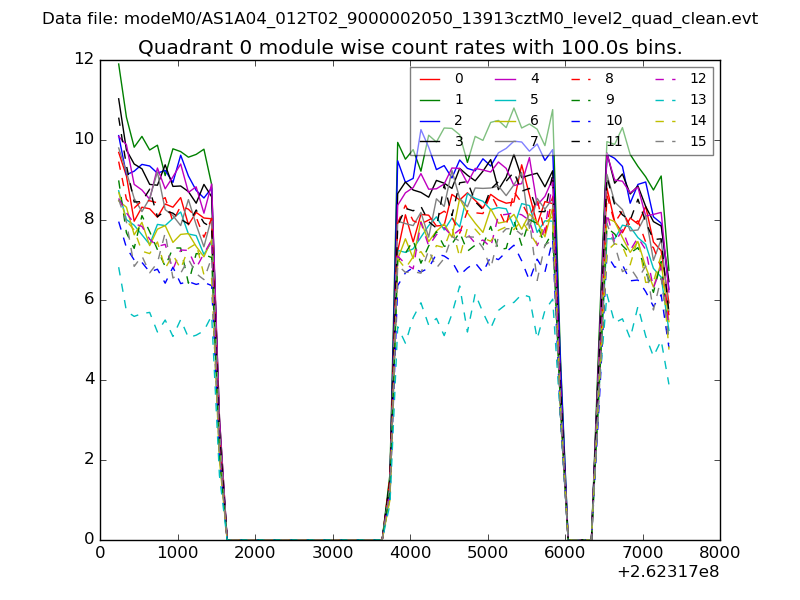 |
 |
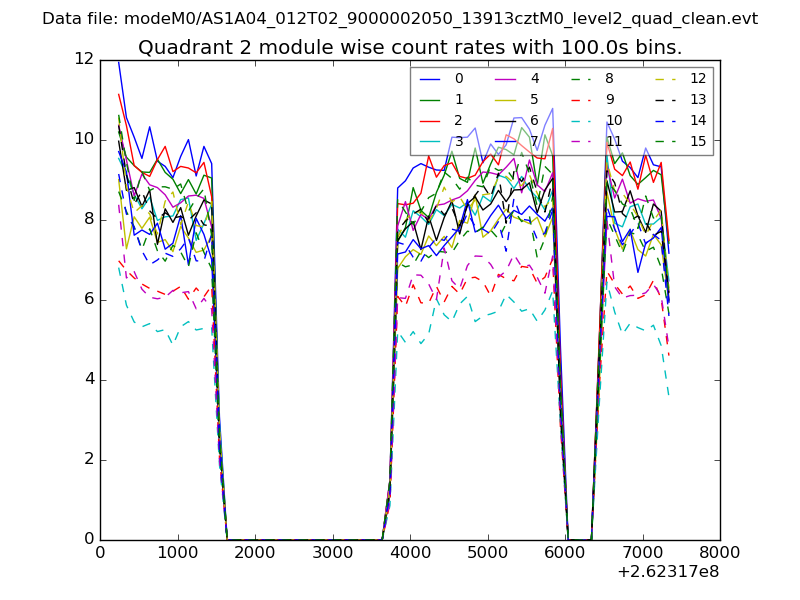
| Module-wise count rates for Quadrant B Data is divided into 100 sec bins |
 |
 |
| Module-wise count rates for Quadrant C Data is divided into 100 sec bins |
 |
 |
| Module-wise count rates for Quadrant D Data is divided into 100 sec bins |
 |
 |
| Parameter | Plot |
|---|---|
| CZT HV Monitor |  |
| D_VDD | 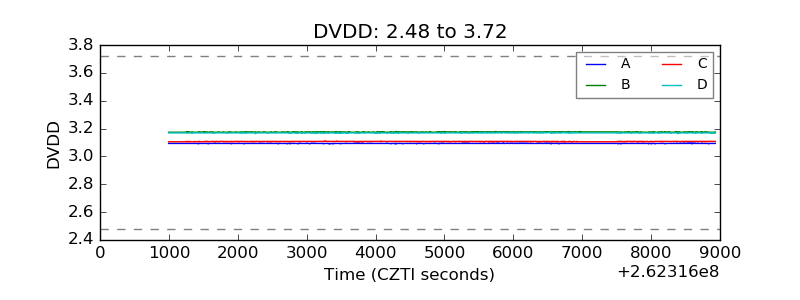 |
| Temperature 1 | 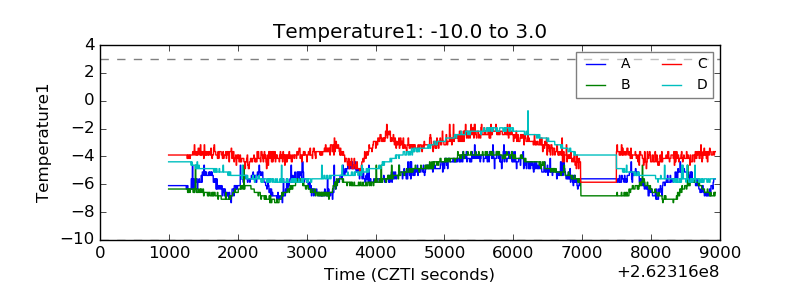 |
| Veto HV Monitor | 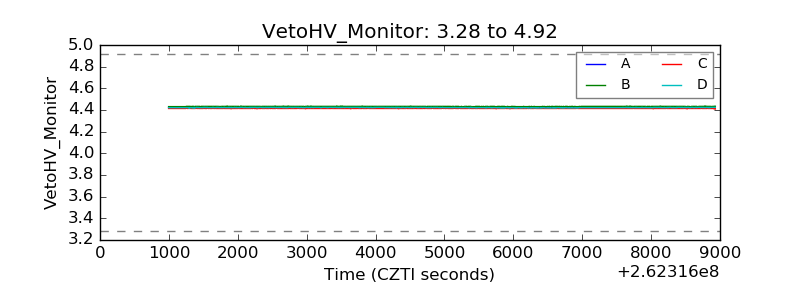 |
| Veto LLD | 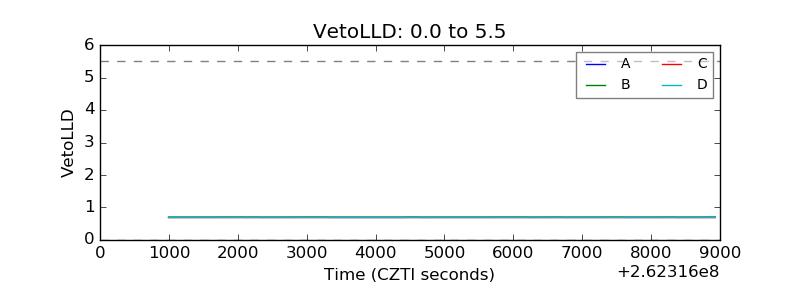 |
| Alpha Counter | 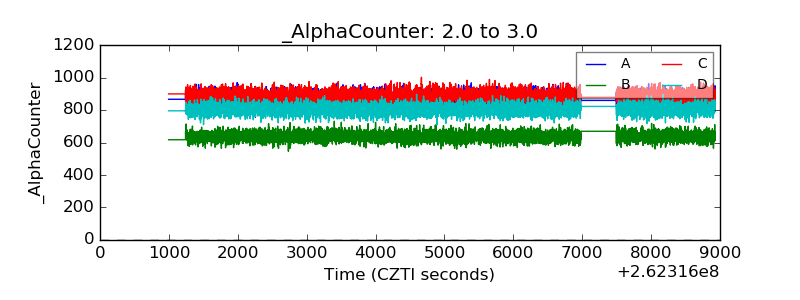 |
| _CPM_Rate | 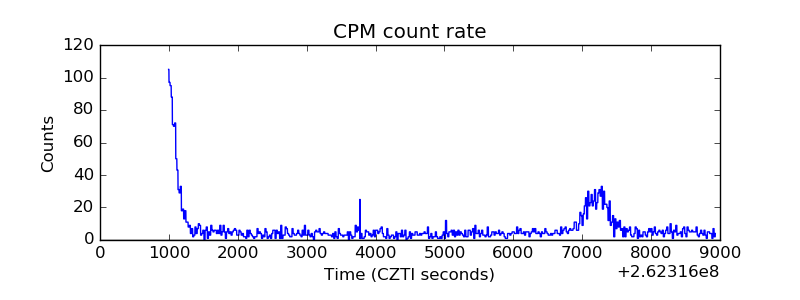 |
| CZT Counter | 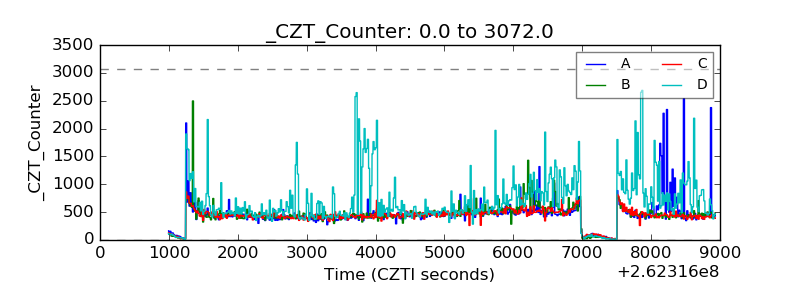 |
| +2.5 Volts monitor |  |
| +5 Volts monitor |  |
| _ROLL_ROT | 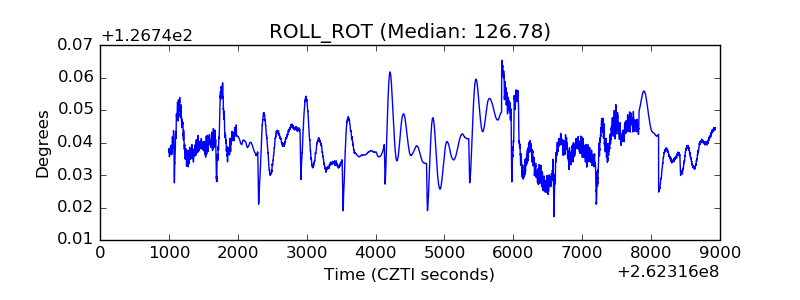 |
| _Roll_DEC | 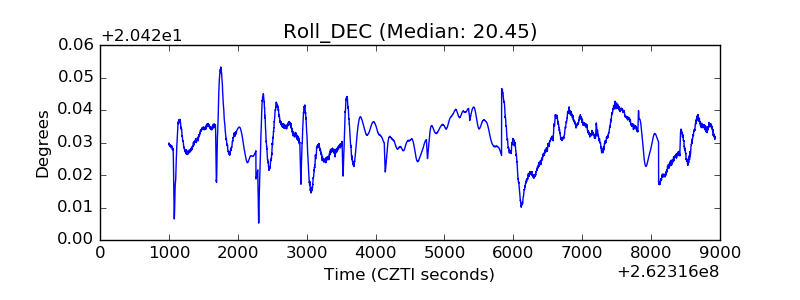 |
| _Roll_RA | 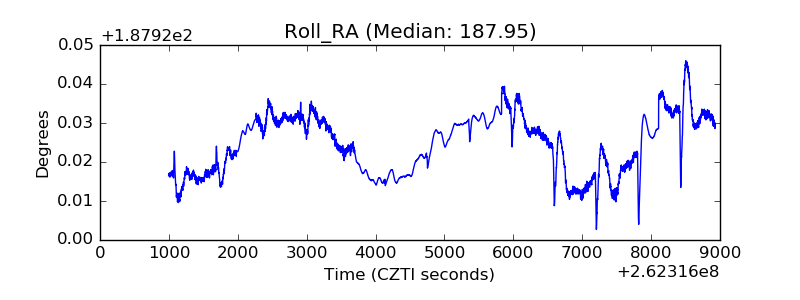 |
| Veto Counter | 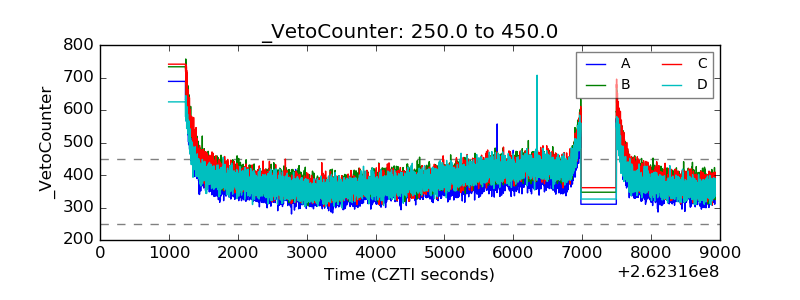 |