| Param | Original file | Final file |
|---|---|---|
| Filename | modeM0/AS1A04_167T05_9000002052cztM0_level2.fits | modeM0/AS1A04_167T05_9000002052cztM0_level2_quad_clean.evt |
| Size (bytes) | 60,814,080 | 57,594,240 |
| Size | 58.0 MB | 54.9 MB |
| Events in quadrant A | 362,594 | 333,722 |
| Events in quadrant B | 351,924 | 333,154 |
| Events in quadrant C | 359,834 | 321,521 |
| Events in quadrant D | 307,548 | 294,911 |
| Mode M9 | |||
|---|---|---|---|
| Quadrant | BADHDUFLAG | Total packets | Discarded packets |
| A | 0 | 8 | 0 |
| B | 0 | 8 | 0 |
| C | 0 | 8 | 0 |
| D | 0 | 8 | 0 |
| Mode M0 | |||
|---|---|---|---|
| Quadrant | BADHDUFLAG | Total packets | Discarded packets |
| A | 0 | 13744 | 0 |
| B | 0 | 13803 | 0 |
| C | 0 | 13478 | 0 |
| D | 0 | 16970 | 0 |
| Mode SS | |||
|---|---|---|---|
| Quadrant | BADHDUFLAG | Total packets | Discarded packets |
| A | 0 | 134 | 0 |
| B | 0 | 134 | 0 |
| C | 0 | 134 | 0 |
| D | 0 | 134 | 0 |
| Quadrant | Total seconds | Saturated seconds | Saturation percentage |
|---|---|---|---|
| A | 6603 | 116 | 1.756777% |
| B | 6603 | 117 | 1.771922% |
| C | 6603 | 88 | 1.332728% |
| D | 6603 | 147 | 2.226261% |
Noise dominated data is calculated using 1-second bins in cleaned event files. If a bin has >2000 counts, and if more than 50% of those come from <1% of pixels, then it is considered to be noise-dominated and hence unusable.
| Quadrant | # 1 sec bins | Bins with >0 counts | Bins with >2000 counts | High rate bins dominated by noise | Noise dominated (total time) | Noise dominated (detector-on time) | Marked lightcurve |
|---|---|---|---|---|---|---|---|
| A | 7262 | 6601 | 0 | 0 | 0.00% | 0.00% |  |
| B | 7262 | 6601 | 0 | 0 | 0.00% | 0.00% | 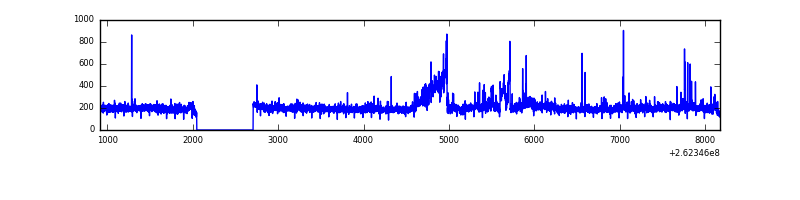 |
| C | 7262 | 6601 | 0 | 0 | 0.00% | 0.00% |  |
| D | 7262 | 6601 | 0 | 0 | 0.00% | 0.00% | 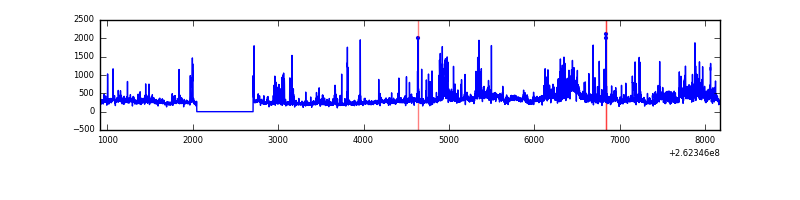 |
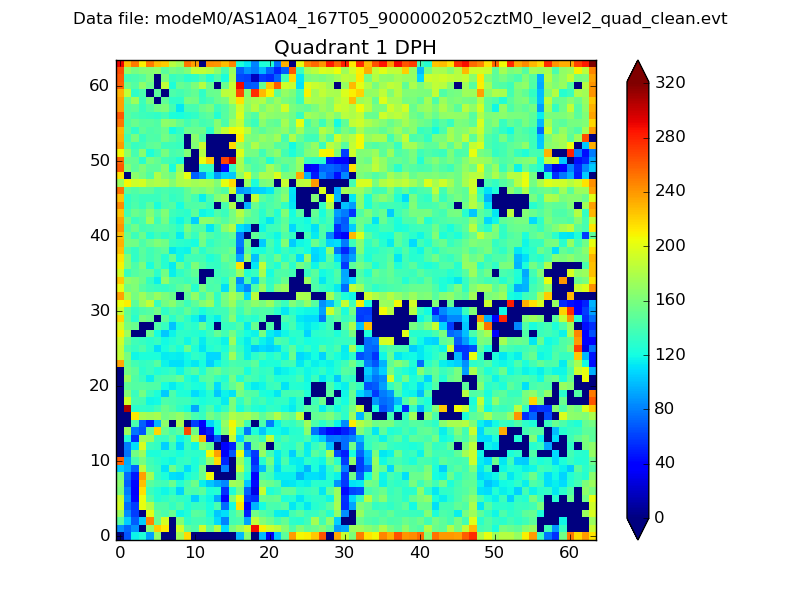
Top three noisy pixels from each quadrant. If the there are fewer than three noisy pixels in the level2.evt file, extra rows are filled as -1
| Pixel properties | Quadrant properties | ||||||
|---|---|---|---|---|---|---|---|
| Quadrant | DetID | PixID | Counts | Sigma | Mean | Median | Sigma |
| A | 14 | 188 | 376 | 11.13 | 94 | 88 | 25.9 |
| A | 0 | 29 | 331 | 9.39 | 94 | 88 | 25.9 |
| A | 14 | 204 | 309 | 8.54 | 94 | 88 | 25.9 |
| B | 2 | 9 | 311 | 10.05 | 92 | 87 | 22.3 |
| B | 5 | 232 | 257 | 7.62 | 92 | 87 | 22.3 |
| B | 5 | 225 | 254 | 7.49 | 92 | 87 | 22.3 |
| C | 12 | 241 | 281 | 7.19 | 94 | 88 | 26.9 |
| C | 7 | 111 | 258 | 6.33 | 94 | 88 | 26.9 |
| C | 3 | 126 | 245 | 5.85 | 94 | 88 | 26.9 |
| D | 4 | 246 | 257 | 6.9 | 87 | 79 | 25.8 |
| D | 6 | 231 | 230 | 5.85 | 87 | 79 | 25.8 |
| D | 15 | 142 | 228 | 5.77 | 87 | 79 | 25.8 |
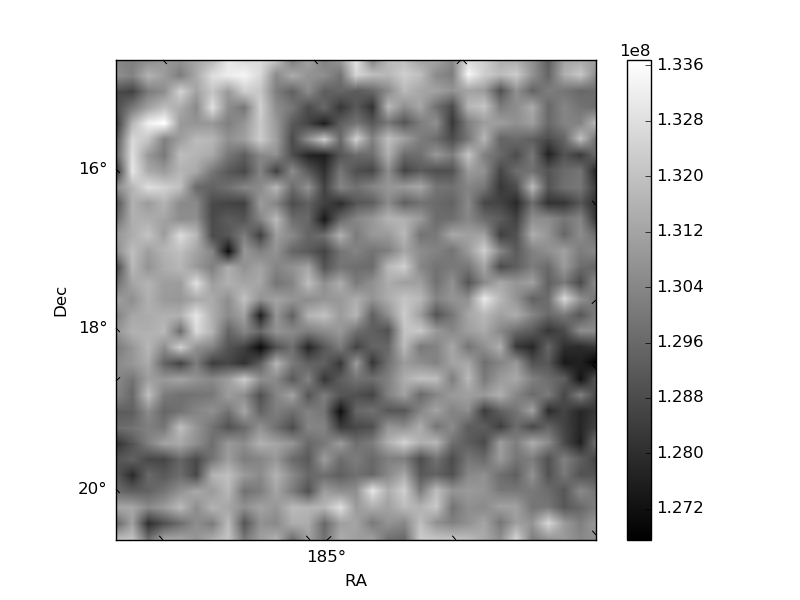
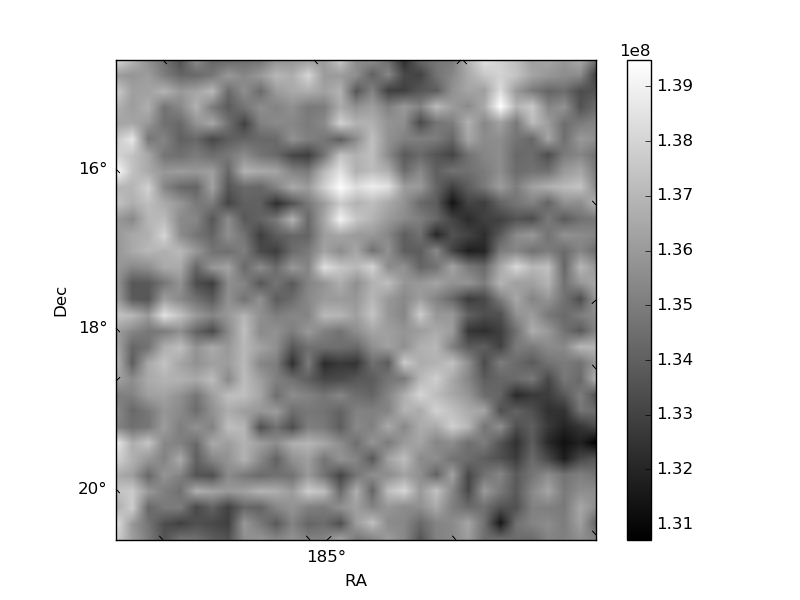
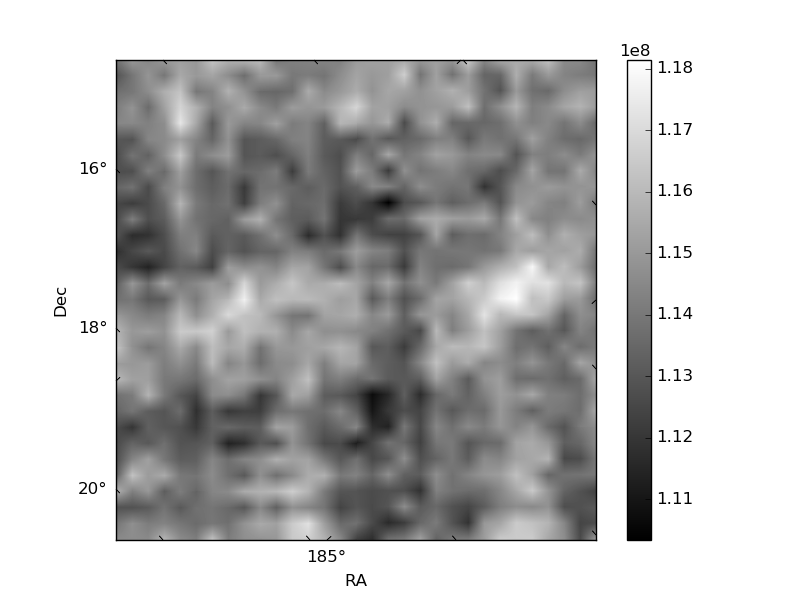
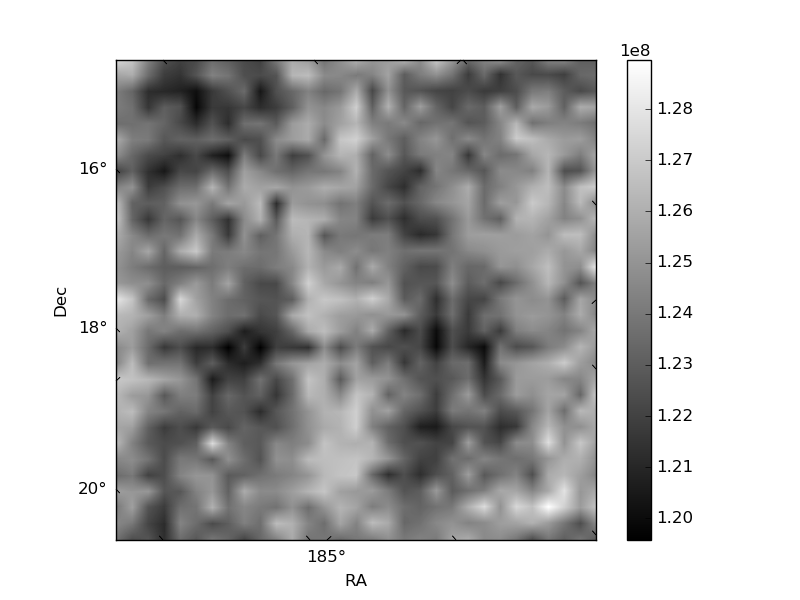
Histogram calculated using DETX and DETY for each event in the final _common_clean file
| Quadrant A | 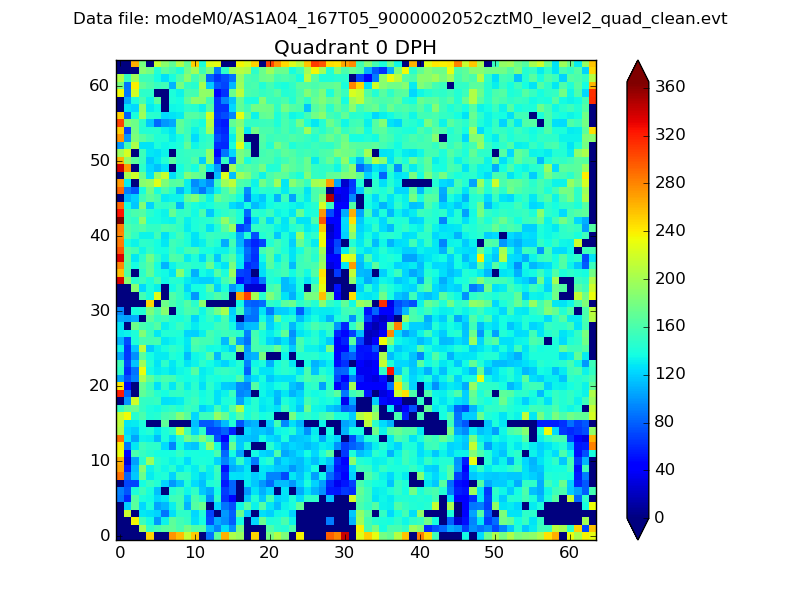 |
 |
Quadrant B |
|---|---|---|---|
| Quadrant D | 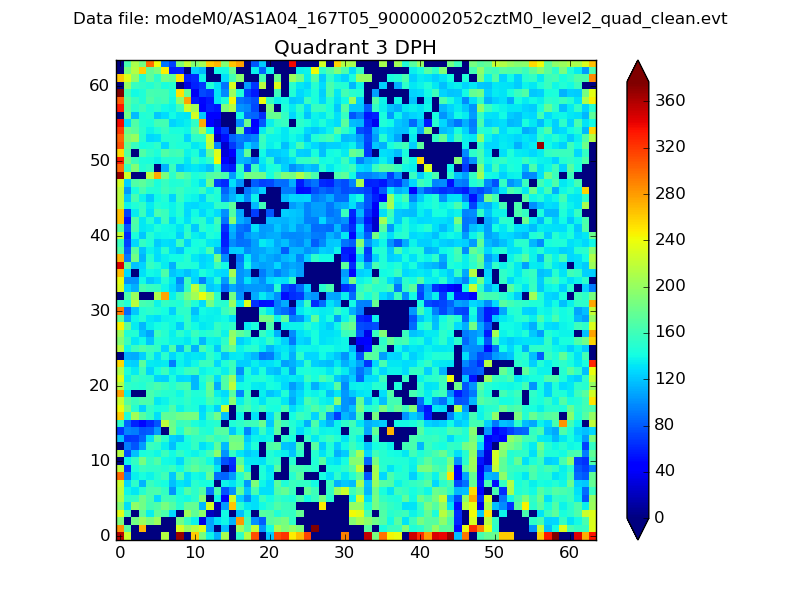 |
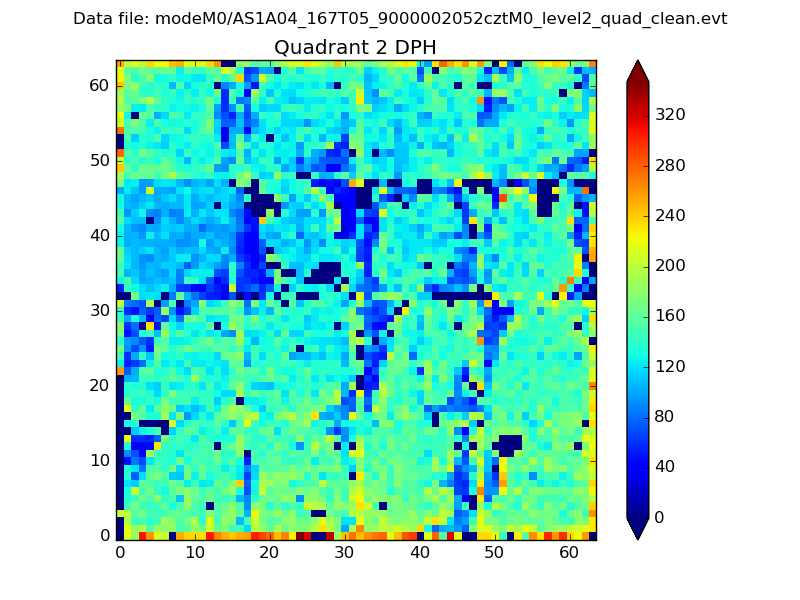 |
Quadrant C |
| Plot type | Count rate plots | Images |
|---|---|---|
| Comparison with Poisson distribution Blue bars denote a histogram of data divided into 1 sec bins. Red curve is a Poisson curve with rate = median count rate of data. |
 |
 |
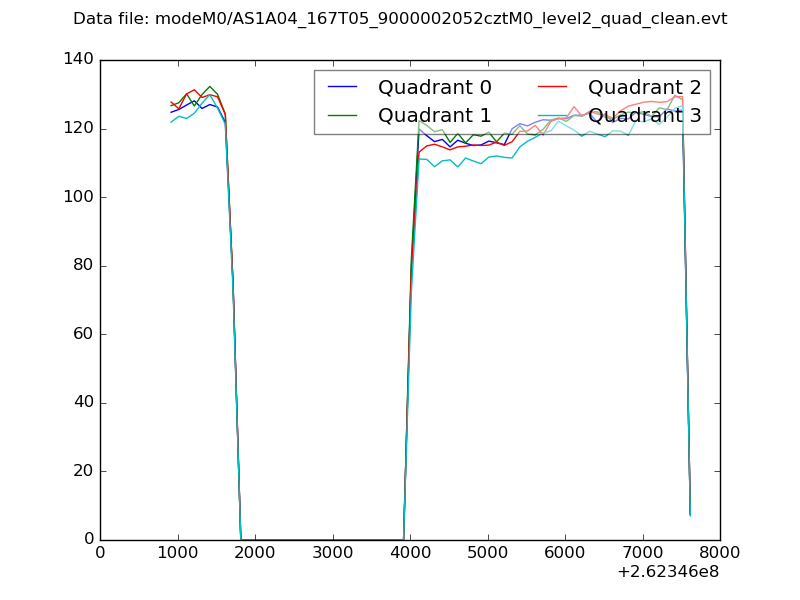
| Quadrant-wise count rates Data is divided into 100 sec bins |
 |
|
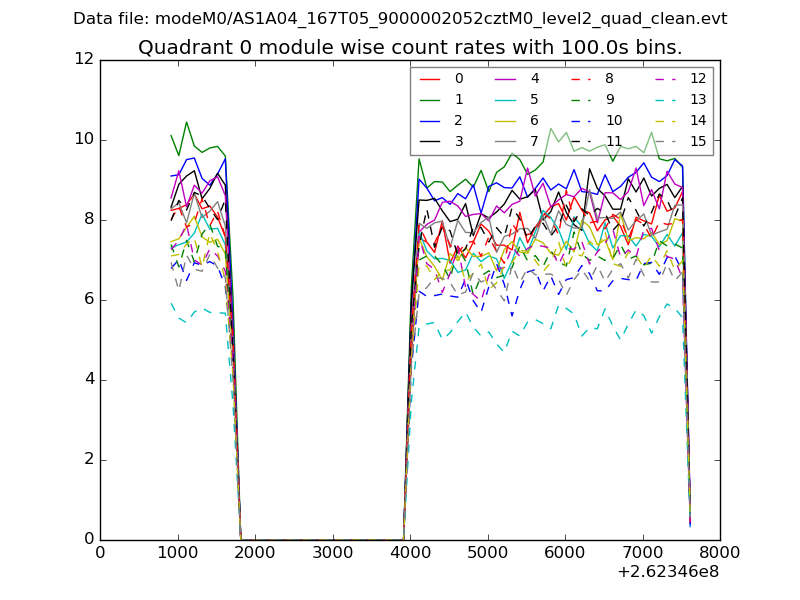
| Module-wise count rates for Quadrant A Data is divided into 100 sec bins |
 |
 |
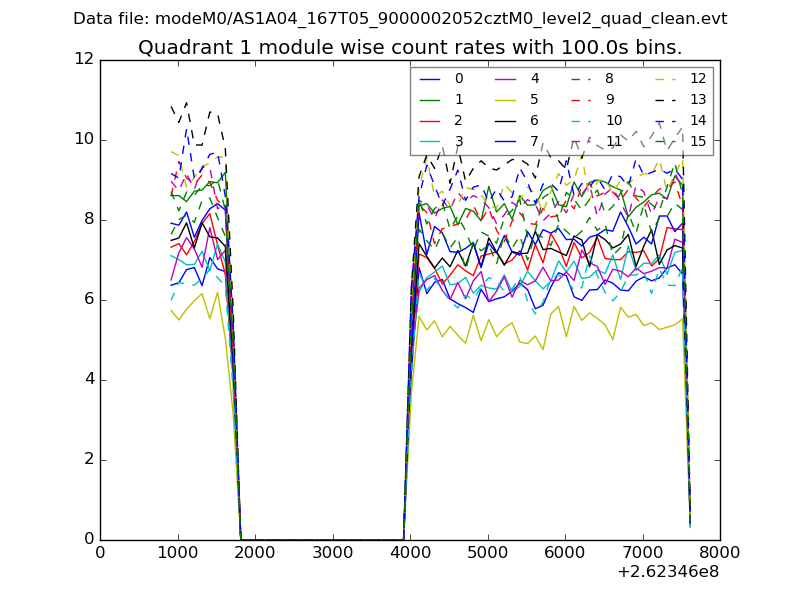
| Module-wise count rates for Quadrant B Data is divided into 100 sec bins |
 |
 |
| Module-wise count rates for Quadrant C Data is divided into 100 sec bins |
 |
 |
| Module-wise count rates for Quadrant D Data is divided into 100 sec bins |
 |
 |
| Parameter | Plot |
|---|---|
| CZT HV Monitor | 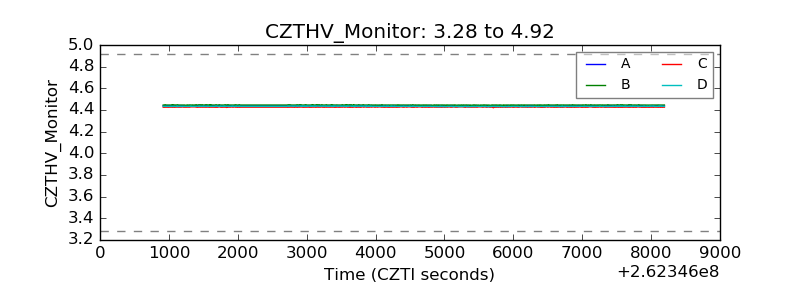 |
| D_VDD | 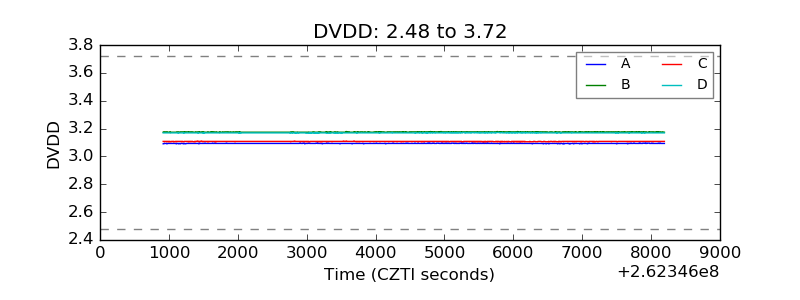 |
| Temperature 1 | 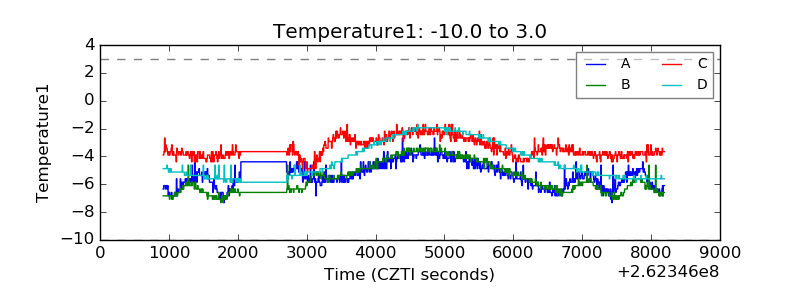 |
| Veto HV Monitor | 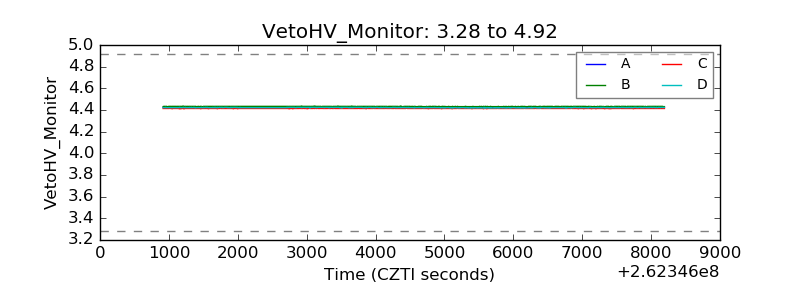 |
| Veto LLD | 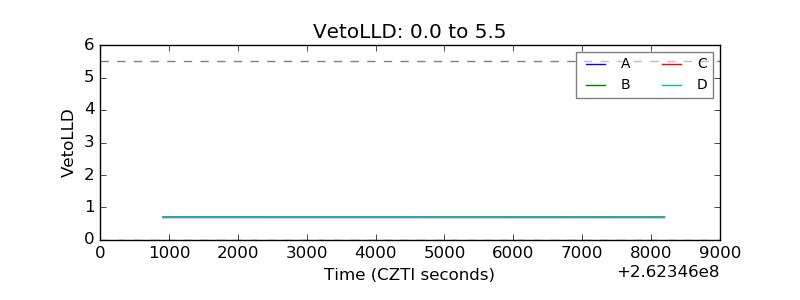 |
| Alpha Counter |  |
| _CPM_Rate | 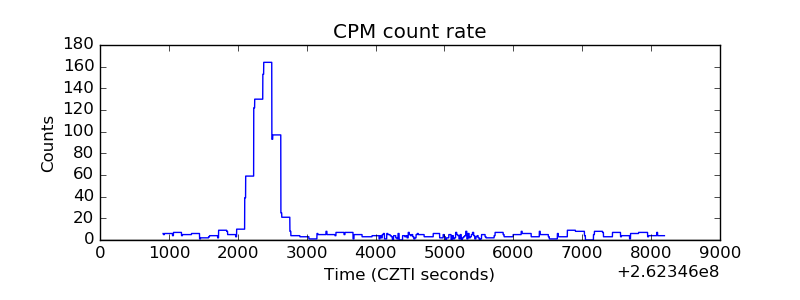 |
| CZT Counter | 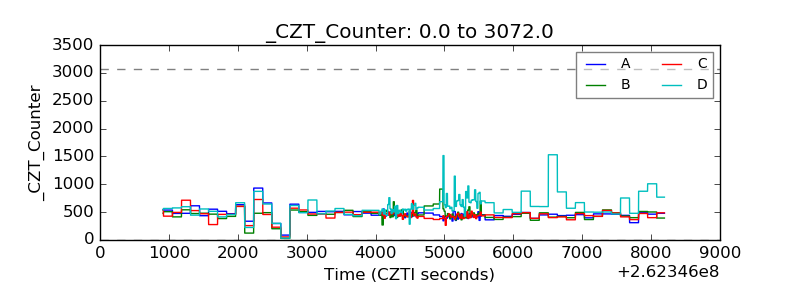 |
| +2.5 Volts monitor | 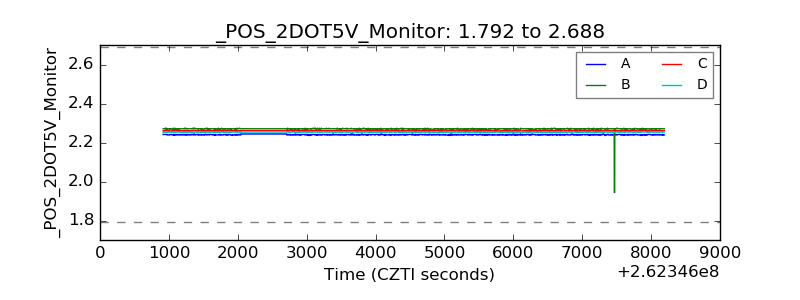 |
| +5 Volts monitor | 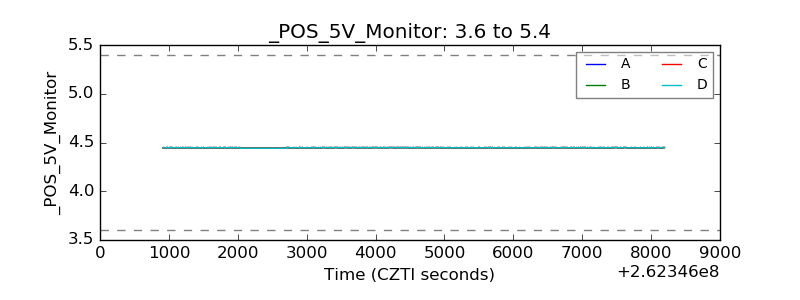 |
| _ROLL_ROT | 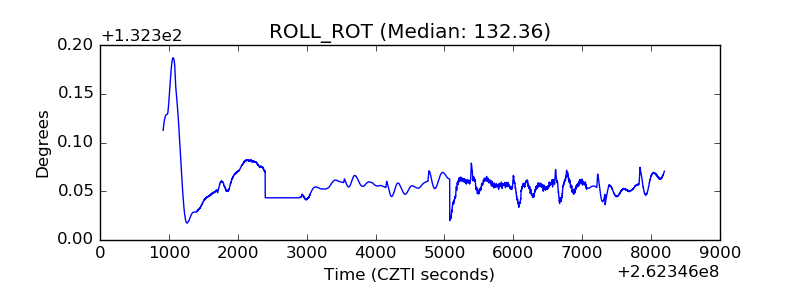 |
| _Roll_DEC | 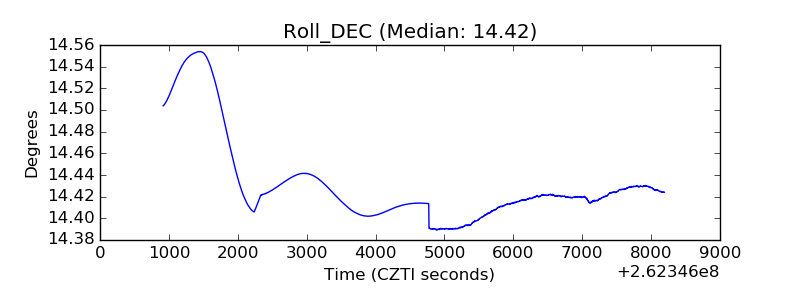 |
| _Roll_RA | 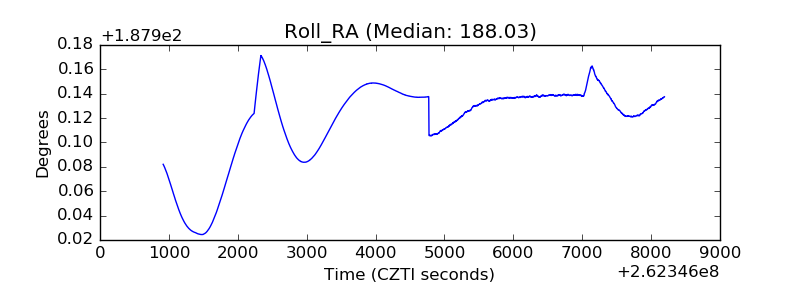 |
| Veto Counter | 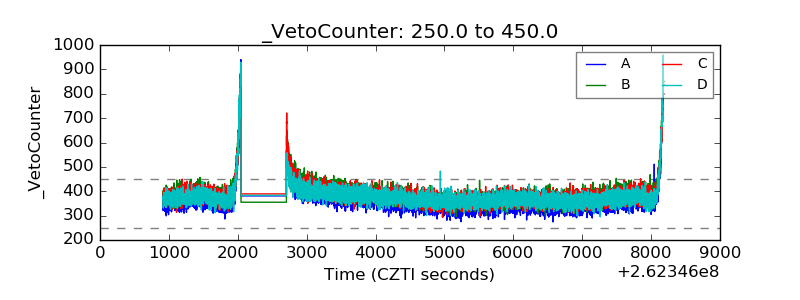 |