| Param | Original file | Final file |
|---|---|---|
| Filename | modeM0/AS1A04_219T01_9000002054cztM0_level2.fits | modeM0/AS1A04_219T01_9000002054cztM0_level2_quad_clean.evt |
| Size (bytes) | 269,637,120 | 201,035,520 |
| Size | 257.1 MB | 191.7 MB |
| Events in quadrant A | 1,673,656 | 1,113,560 |
| Events in quadrant B | 1,607,464 | 1,105,197 |
| Events in quadrant C | 1,652,338 | 1,077,494 |
| Events in quadrant D | 1,371,706 | 930,184 |
| Mode M0 | |||
|---|---|---|---|
| Quadrant | BADHDUFLAG | Total packets | Discarded packets |
| A | 0 | 57230 | 0 |
| B | 0 | 57273 | 0 |
| C | 0 | 57135 | 0 |
| D | 0 | 92753 | 0 |
| Mode SS | |||
|---|---|---|---|
| Quadrant | BADHDUFLAG | Total packets | Discarded packets |
| A | 0 | 552 | 0 |
| B | 0 | 552 | 0 |
| C | 0 | 552 | 0 |
| D | 0 | 552 | 0 |
| Mode M9 | |||
|---|---|---|---|
| Quadrant | BADHDUFLAG | Total packets | Discarded packets |
| A | 0 | 61 | 0 |
| B | 0 | 61 | 0 |
| C | 0 | 61 | 0 |
| D | 0 | 61 | 0 |
| Quadrant | Total seconds | Saturated seconds | Saturation percentage |
|---|---|---|---|
| A | 27053 | 300 | 1.108934% |
| B | 27053 | 341 | 1.260489% |
| C | 27053 | 255 | 0.942594% |
| D | 27053 | 1730 | 6.394855% |
Noise dominated data is calculated using 1-second bins in cleaned event files. If a bin has >2000 counts, and if more than 50% of those come from <1% of pixels, then it is considered to be noise-dominated and hence unusable.
| Quadrant | # 1 sec bins | Bins with >0 counts | Bins with >2000 counts | High rate bins dominated by noise | Noise dominated (total time) | Noise dominated (detector-on time) | Marked lightcurve |
|---|---|---|---|---|---|---|---|
| A | 32867 | 27047 | 0 | 0 | 0.00% | 0.00% |  |
| B | 32866 | 27046 | 0 | 0 | 0.00% | 0.00% |  |
| C | 32867 | 27047 | 0 | 0 | 0.00% | 0.00% |  |
| D | 32867 | 26991 | 0 | 0 | 0.00% | 0.00% |  |
Top three noisy pixels from each quadrant. If the there are fewer than three noisy pixels in the level2.evt file, extra rows are filled as -1
| Pixel properties | Quadrant properties | ||||||
|---|---|---|---|---|---|---|---|
| Quadrant | DetID | PixID | Counts | Sigma | Mean | Median | Sigma |
| A | 0 | 29 | 1587 | 10.7 | 436 | 408 | 110.2 |
| A | 7 | 110 | 1296 | 8.06 | 436 | 408 | 110.2 |
| A | 0 | 30 | 1246 | 7.6 | 436 | 408 | 110.2 |
| B | 2 | 9 | 1450 | 12.34 | 422 | 403 | 84.8 |
| B | 3 | 17 | 1105 | 8.28 | 422 | 403 | 84.8 |
| B | 5 | 225 | 1095 | 8.16 | 422 | 403 | 84.8 |
| C | 1 | 80 | 1253 | 7.42 | 435 | 408 | 113.9 |
| C | 1 | 81 | 1228 | 7.2 | 435 | 408 | 113.9 |
| C | 1 | 65 | 1140 | 6.42 | 435 | 408 | 113.9 |
| D | 6 | 231 | 1005 | 5.99 | 392 | 357 | 108.2 |
| D | 7 | 3 | 994 | 5.89 | 392 | 357 | 108.2 |
| D | 6 | 67 | 959 | 5.56 | 392 | 357 | 108.2 |
Histogram calculated using DETX and DETY for each event in the final _common_clean file
| Quadrant A |  |
 |
Quadrant B |
|---|---|---|---|
| Quadrant D |  |
 |
Quadrant C |
| Plot type | Count rate plots | Images |
|---|---|---|
| Comparison with Poisson distribution Blue bars denote a histogram of data divided into 1 sec bins. Red curve is a Poisson curve with rate = median count rate of data. |
 |
 |
| Quadrant-wise count rates Data is divided into 100 sec bins |
 |
|
| Module-wise count rates for Quadrant A Data is divided into 100 sec bins |
 |
 |
| Module-wise count rates for Quadrant B Data is divided into 100 sec bins |
 |
 |
| Module-wise count rates for Quadrant C Data is divided into 100 sec bins |
 |
 |
| Module-wise count rates for Quadrant D Data is divided into 100 sec bins |
 |
 |
| Parameter | Plot |
|---|---|
| CZT HV Monitor |  |
| D_VDD | 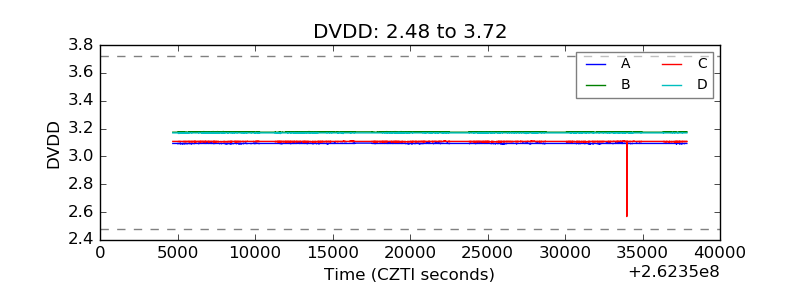 |
| Temperature 1 |  |
| Veto HV Monitor |  |
| Veto LLD |  |
| Alpha Counter |  |
| _CPM_Rate |  |
| CZT Counter |  |
| +2.5 Volts monitor |  |
| +5 Volts monitor |  |
| _ROLL_ROT |  |
| _Roll_DEC |  |
| _Roll_RA |  |
| Veto Counter |  |