| Param | Original file | Final file |
|---|---|---|
| Filename | modeM0/AS1A04_219T01_9000002054_13918cztM0_level2.evt | modeM0/AS1A04_219T01_9000002054_13918cztM0_level2_quad_clean.evt |
| Size (bytes) | 137,102,400 | 15,076,800 |
| Size | 130.8 MB | 14.4 MB |
| Events in quadrant A | 826,172 | 87,388 |
| Events in quadrant B | 814,024 | 89,387 |
| Events in quadrant C | 808,219 | 84,741 |
| Events in quadrant D | 1,594,791 | 78,502 |
| Mode M0 | |||
|---|---|---|---|
| Quadrant | BADHDUFLAG | Total packets | Discarded packets |
| A | 0 | 3323 | 2 |
| B | 0 | 3274 | 1 |
| C | 0 | 3269 | 1 |
| D | 0 | 5855 | 1 |
| Mode SS | |||
|---|---|---|---|
| Quadrant | BADHDUFLAG | Total packets | Discarded packets |
| A | 0 | 30 | 0 |
| B | 0 | 30 | 0 |
| C | 0 | 30 | 0 |
| D | 0 | 30 | 0 |
| Mode M9 | |||
|---|---|---|---|
| Quadrant | BADHDUFLAG | Total packets | Discarded packets |
| A | 0 | 4 | 0 |
| B | 0 | 4 | 0 |
| C | 0 | 4 | 0 |
| D | 0 | 4 | 0 |
| Quadrant | Total seconds | Saturated seconds | Saturation percentage |
|---|---|---|---|
| A | 1573 | 7 | 0.445010% |
| B | 1573 | 7 | 0.445010% |
| C | 1573 | 5 | 0.317864% |
| D | 1573 | 74 | 4.704387% |
Noise dominated data is calculated using 1-second bins in cleaned event files. If a bin has >2000 counts, and if more than 50% of those come from <1% of pixels, then it is considered to be noise-dominated and hence unusable.
| Quadrant | # 1 sec bins | Bins with >0 counts | Bins with >2000 counts | High rate bins dominated by noise | Noise dominated (total time) | Noise dominated (detector-on time) | Marked lightcurve |
|---|---|---|---|---|---|---|---|
| A | 1574 | 1574 | 0 | 0 | 0.00% | 0.00% | 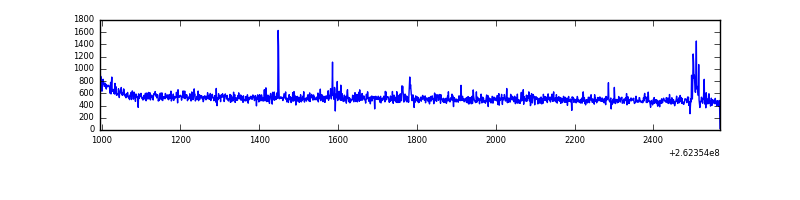 |
| B | 1574 | 1574 | 1 | 1 | 0.06% | 0.06% | 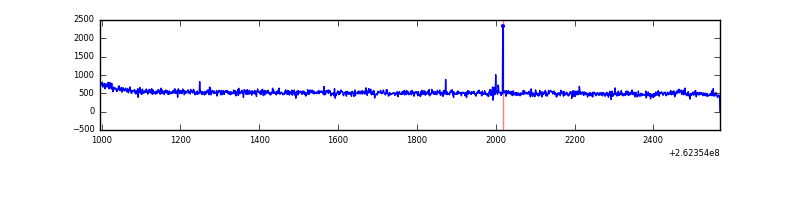 |
| C | 1574 | 1574 | 0 | 0 | 0.00% | 0.00% | 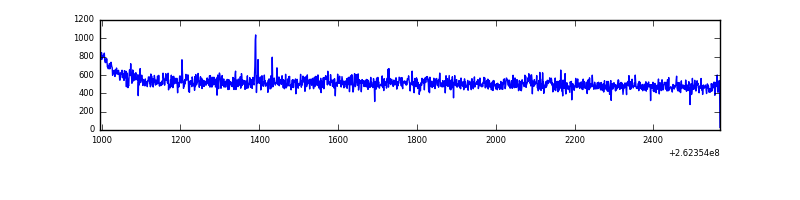 |
| D | 1574 | 1574 | 27 | 27 | 1.72% | 1.72% | 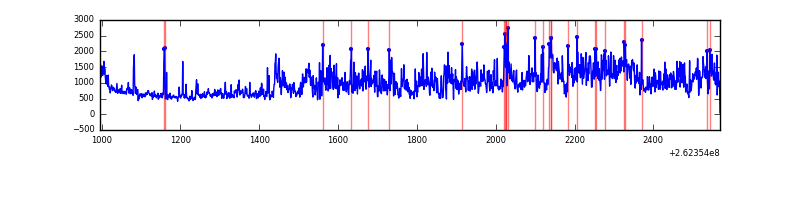 |
Top three noisy pixels from each quadrant. If the there are fewer than three noisy pixels in the level2.evt file, extra rows are filled as -1
| Pixel properties | Quadrant properties | ||||||
|---|---|---|---|---|---|---|---|
| Quadrant | DetID | PixID | Counts | Sigma | Mean | Median | Sigma |
| A | 9 | 143 | 15862 | 348.56 | 209 | 203 | 44.9 |
| A | 1 | 162 | 2874 | 59.45 | 209 | 203 | 44.9 |
| A | 15 | 69 | 2537 | 51.95 | 209 | 203 | 44.9 |
| B | 12 | 111 | 4926 | 112.76 | 205 | 199 | 41.9 |
| B | 0 | 219 | 4904 | 112.23 | 205 | 199 | 41.9 |
| B | 11 | 111 | 4371 | 99.52 | 205 | 199 | 41.9 |
| C | 3 | 233 | 31730 | 653.44 | 199 | 200 | 48.3 |
| C | 13 | 61 | 1361 | 24.06 | 199 | 200 | 48.3 |
| C | 3 | 202 | 483 | 5.86 | 199 | 200 | 48.3 |
| D | 1 | 52 | 767107 | 15767.76 | 197 | 191 | 48.6 |
| D | 13 | 122 | 50237 | 1028.93 | 197 | 191 | 48.6 |
| D | 7 | 223 | 6558 | 130.9 | 197 | 191 | 48.6 |
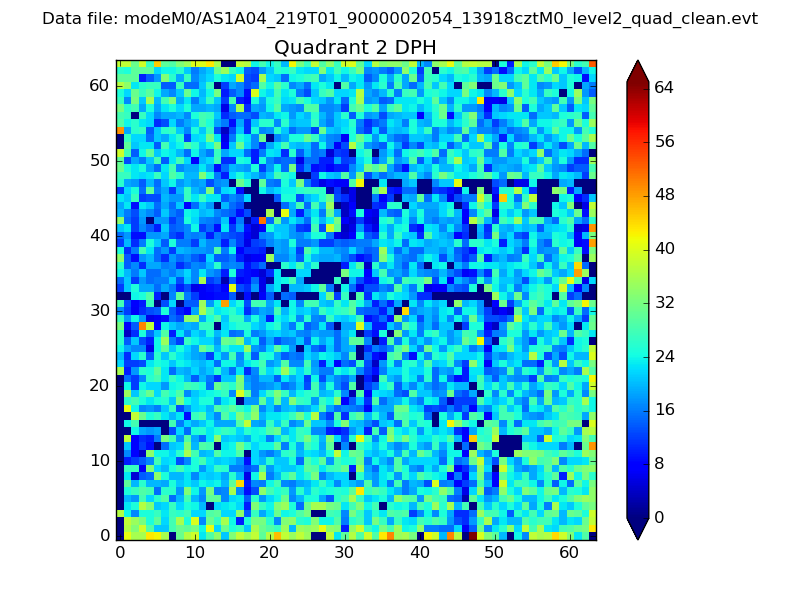
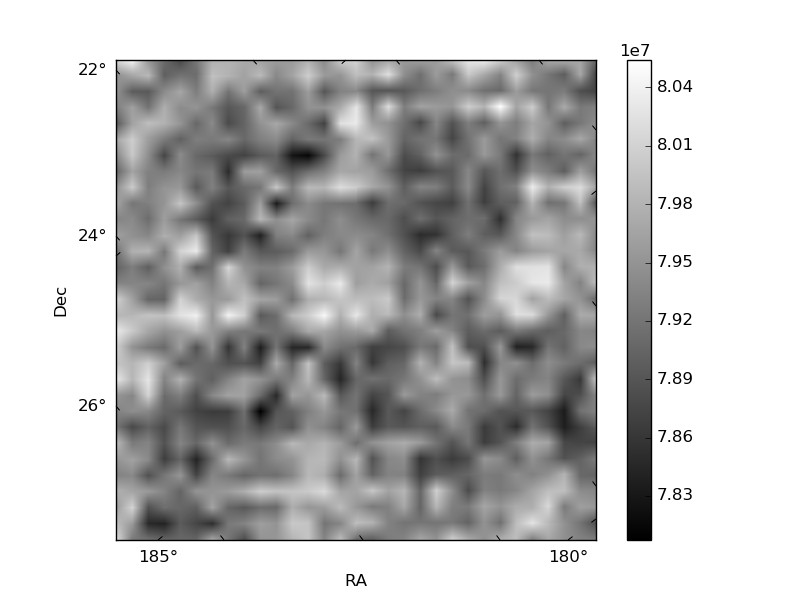
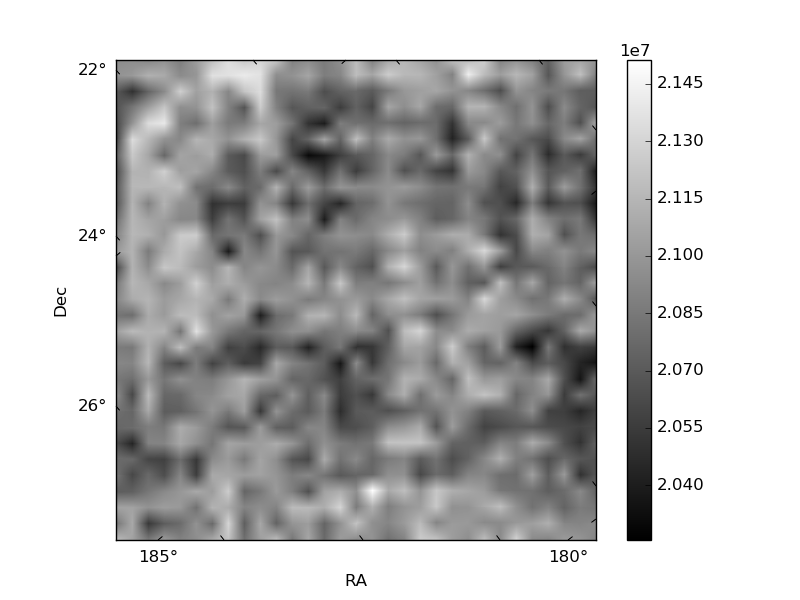
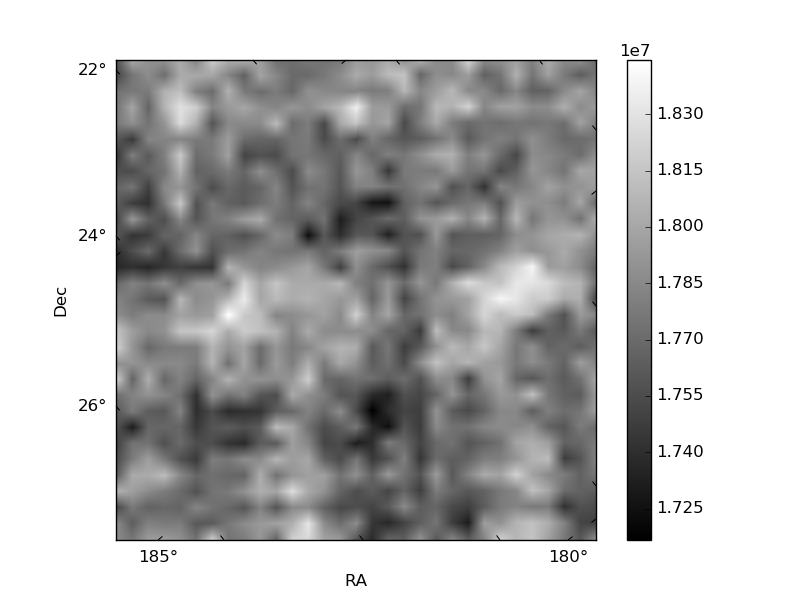
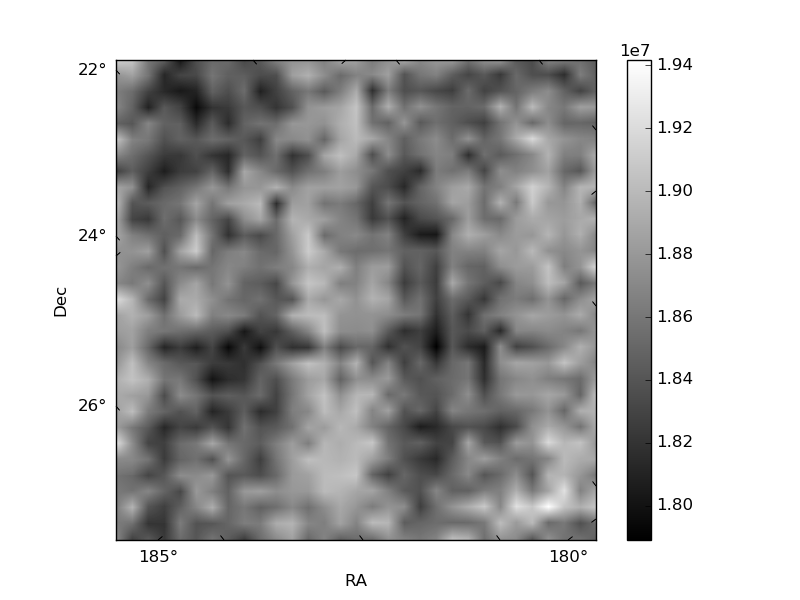
Histogram calculated using DETX and DETY for each event in the final _common_clean file
| Quadrant A | 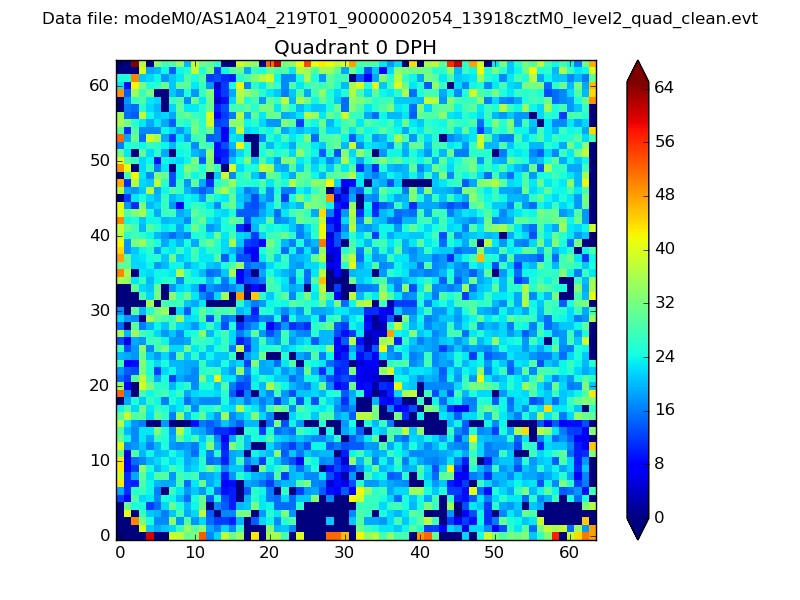 |
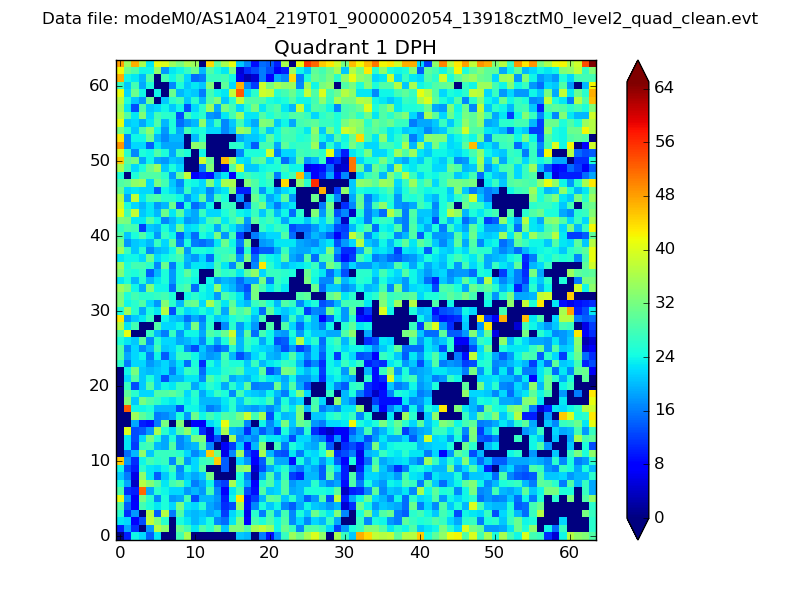 |
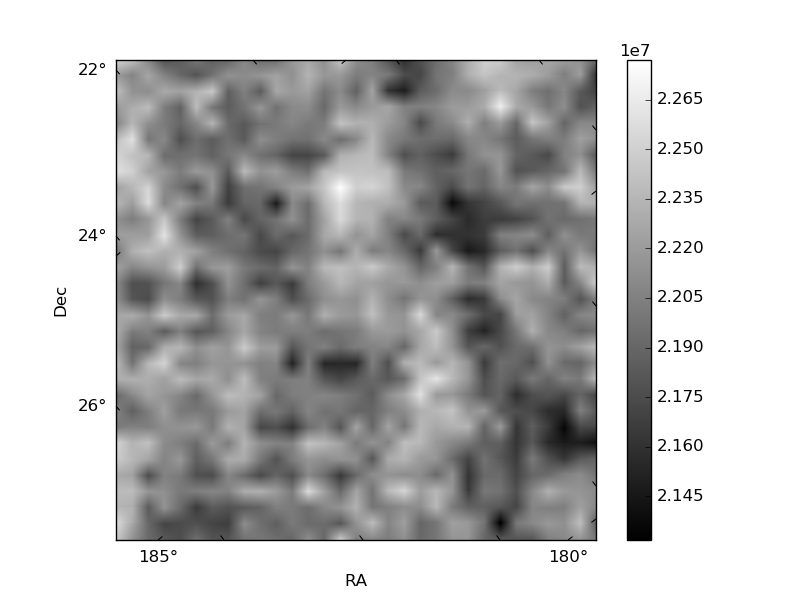
Quadrant B |
|---|---|---|---|
| Quadrant D | 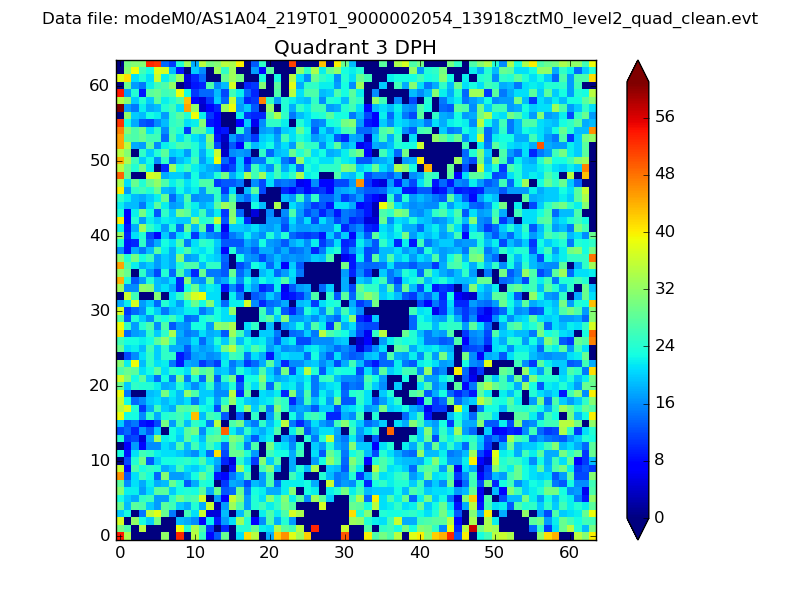 |
 |
Quadrant C |
| Plot type | Count rate plots | Images |
|---|---|---|
| Comparison with Poisson distribution Blue bars denote a histogram of data divided into 1 sec bins. Red curve is a Poisson curve with rate = median count rate of data. |
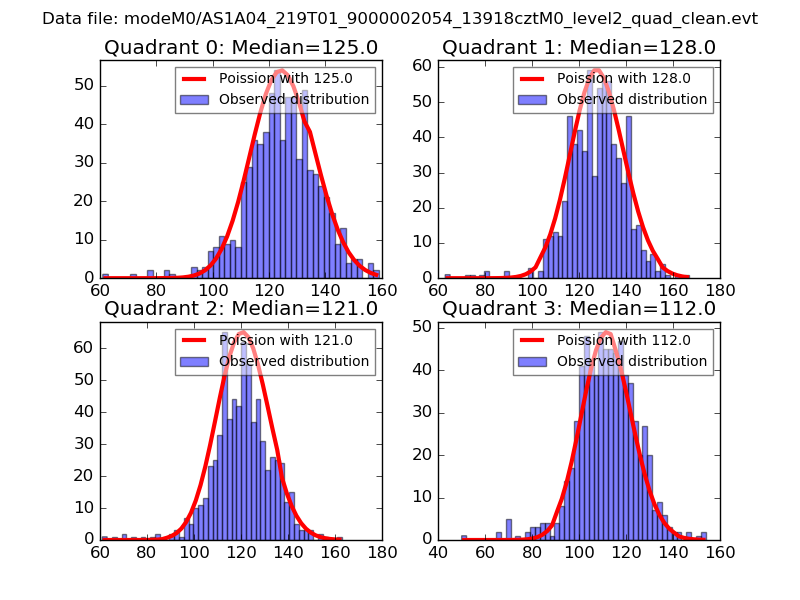 |
 |
| Quadrant-wise count rates Data is divided into 100 sec bins |
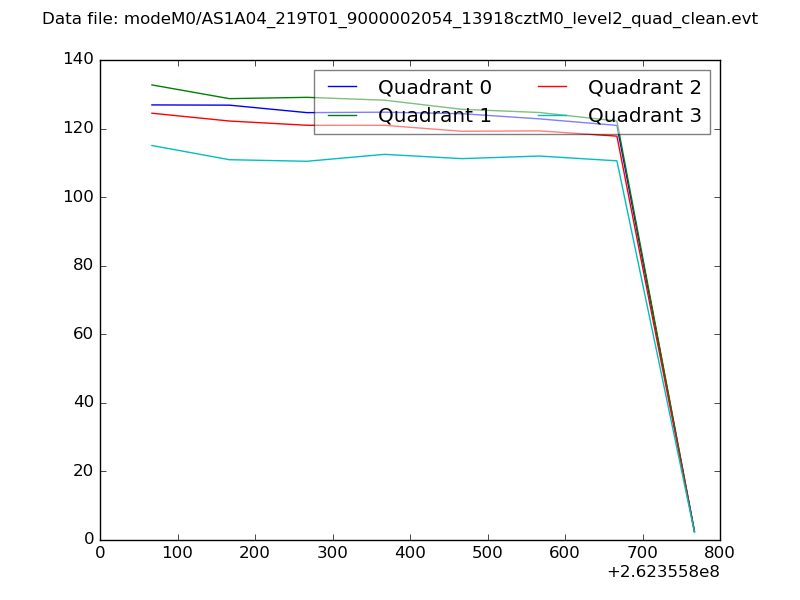 |
|
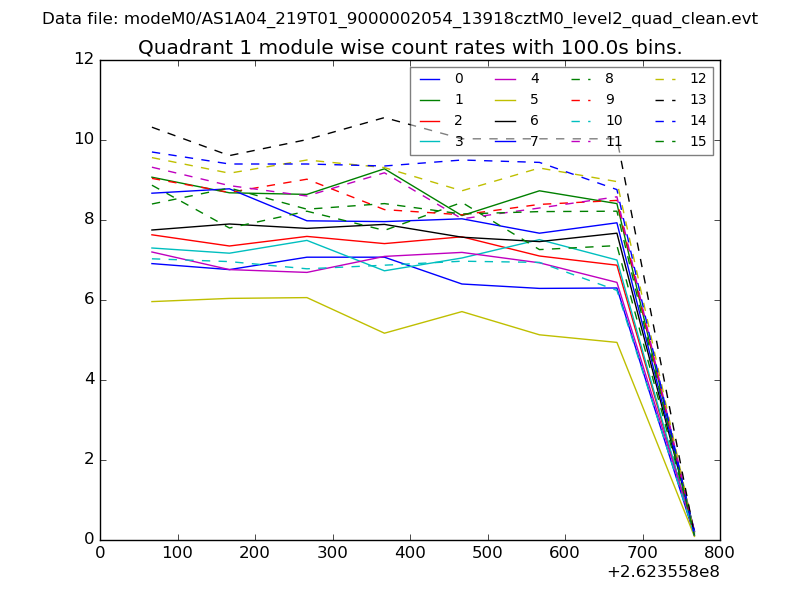
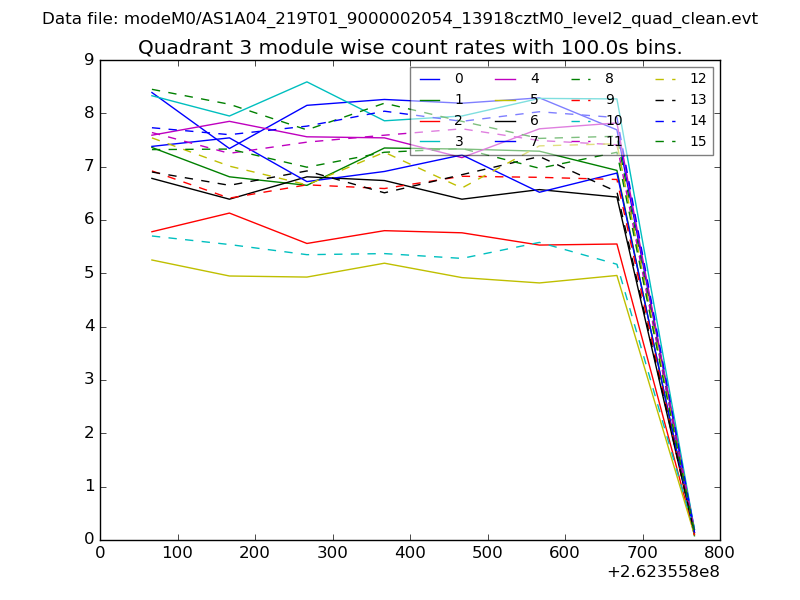
| Module-wise count rates for Quadrant A Data is divided into 100 sec bins |
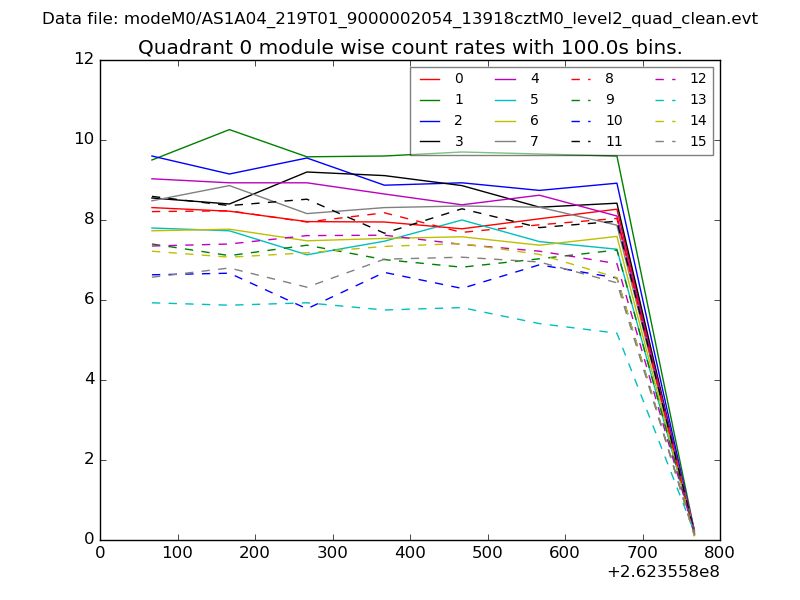 |
 |
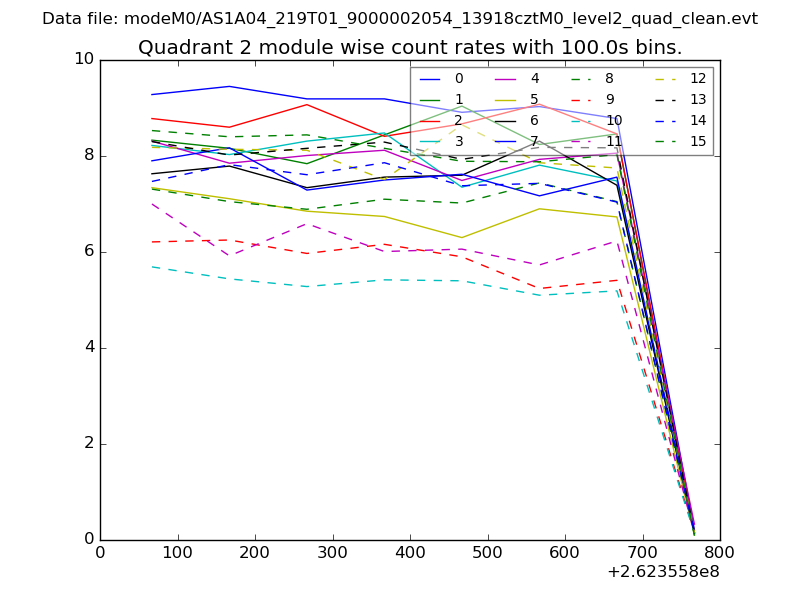
| Module-wise count rates for Quadrant B Data is divided into 100 sec bins |
 |
 |
| Module-wise count rates for Quadrant C Data is divided into 100 sec bins |
 |
 |
| Module-wise count rates for Quadrant D Data is divided into 100 sec bins |
 |
 |
| Parameter | Plot |
|---|---|
| CZT HV Monitor | 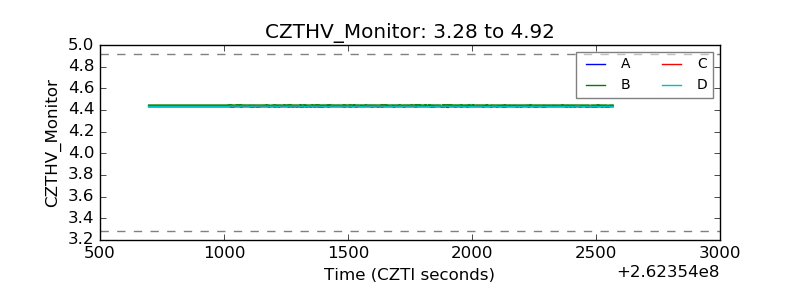 |
| D_VDD | 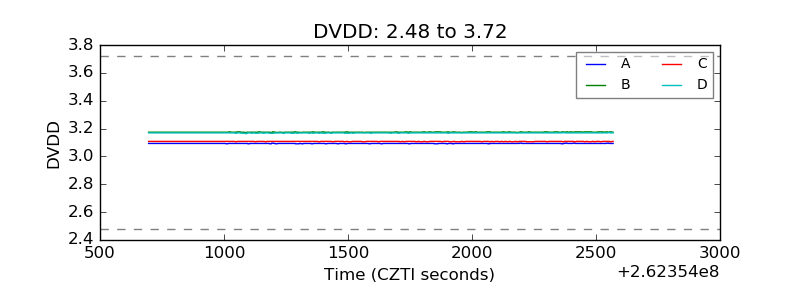 |
| Temperature 1 | 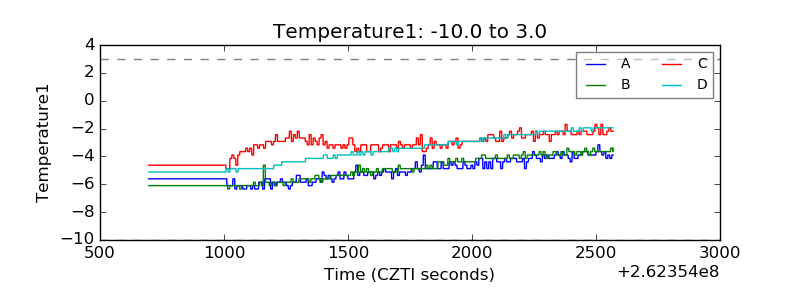 |
| Veto HV Monitor | 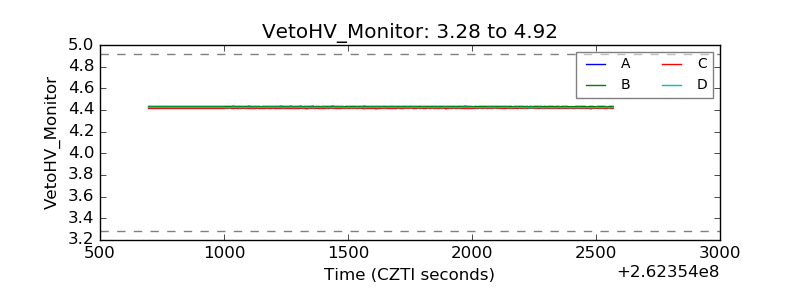 |
| Veto LLD | 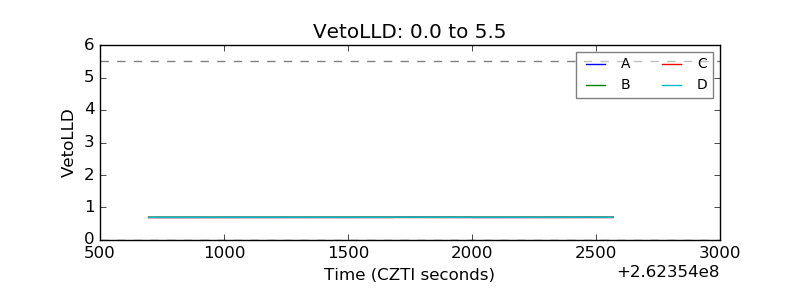 |
| Alpha Counter | 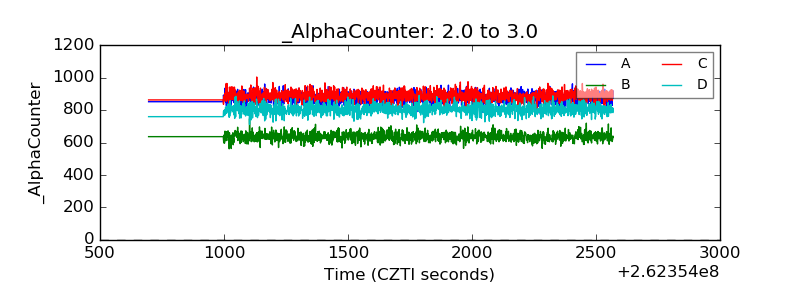 |
| _CPM_Rate | 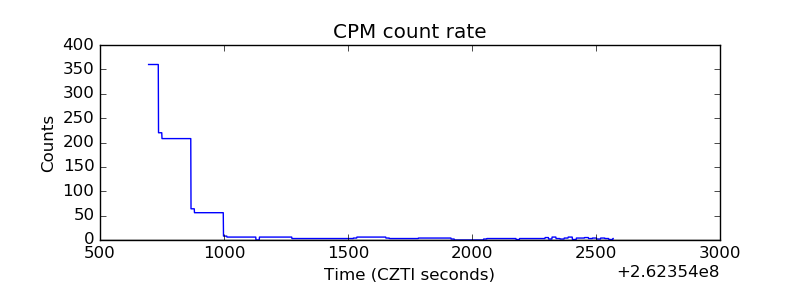 |
| CZT Counter | 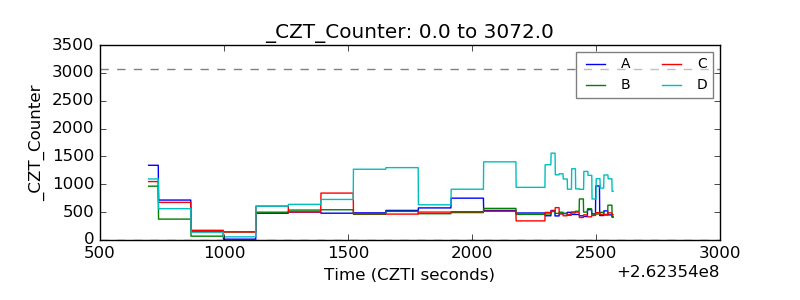 |
| +2.5 Volts monitor |  |
| +5 Volts monitor |  |
| _ROLL_ROT |  |
| _Roll_DEC |  |
| _Roll_RA | 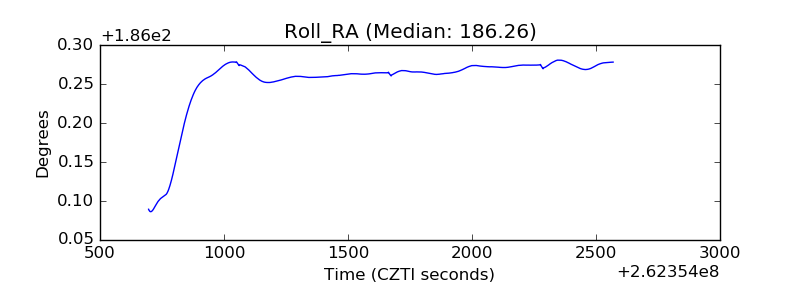 |
| Veto Counter | 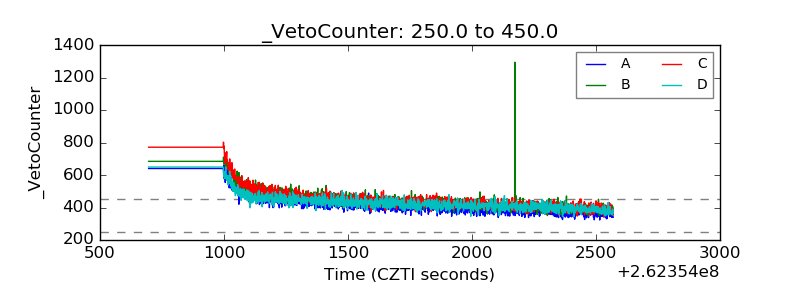 |