| Param | Original file | Final file |
|---|---|---|
| Filename | modeM0/AS1A04_219T01_9000002054_13919cztM0_level2.evt | modeM0/AS1A04_219T01_9000002054_13919cztM0_level2_quad_clean.evt |
| Size (bytes) | 471,490,560 | 83,998,080 |
| Size | 449.6 MB | 80.1 MB |
| Events in quadrant A | 2,724,650 | 549,695 |
| Events in quadrant B | 2,797,623 | 555,623 |
| Events in quadrant C | 2,727,580 | 547,444 |
| Events in quadrant D | 5,639,766 | 489,626 |
| Mode M0 | |||
|---|---|---|---|
| Quadrant | BADHDUFLAG | Total packets | Discarded packets |
| A | 0 | 11925 | 2 |
| B | 0 | 11959 | 1 |
| C | 0 | 11791 | 1 |
| D | 0 | 20616 | 1 |
| Mode SS | |||
|---|---|---|---|
| Quadrant | BADHDUFLAG | Total packets | Discarded packets |
| A | 0 | 118 | 0 |
| B | 0 | 118 | 0 |
| C | 0 | 118 | 0 |
| D | 0 | 118 | 0 |
| Mode M9 | |||
|---|---|---|---|
| Quadrant | BADHDUFLAG | Total packets | Discarded packets |
| A | 0 | 9 | 0 |
| B | 0 | 9 | 0 |
| C | 0 | 9 | 0 |
| D | 0 | 9 | 0 |
| Quadrant | Total seconds | Saturated seconds | Saturation percentage |
|---|---|---|---|
| A | 5733 | 52 | 0.907029% |
| B | 5733 | 51 | 0.889587% |
| C | 5733 | 33 | 0.575615% |
| D | 5733 | 560 | 9.768010% |
Noise dominated data is calculated using 1-second bins in cleaned event files. If a bin has >2000 counts, and if more than 50% of those come from <1% of pixels, then it is considered to be noise-dominated and hence unusable.
| Quadrant | # 1 sec bins | Bins with >0 counts | Bins with >2000 counts | High rate bins dominated by noise | Noise dominated (total time) | Noise dominated (detector-on time) | Marked lightcurve |
|---|---|---|---|---|---|---|---|
| A | 6709 | 5734 | 3 | 3 | 0.04% | 0.05% | 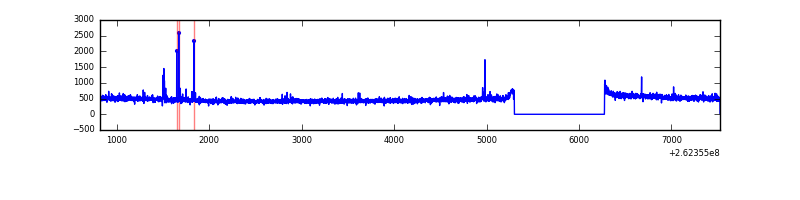 |
| B | 6709 | 5734 | 3 | 3 | 0.04% | 0.05% | 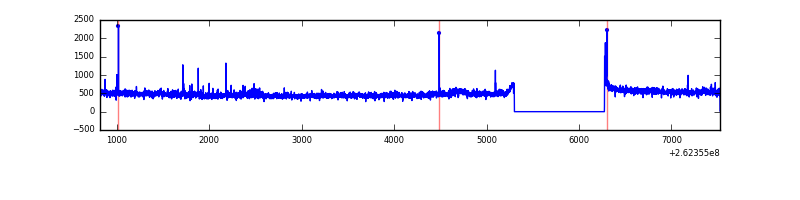 |
| C | 6709 | 5734 | 0 | 0 | 0.00% | 0.00% | 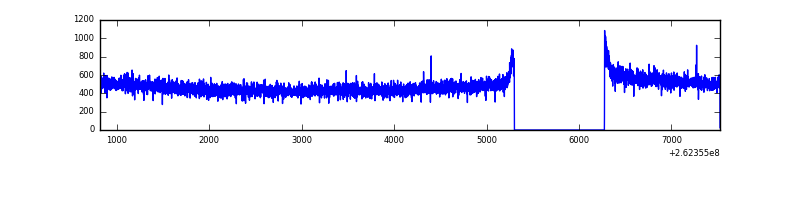 |
| D | 6709 | 5734 | 454 | 454 | 6.77% | 7.92% | 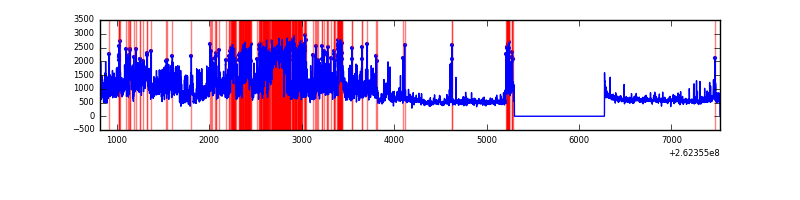 |
Top three noisy pixels from each quadrant. If the there are fewer than three noisy pixels in the level2.evt file, extra rows are filled as -1
| Pixel properties | Quadrant properties | ||||||
|---|---|---|---|---|---|---|---|
| Quadrant | DetID | PixID | Counts | Sigma | Mean | Median | Sigma |
| A | 9 | 143 | 24458 | 168.23 | 695 | 679 | 141.3 |
| A | 1 | 162 | 8999 | 58.86 | 695 | 679 | 141.3 |
| A | 15 | 69 | 8988 | 58.78 | 695 | 679 | 141.3 |
| B | 10 | 244 | 35415 | 260.21 | 687 | 670 | 133.5 |
| B | 4 | 173 | 25637 | 186.98 | 687 | 670 | 133.5 |
| B | 12 | 111 | 15958 | 114.5 | 687 | 670 | 133.5 |
| C | 3 | 233 | 91514 | 573.04 | 676 | 679 | 158.5 |
| C | 13 | 61 | 4804 | 26.02 | 676 | 679 | 158.5 |
| C | 3 | 202 | 1620 | 5.94 | 676 | 679 | 158.5 |
| D | 1 | 52 | 2708752 | 17642.28 | 644 | 627 | 153.5 |
| D | 13 | 122 | 347217 | 2257.89 | 644 | 627 | 153.5 |
| D | 13 | 189 | 65510 | 422.69 | 644 | 627 | 153.5 |
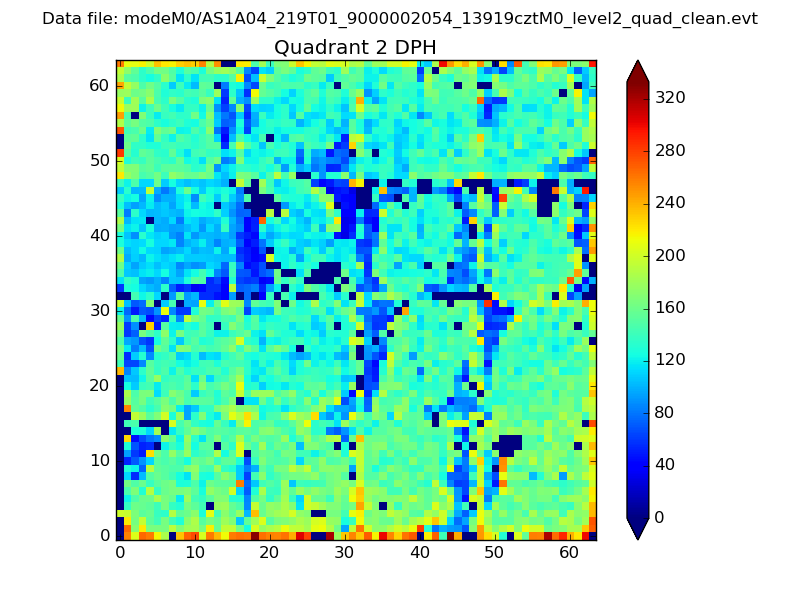
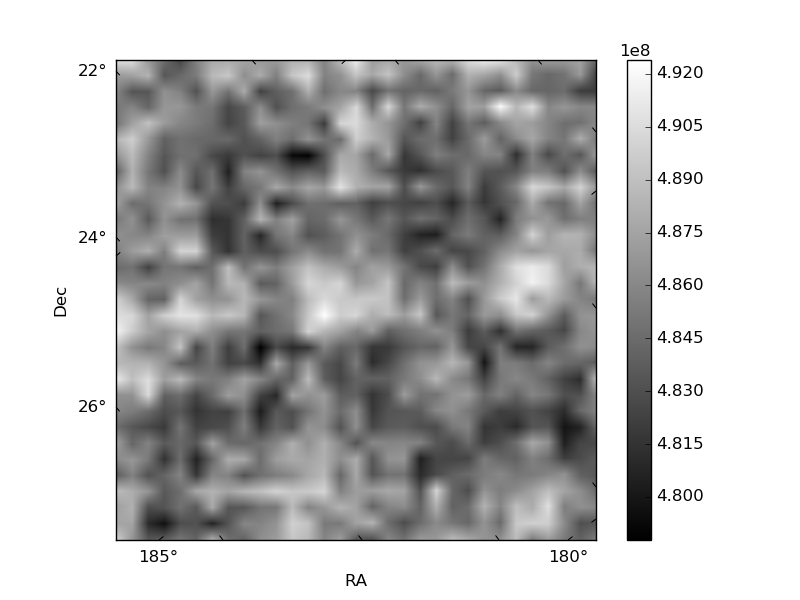
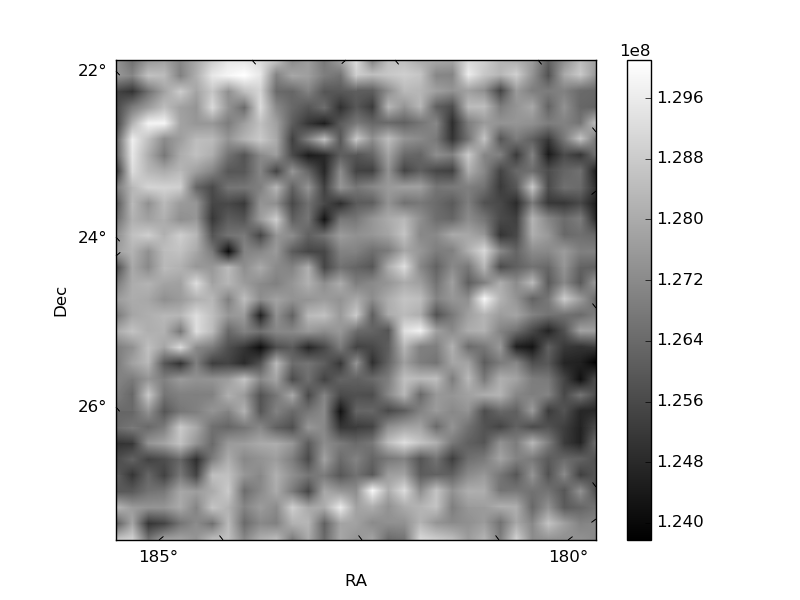
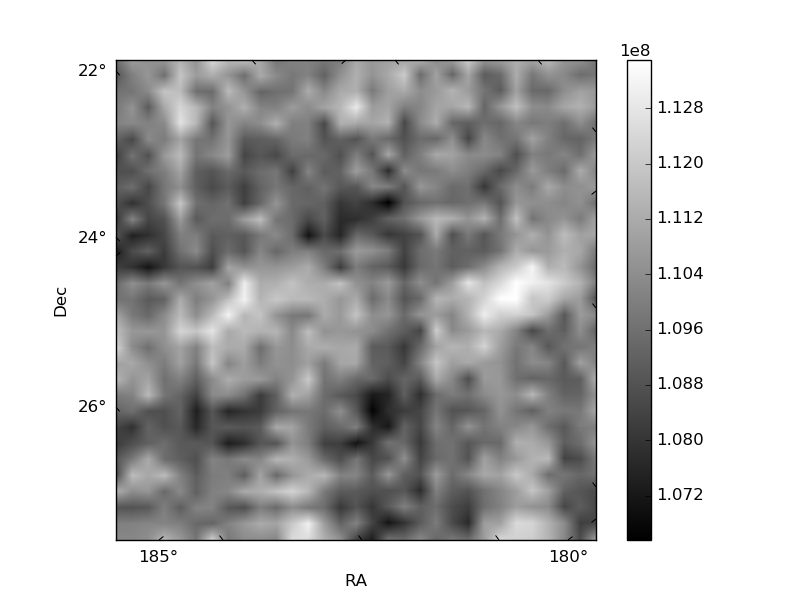
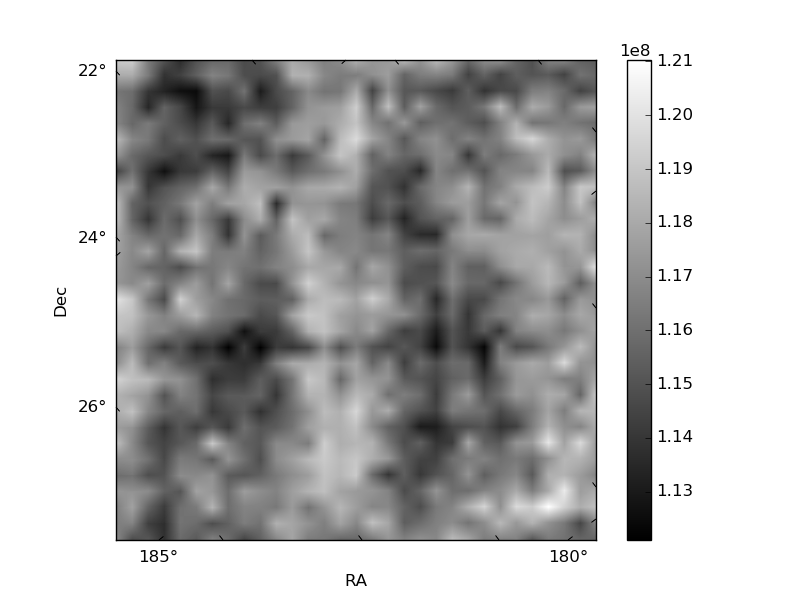
Histogram calculated using DETX and DETY for each event in the final _common_clean file
| Quadrant A | 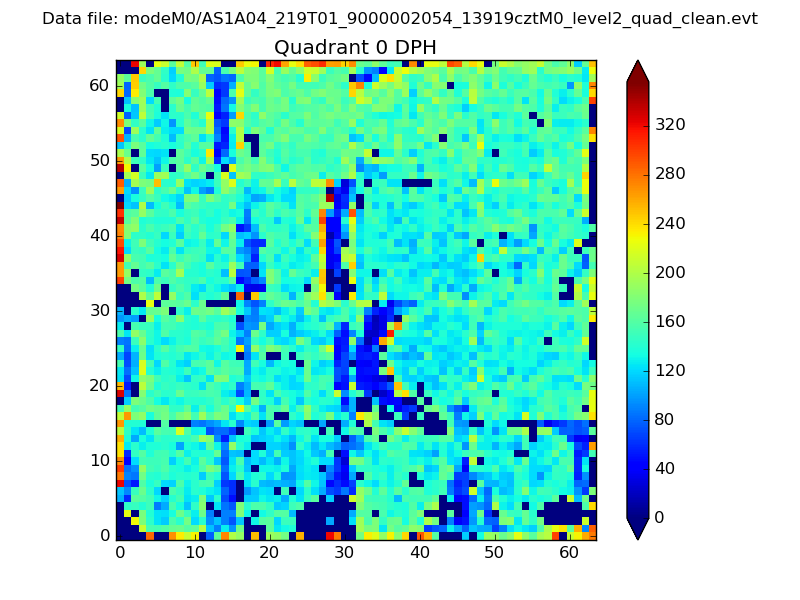 |
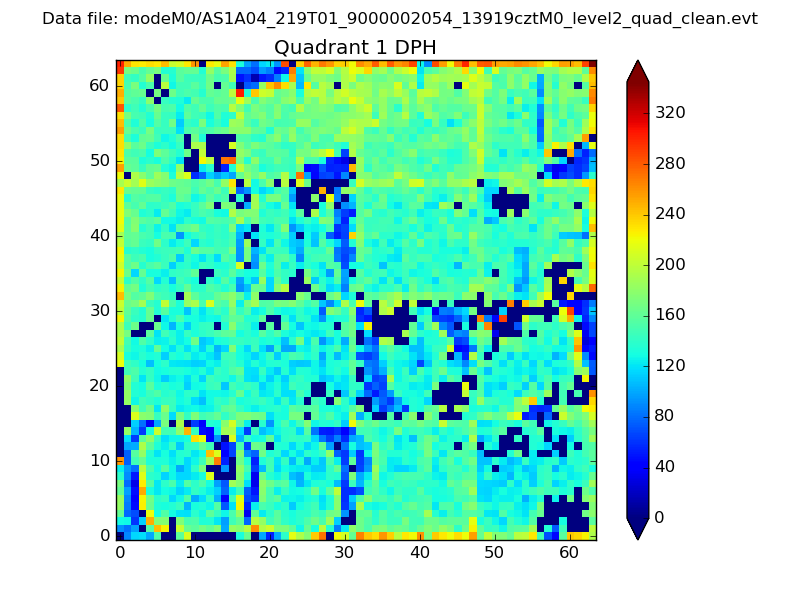 |
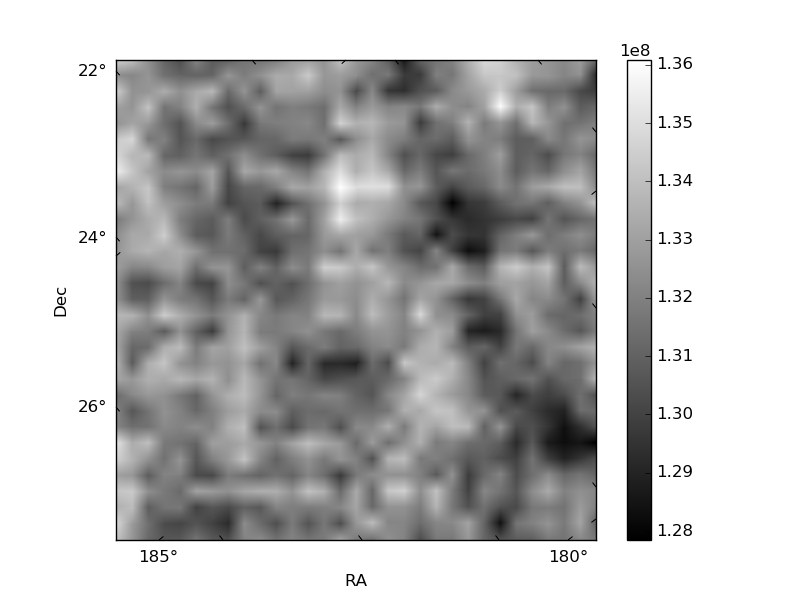
Quadrant B |
|---|---|---|---|
| Quadrant D | 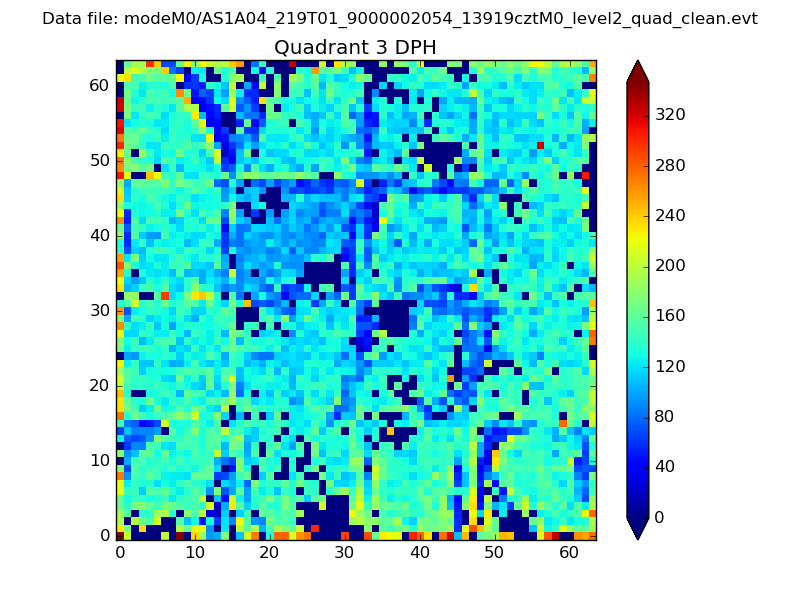 |
 |
Quadrant C |
| Plot type | Count rate plots | Images |
|---|---|---|
| Comparison with Poisson distribution Blue bars denote a histogram of data divided into 1 sec bins. Red curve is a Poisson curve with rate = median count rate of data. |
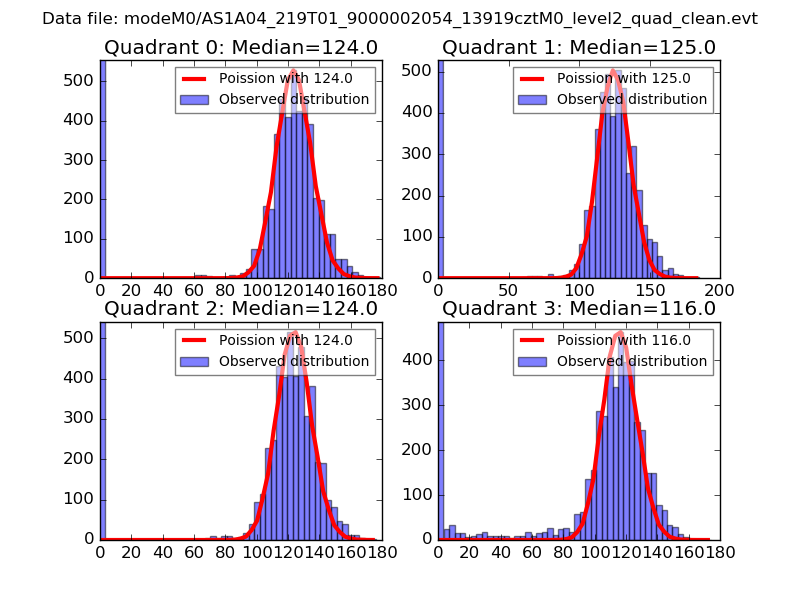 |
 |
| Quadrant-wise count rates Data is divided into 100 sec bins |
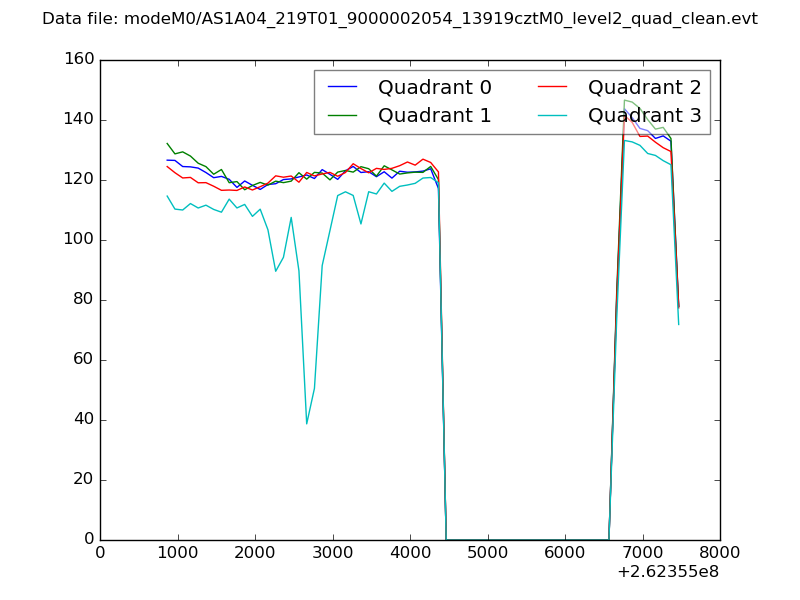 |
|
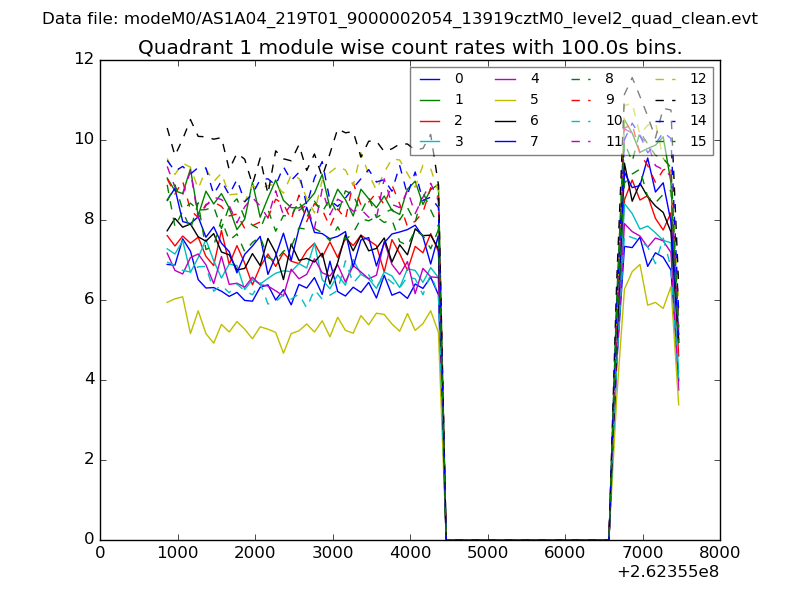
| Module-wise count rates for Quadrant A Data is divided into 100 sec bins |
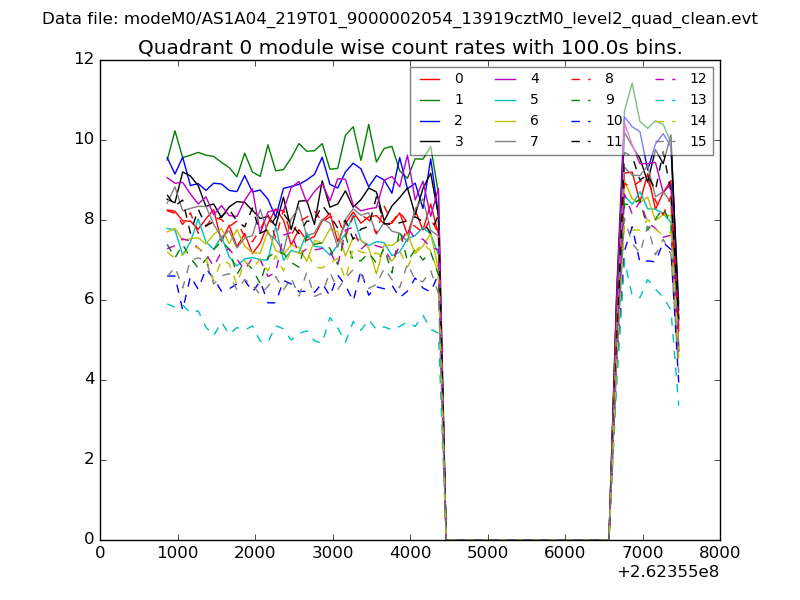 |
 |
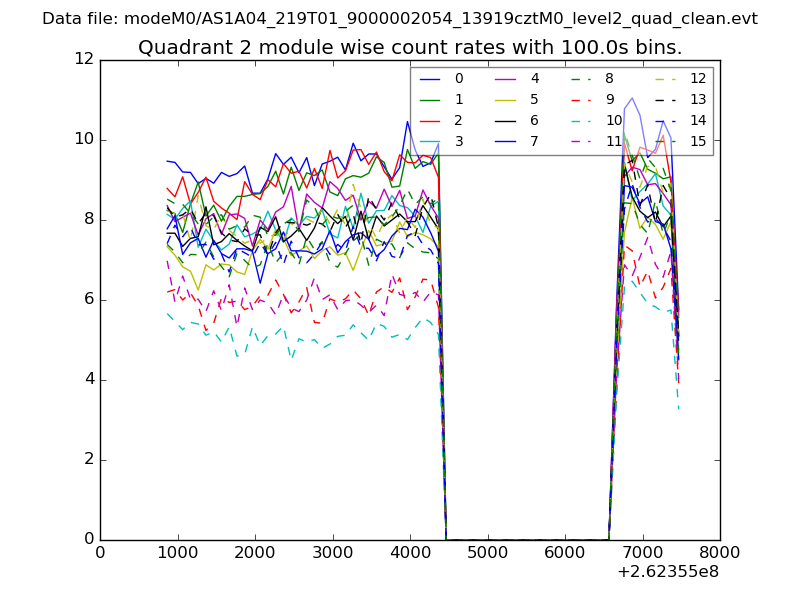
| Module-wise count rates for Quadrant B Data is divided into 100 sec bins |
 |
 |
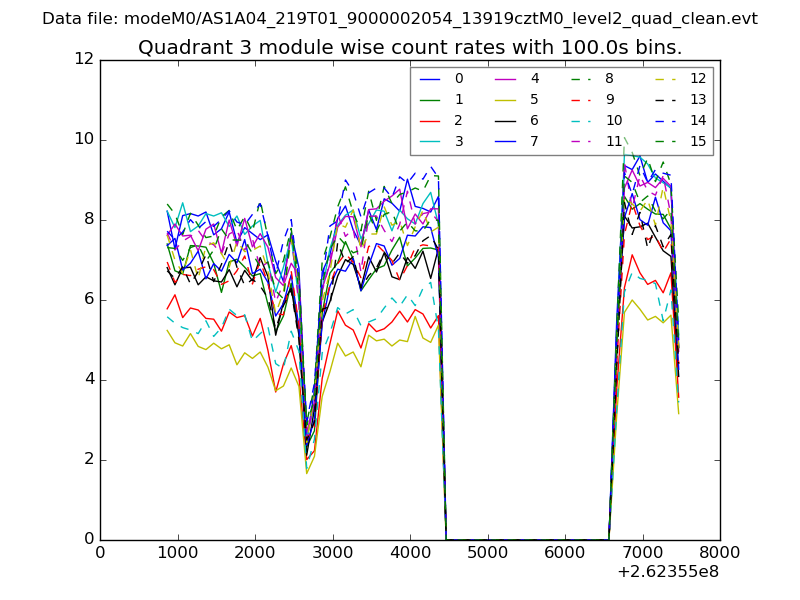
| Module-wise count rates for Quadrant C Data is divided into 100 sec bins |
 |
 |
| Module-wise count rates for Quadrant D Data is divided into 100 sec bins |
 |
 |
| Parameter | Plot |
|---|---|
| CZT HV Monitor | 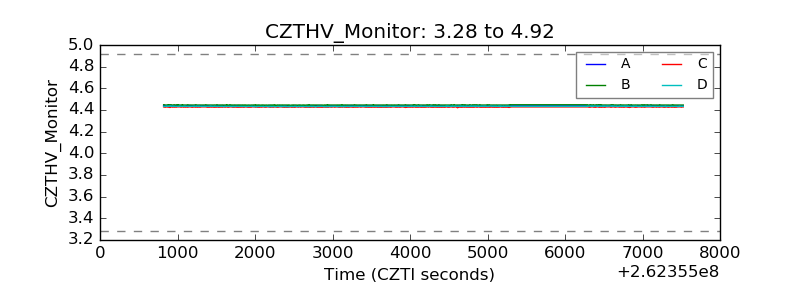 |
| D_VDD | 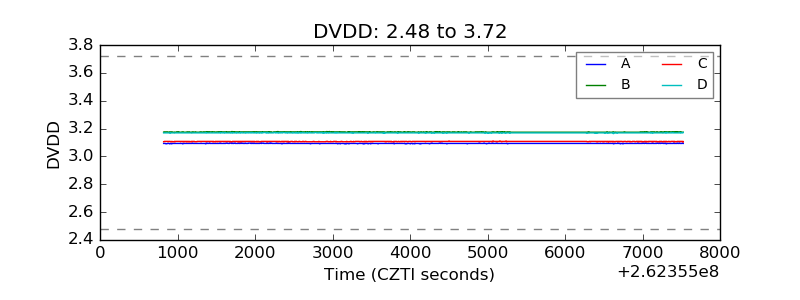 |
| Temperature 1 |  |
| Veto HV Monitor | 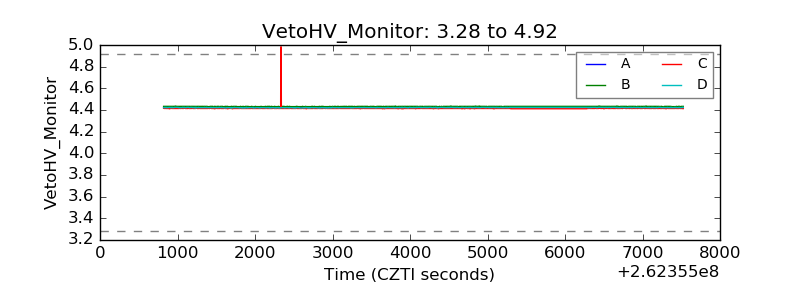 |
| Veto LLD | 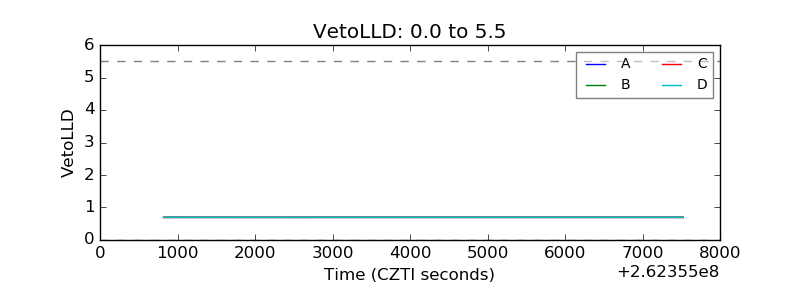 |
| Alpha Counter | 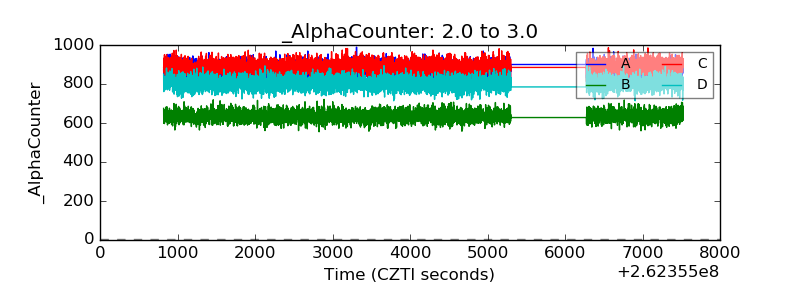 |
| _CPM_Rate | 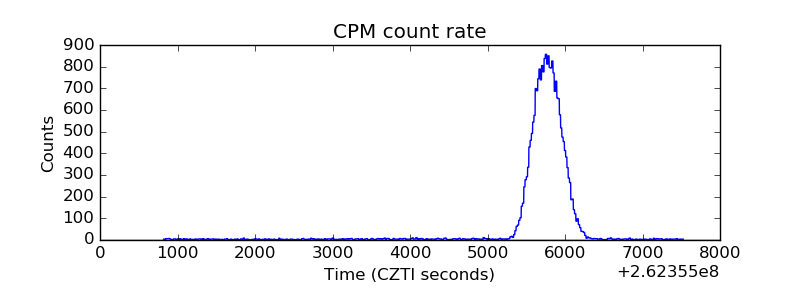 |
| CZT Counter | 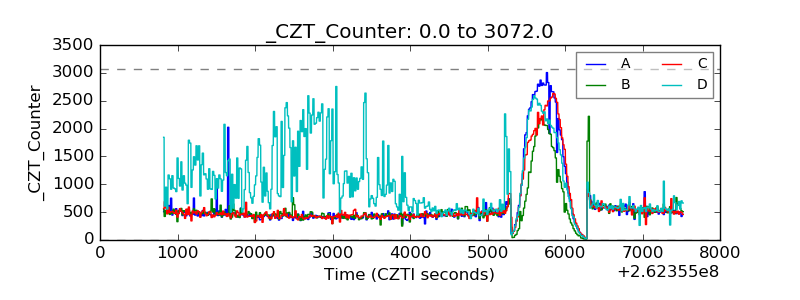 |
| +2.5 Volts monitor |  |
| +5 Volts monitor |  |
| _ROLL_ROT | 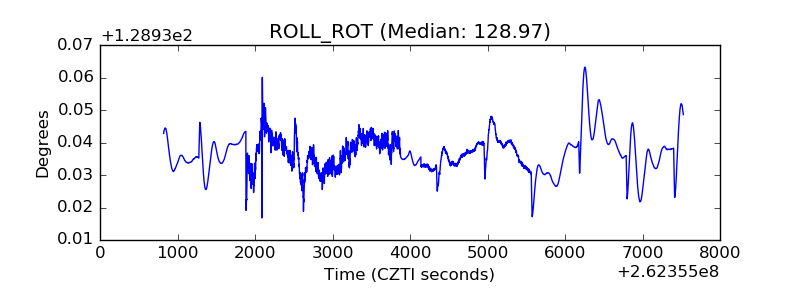 |
| _Roll_DEC | 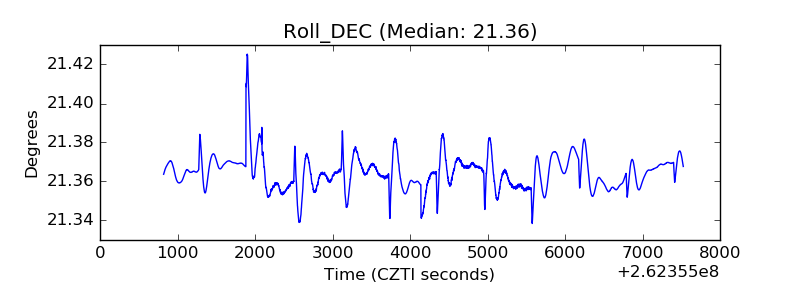 |
| _Roll_RA | 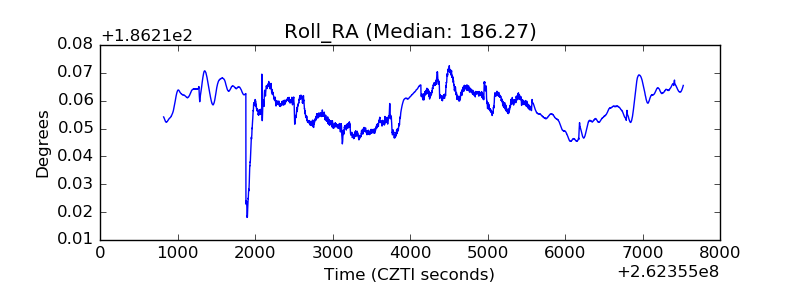 |
| Veto Counter | 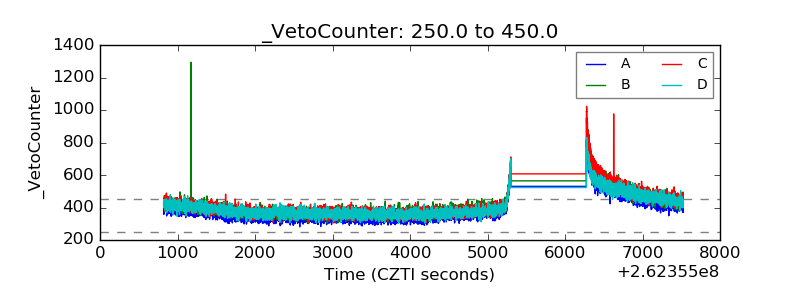 |