| Param | Original file | Final file |
|---|---|---|
| Filename | modeM0/AS1A04_219T01_9000002054_13921cztM0_level2.evt | modeM0/AS1A04_219T01_9000002054_13921cztM0_level2_quad_clean.evt |
| Size (bytes) | 471,124,800 | 101,462,400 |
| Size | 449.3 MB | 96.8 MB |
| Events in quadrant A | 2,984,651 | 669,786 |
| Events in quadrant B | 3,081,618 | 674,875 |
| Events in quadrant C | 3,068,198 | 665,894 |
| Events in quadrant D | 4,716,945 | 633,823 |
| Mode M0 | |||
|---|---|---|---|
| Quadrant | BADHDUFLAG | Total packets | Discarded packets |
| A | 0 | 12910 | 2 |
| B | 0 | 13097 | 1 |
| C | 0 | 13089 | 1 |
| D | 0 | 18335 | 1 |
| Mode SS | |||
|---|---|---|---|
| Quadrant | BADHDUFLAG | Total packets | Discarded packets |
| A | 0 | 124 | 0 |
| B | 0 | 124 | 0 |
| C | 0 | 124 | 0 |
| D | 0 | 124 | 0 |
| Mode M9 | |||
|---|---|---|---|
| Quadrant | BADHDUFLAG | Total packets | Discarded packets |
| A | 0 | 11 | 0 |
| B | 0 | 11 | 0 |
| C | 0 | 11 | 0 |
| D | 0 | 11 | 0 |
| Quadrant | Total seconds | Saturated seconds | Saturation percentage |
|---|---|---|---|
| A | 6140 | 66 | 1.074919% |
| B | 6140 | 74 | 1.205212% |
| C | 6140 | 56 | 0.912052% |
| D | 6140 | 228 | 3.713355% |
Noise dominated data is calculated using 1-second bins in cleaned event files. If a bin has >2000 counts, and if more than 50% of those come from <1% of pixels, then it is considered to be noise-dominated and hence unusable.
| Quadrant | # 1 sec bins | Bins with >0 counts | Bins with >2000 counts | High rate bins dominated by noise | Noise dominated (total time) | Noise dominated (detector-on time) | Marked lightcurve |
|---|---|---|---|---|---|---|---|
| A | 7221 | 6141 | 0 | 0 | 0.00% | 0.00% | 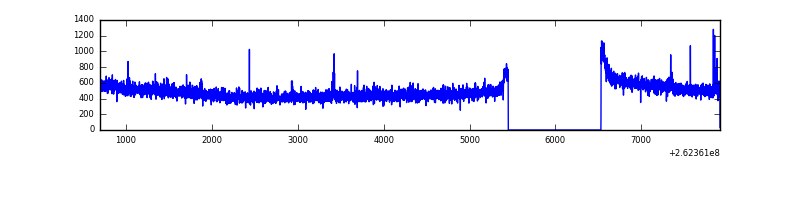 |
| B | 7221 | 6141 | 5 | 5 | 0.07% | 0.08% | 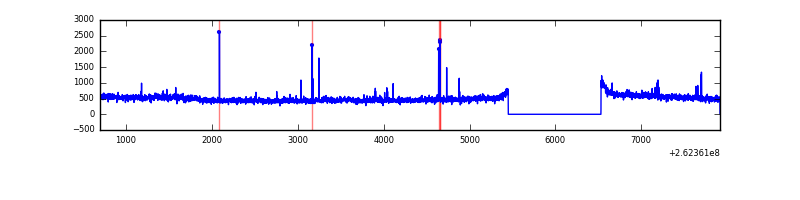 |
| C | 7221 | 6141 | 1 | 1 | 0.01% | 0.02% | 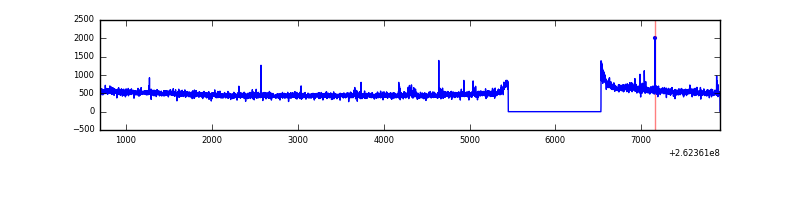 |
| D | 7221 | 6141 | 154 | 154 | 2.13% | 2.51% | 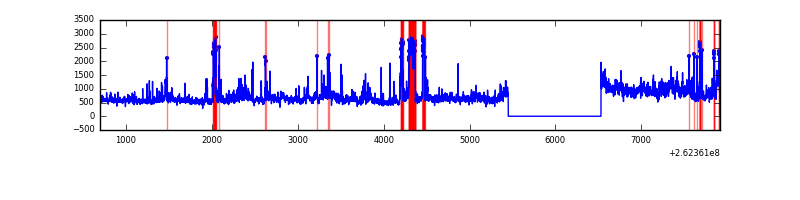 |
Top three noisy pixels from each quadrant. If the there are fewer than three noisy pixels in the level2.evt file, extra rows are filled as -1
| Pixel properties | Quadrant properties | ||||||
|---|---|---|---|---|---|---|---|
| Quadrant | DetID | PixID | Counts | Sigma | Mean | Median | Sigma |
| A | 8 | 15 | 21624 | 134.63 | 765 | 749 | 155.1 |
| A | 1 | 162 | 9561 | 56.83 | 765 | 749 | 155.1 |
| A | 0 | 226 | 6786 | 38.93 | 765 | 749 | 155.1 |
| B | 10 | 244 | 38428 | 259.44 | 757 | 739 | 145.3 |
| B | 4 | 173 | 23864 | 159.18 | 757 | 739 | 145.3 |
| B | 4 | 80 | 17872 | 117.94 | 757 | 739 | 145.3 |
| C | 3 | 233 | 139208 | 794.91 | 749 | 753 | 174.2 |
| C | 14 | 234 | 6294 | 31.81 | 749 | 753 | 174.2 |
| C | 13 | 61 | 5268 | 25.92 | 749 | 753 | 174.2 |
| D | 13 | 122 | 1098696 | 6291.53 | 737 | 723 | 174.5 |
| D | 13 | 189 | 422897 | 2419.11 | 737 | 723 | 174.5 |
| D | 1 | 52 | 208628 | 1191.32 | 737 | 723 | 174.5 |
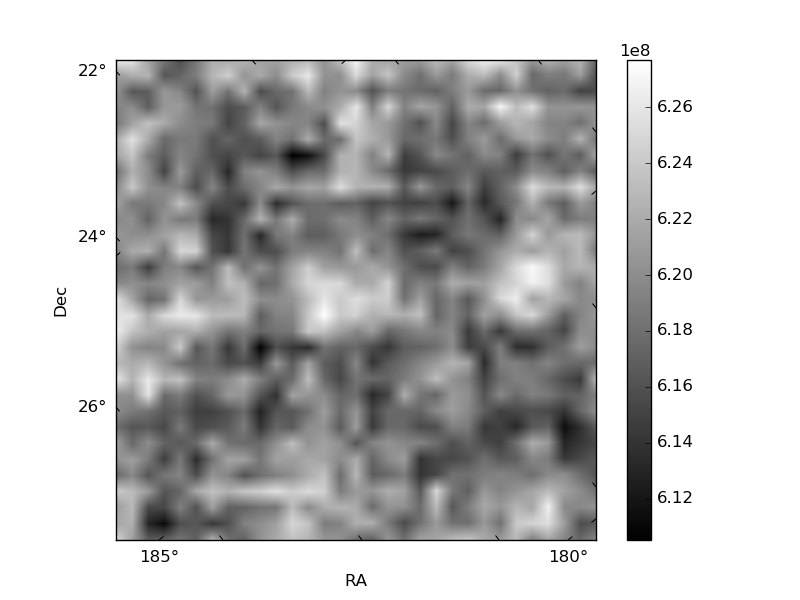
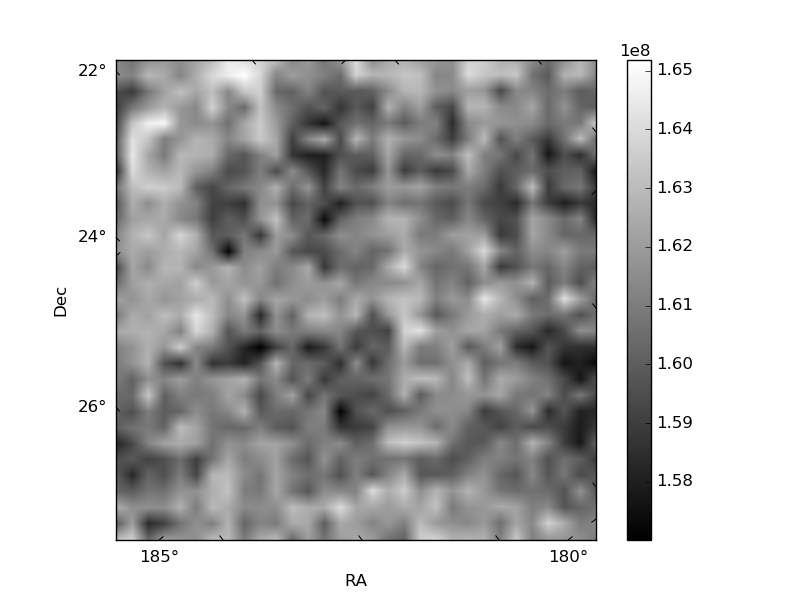
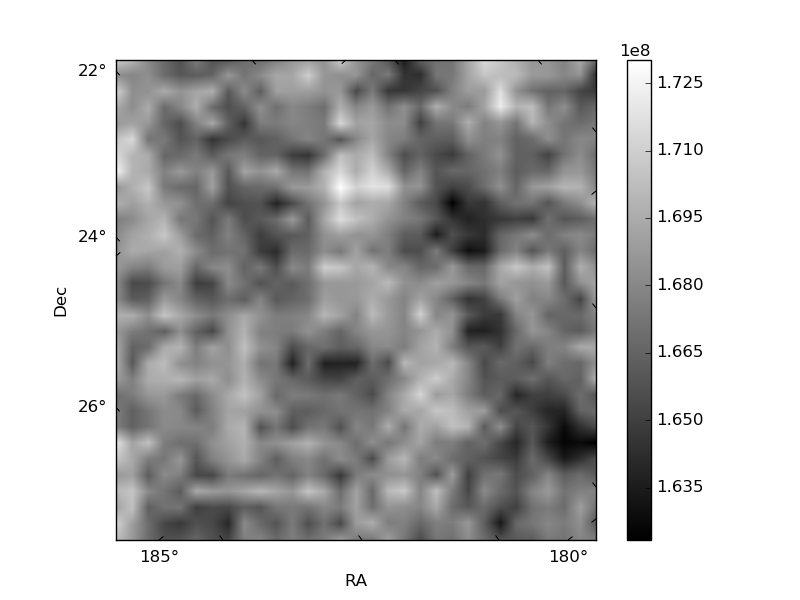
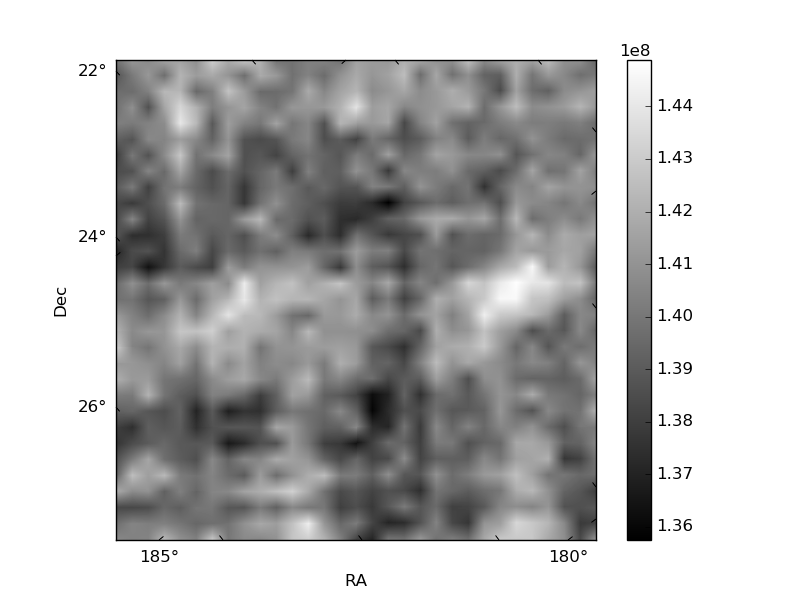
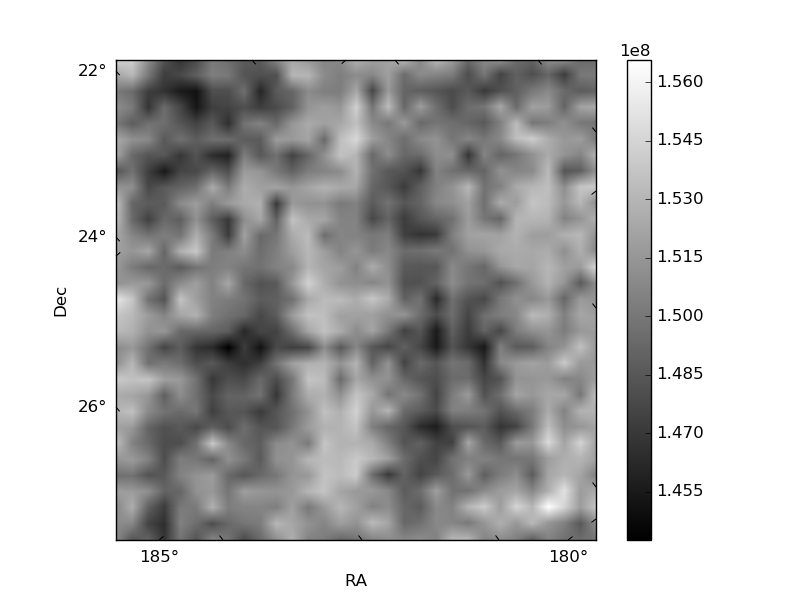
Histogram calculated using DETX and DETY for each event in the final _common_clean file
| Quadrant A | 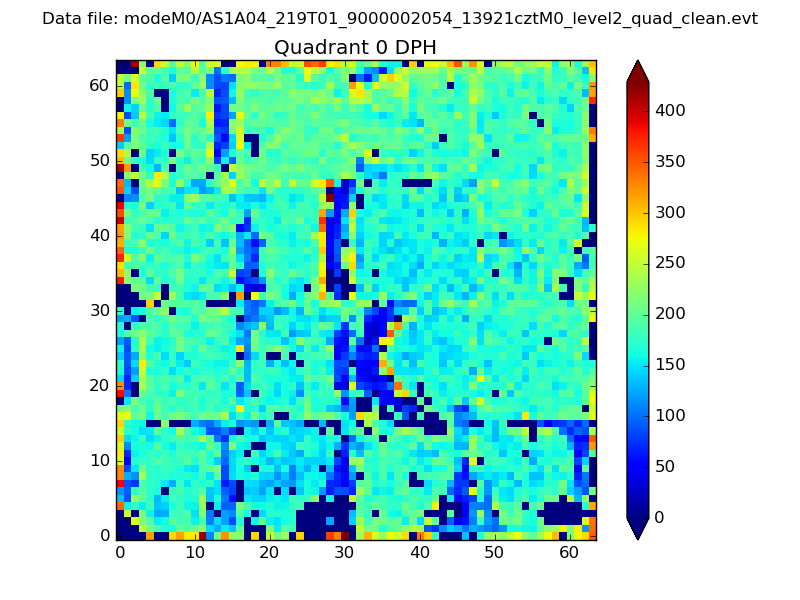 |
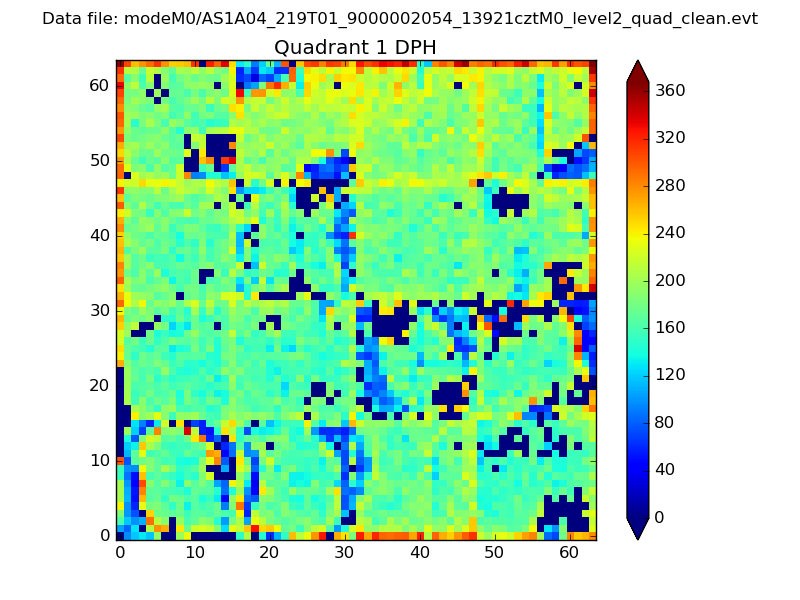 |
Quadrant B |
|---|---|---|---|
| Quadrant D | 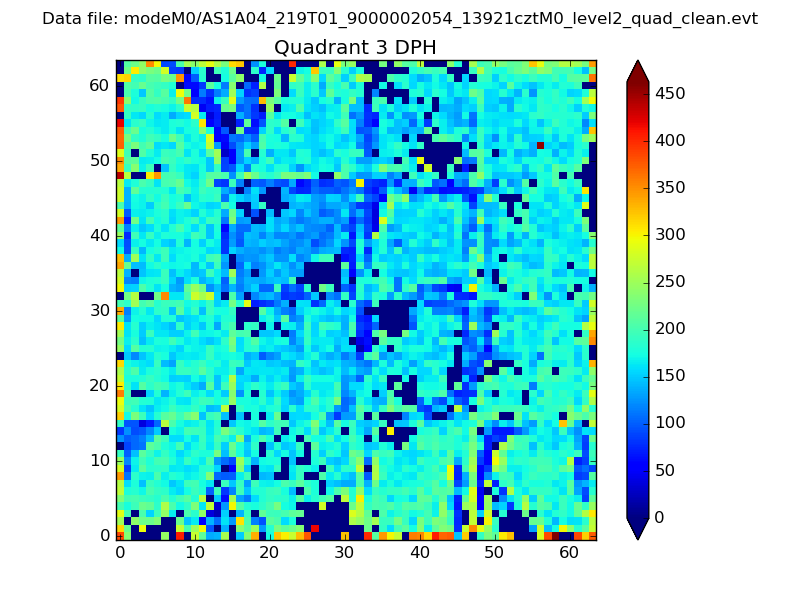 |
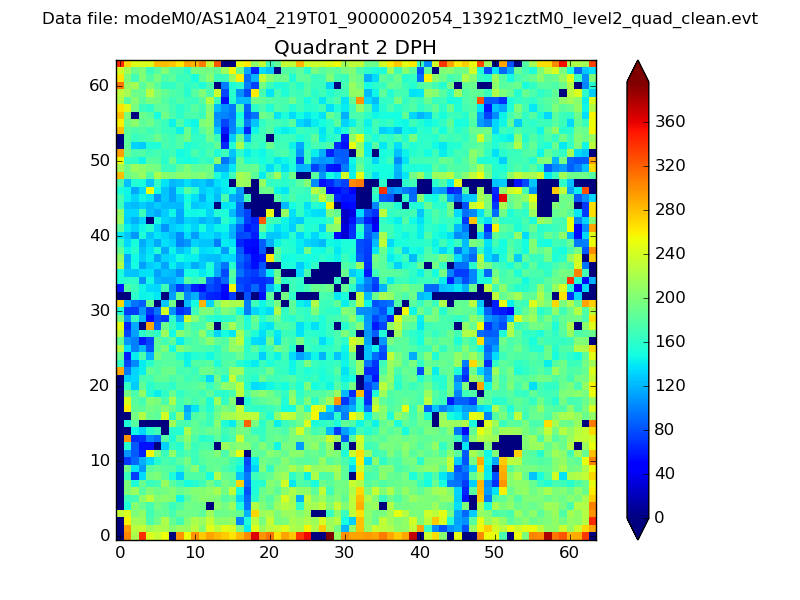 |
Quadrant C |
| Plot type | Count rate plots | Images |
|---|---|---|
| Comparison with Poisson distribution Blue bars denote a histogram of data divided into 1 sec bins. Red curve is a Poisson curve with rate = median count rate of data. |
 |
 |
| Quadrant-wise count rates Data is divided into 100 sec bins |
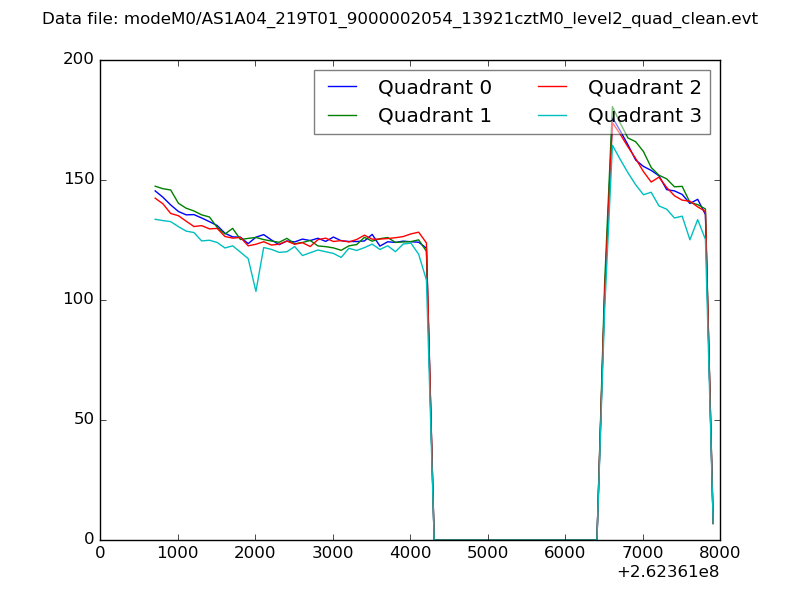 |
|
| Module-wise count rates for Quadrant A Data is divided into 100 sec bins |
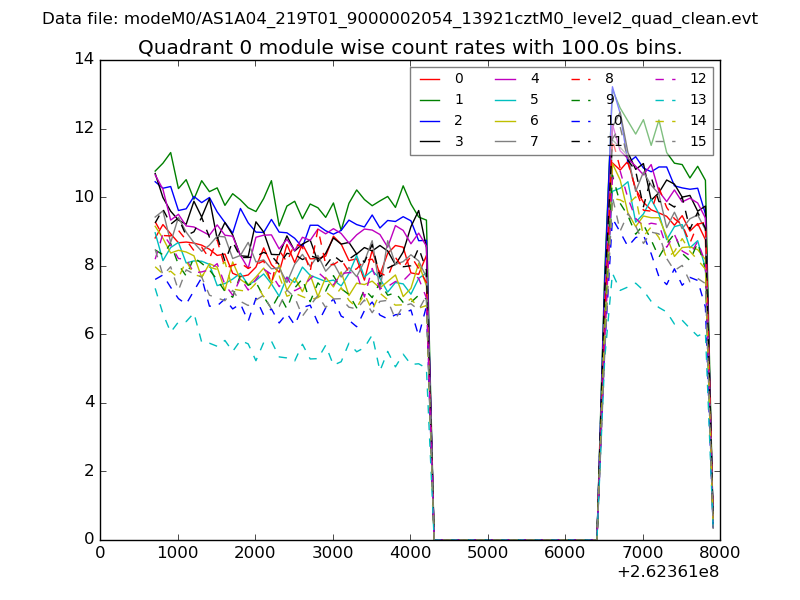 |
 |
| Module-wise count rates for Quadrant B Data is divided into 100 sec bins |
 |
 |
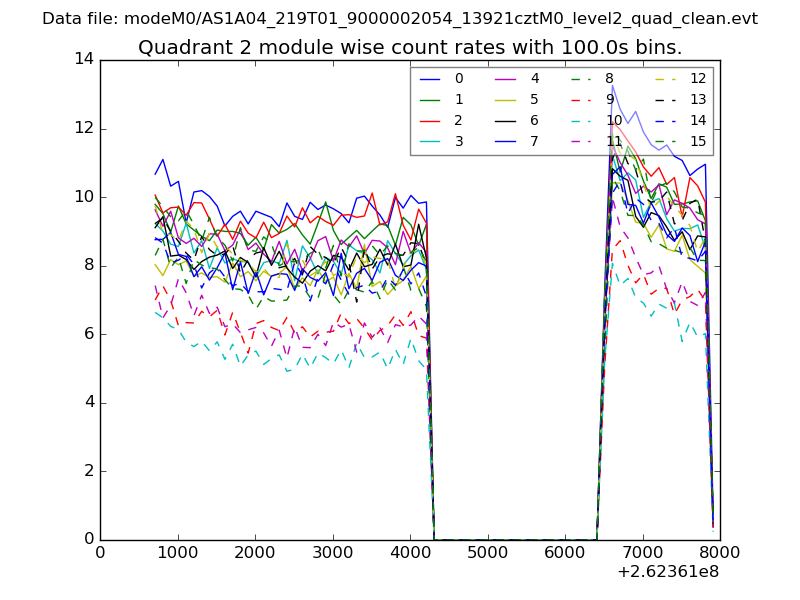
| Module-wise count rates for Quadrant C Data is divided into 100 sec bins |
 |
 |
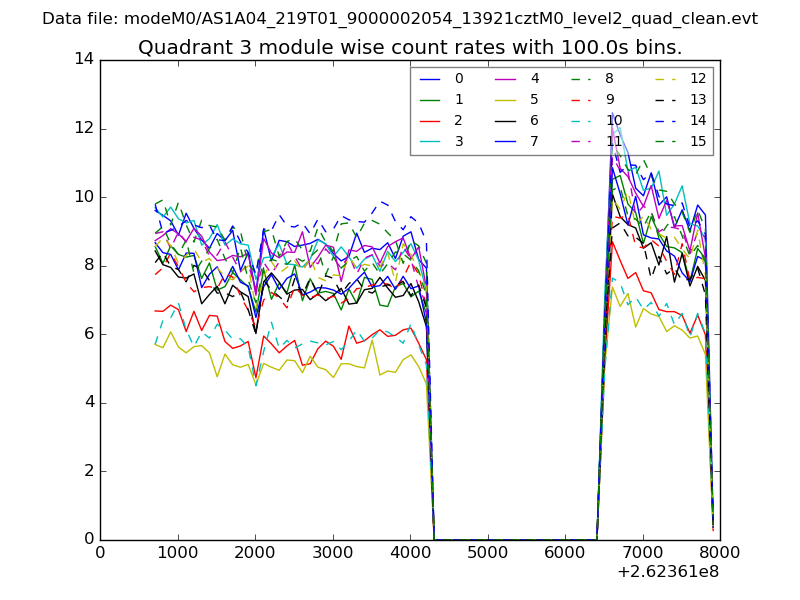
| Module-wise count rates for Quadrant D Data is divided into 100 sec bins |
 |
 |
| Parameter | Plot |
|---|---|
| CZT HV Monitor | 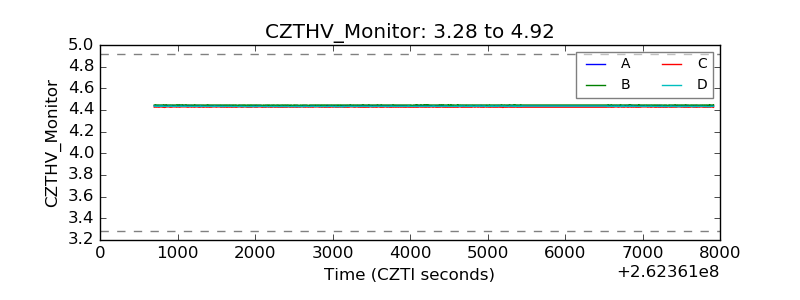 |
| D_VDD | 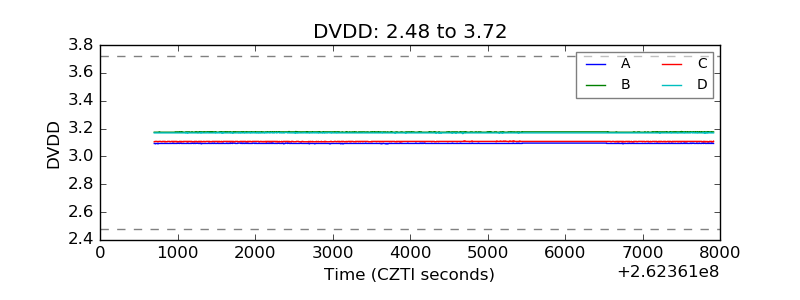 |
| Temperature 1 | 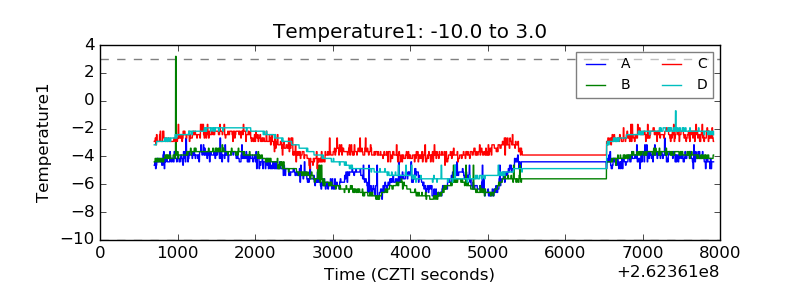 |
| Veto HV Monitor | 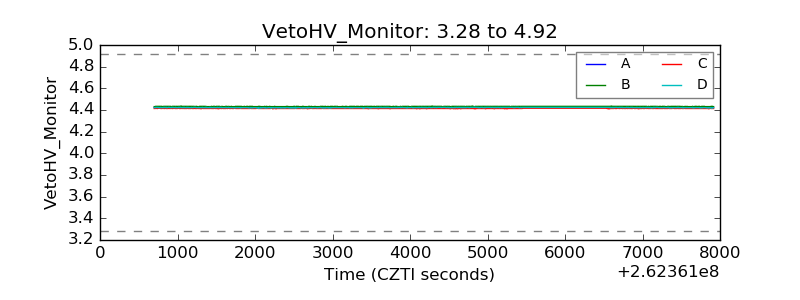 |
| Veto LLD |  |
| Alpha Counter | 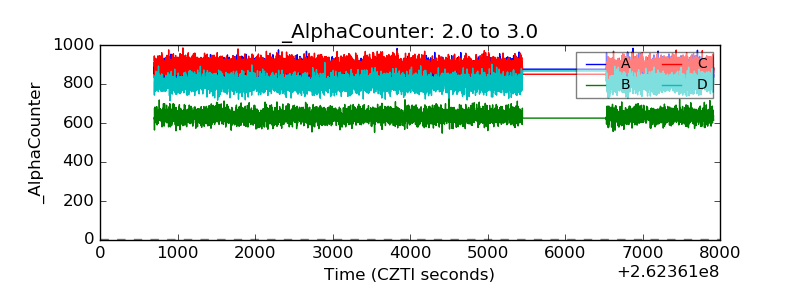 |
| _CPM_Rate | 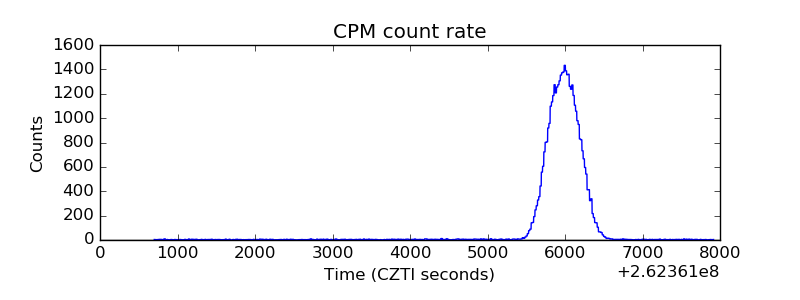 |
| CZT Counter | 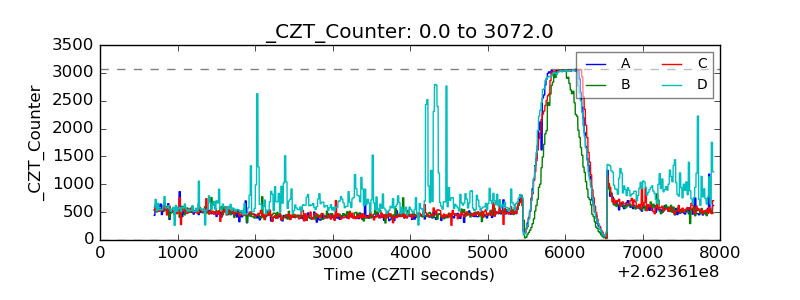 |
| +2.5 Volts monitor |  |
| +5 Volts monitor |  |
| _ROLL_ROT |  |
| _Roll_DEC | 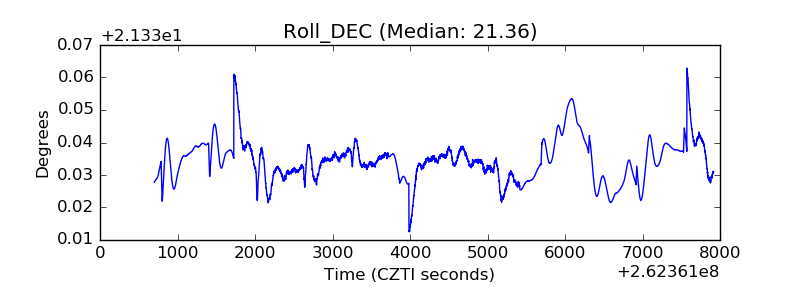 |
| _Roll_RA | 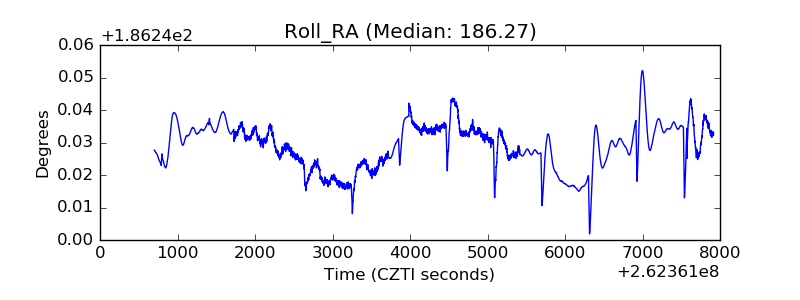 |
| Veto Counter | 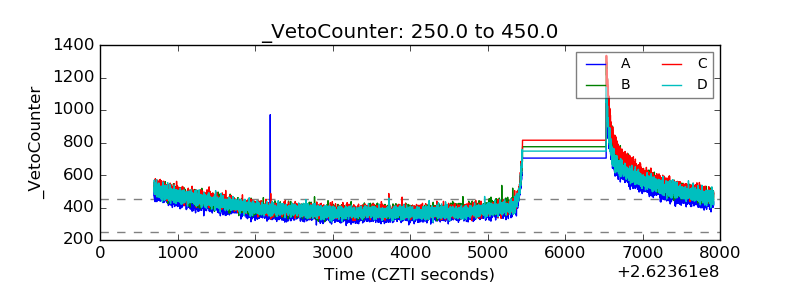 |