| Param | Original file | Final file |
|---|---|---|
| Filename | modeM0/AS1A04_219T01_9000002054_13924cztM0_level2.evt | modeM0/AS1A04_219T01_9000002054_13924cztM0_level2_quad_clean.evt |
| Size (bytes) | 549,696,960 | 92,643,840 |
| Size | 524.2 MB | 88.4 MB |
| Events in quadrant A | 3,244,081 | 601,953 |
| Events in quadrant B | 3,189,488 | 611,799 |
| Events in quadrant C | 3,270,619 | 608,732 |
| Events in quadrant D | 6,522,469 | 548,913 |
| Mode M0 | |||
|---|---|---|---|
| Quadrant | BADHDUFLAG | Total packets | Discarded packets |
| A | 0 | 13514 | 3 |
| B | 0 | 13409 | 2 |
| C | 0 | 13432 | 2 |
| D | 0 | 23850 | 2 |
| Mode SS | |||
|---|---|---|---|
| Quadrant | BADHDUFLAG | Total packets | Discarded packets |
| A | 0 | 128 | 0 |
| B | 0 | 128 | 0 |
| C | 0 | 128 | 0 |
| D | 0 | 128 | 0 |
| Mode M9 | |||
|---|---|---|---|
| Quadrant | BADHDUFLAG | Total packets | Discarded packets |
| A | 0 | 16 | 0 |
| B | 0 | 16 | 0 |
| C | 0 | 16 | 0 |
| D | 0 | 17 | 0 |
| Quadrant | Total seconds | Saturated seconds | Saturation percentage |
|---|---|---|---|
| A | 6210 | 52 | 0.837359% |
| B | 6210 | 64 | 1.030596% |
| C | 6210 | 39 | 0.628019% |
| D | 6210 | 631 | 10.161031% |
Noise dominated data is calculated using 1-second bins in cleaned event files. If a bin has >2000 counts, and if more than 50% of those come from <1% of pixels, then it is considered to be noise-dominated and hence unusable.
| Quadrant | # 1 sec bins | Bins with >0 counts | Bins with >2000 counts | High rate bins dominated by noise | Noise dominated (total time) | Noise dominated (detector-on time) | Marked lightcurve |
|---|---|---|---|---|---|---|---|
| A | 7526 | 6211 | 4 | 4 | 0.05% | 0.06% |  |
| B | 7526 | 6211 | 6 | 6 | 0.08% | 0.10% |  |
| C | 7526 | 6211 | 4 | 4 | 0.05% | 0.06% |  |
| D | 7526 | 6211 | 604 | 604 | 8.03% | 9.72% | 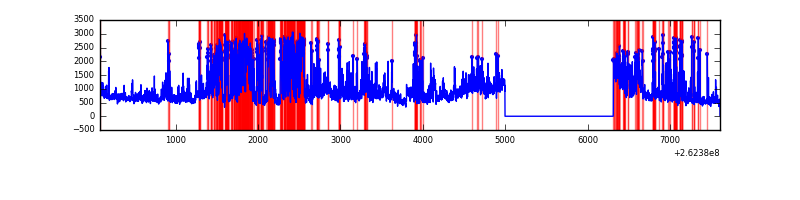 |
Top three noisy pixels from each quadrant. If the there are fewer than three noisy pixels in the level2.evt file, extra rows are filled as -1
| Pixel properties | Quadrant properties | ||||||
|---|---|---|---|---|---|---|---|
| Quadrant | DetID | PixID | Counts | Sigma | Mean | Median | Sigma |
| A | 15 | 69 | 125388 | 785.53 | 797 | 782 | 158.6 |
| A | 8 | 15 | 26223 | 160.38 | 797 | 782 | 158.6 |
| A | 1 | 162 | 17247 | 103.8 | 797 | 782 | 158.6 |
| B | 0 | 244 | 32816 | 215.02 | 793 | 774 | 149.0 |
| B | 4 | 80 | 21323 | 137.89 | 793 | 774 | 149.0 |
| B | 12 | 111 | 17404 | 111.59 | 793 | 774 | 149.0 |
| C | 3 | 233 | 205777 | 1135.6 | 784 | 790 | 180.5 |
| C | 14 | 234 | 11072 | 56.96 | 784 | 790 | 180.5 |
| C | 13 | 61 | 5633 | 26.83 | 784 | 790 | 180.5 |
| D | 1 | 52 | 2451695 | 13749.52 | 753 | 738 | 178.3 |
| D | 13 | 122 | 742323 | 4160.19 | 753 | 738 | 178.3 |
| D | 12 | 110 | 138124 | 770.72 | 753 | 738 | 178.3 |
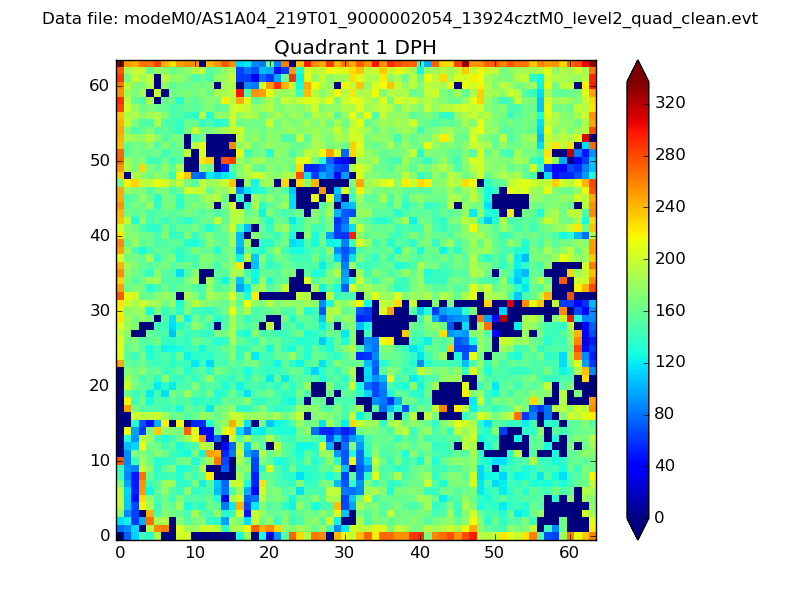
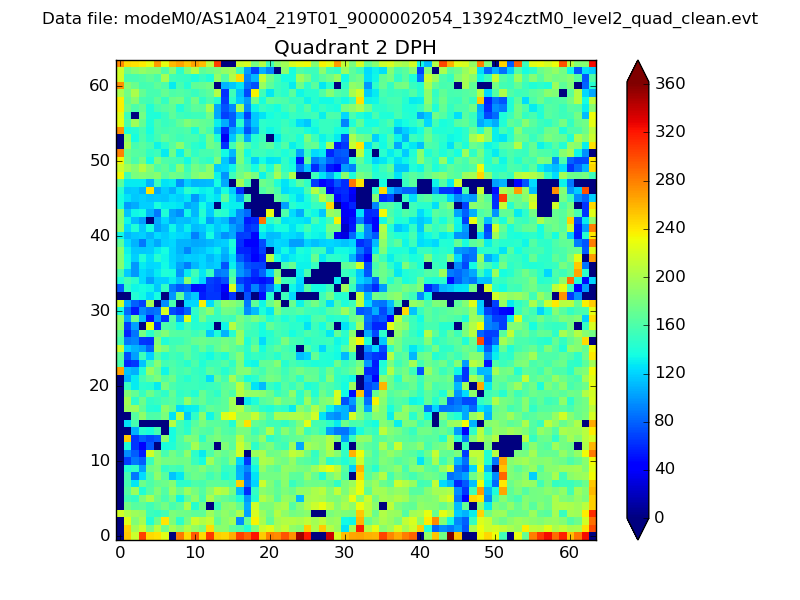
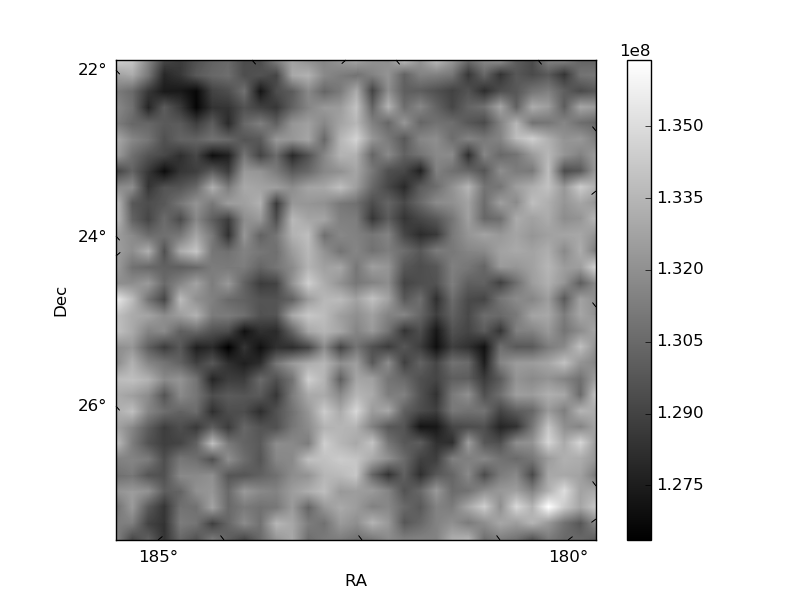
Histogram calculated using DETX and DETY for each event in the final _common_clean file
| Quadrant A | 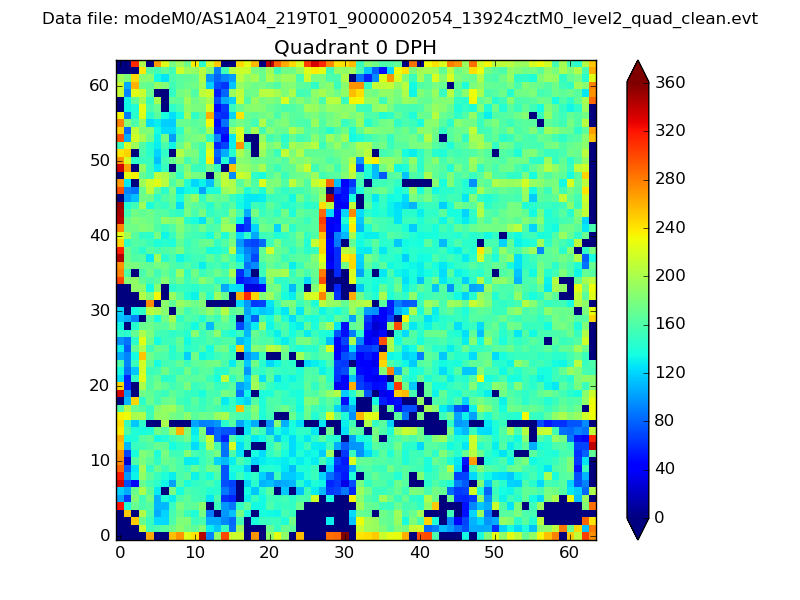 |
 |
Quadrant B |
|---|---|---|---|
| Quadrant D | 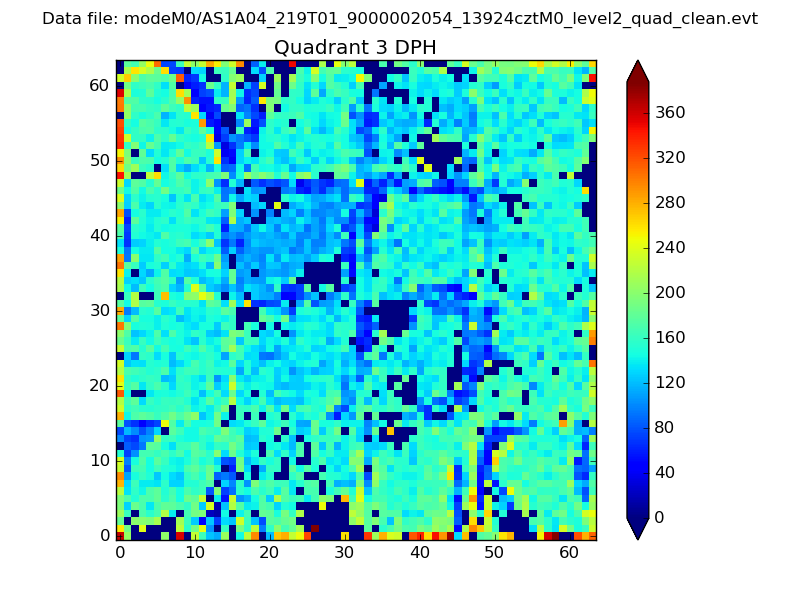 |
 |
Quadrant C |
| Plot type | Count rate plots | Images |
|---|---|---|
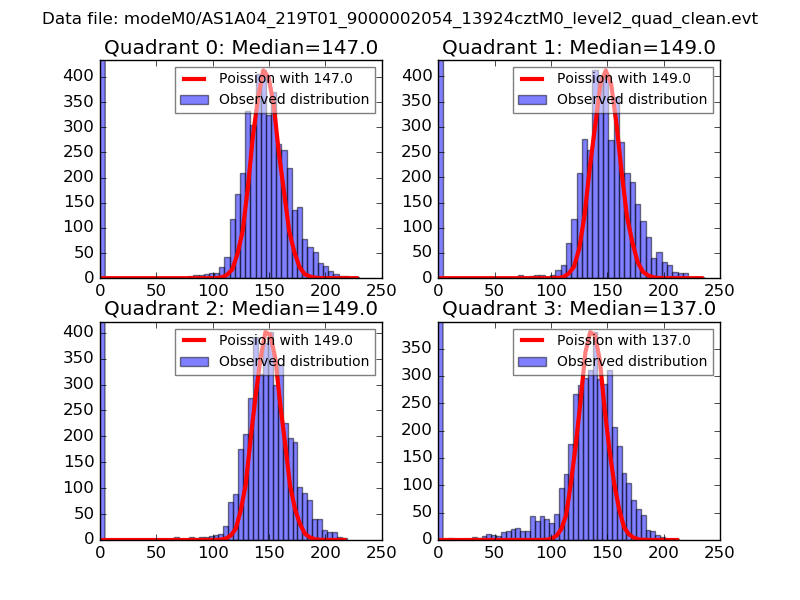
| Comparison with Poisson distribution Blue bars denote a histogram of data divided into 1 sec bins. Red curve is a Poisson curve with rate = median count rate of data. |
 |
 |
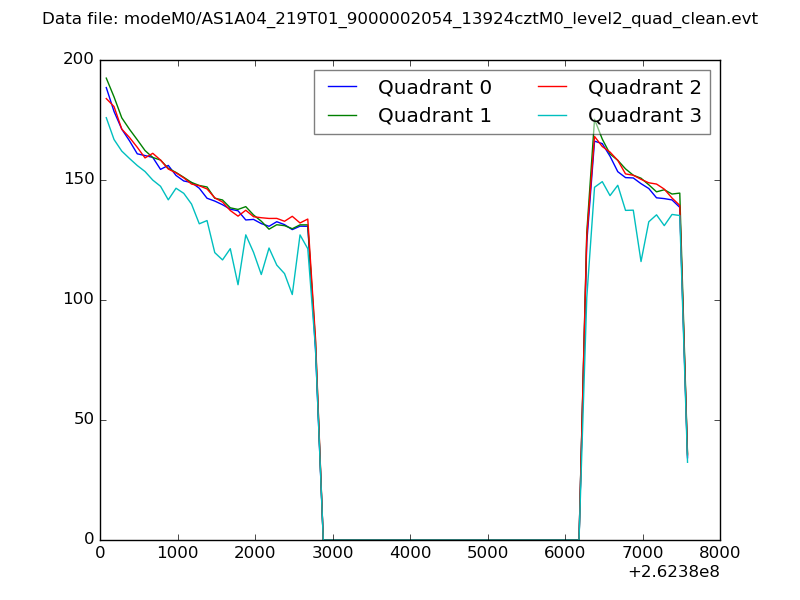
| Quadrant-wise count rates Data is divided into 100 sec bins |
 |
|
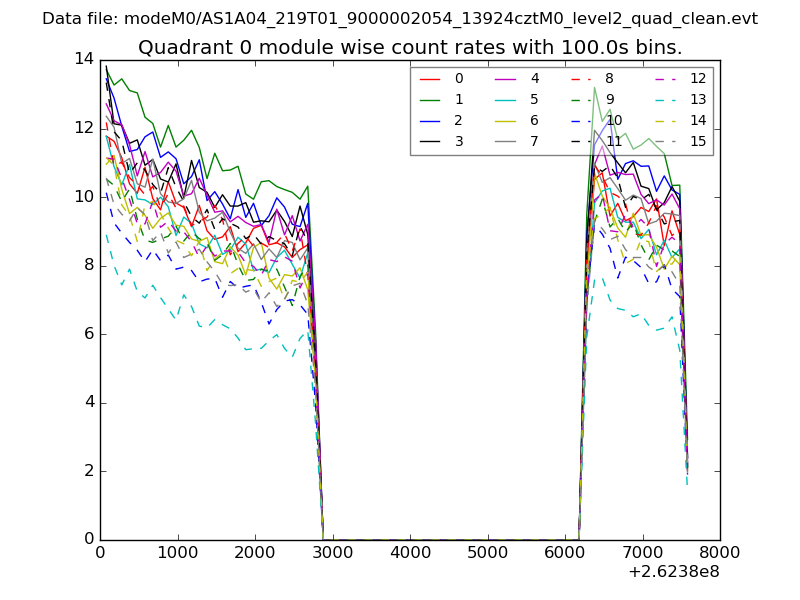
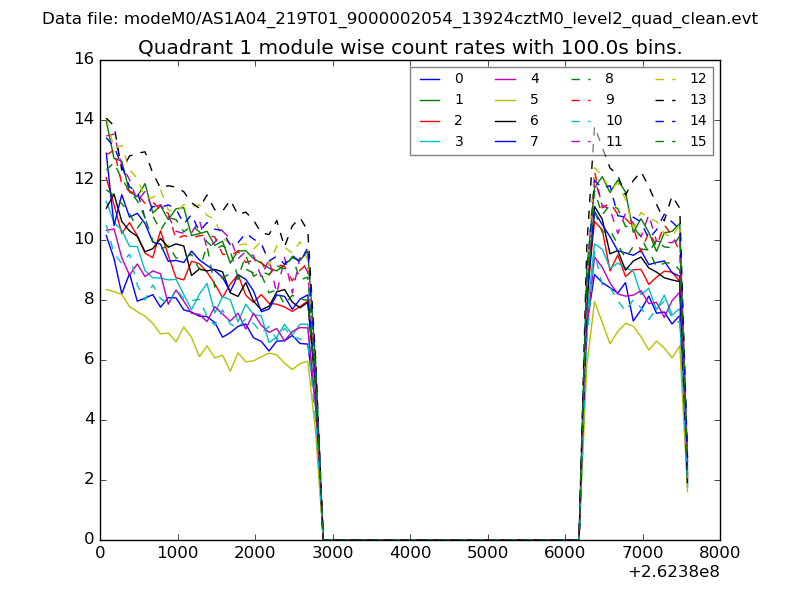
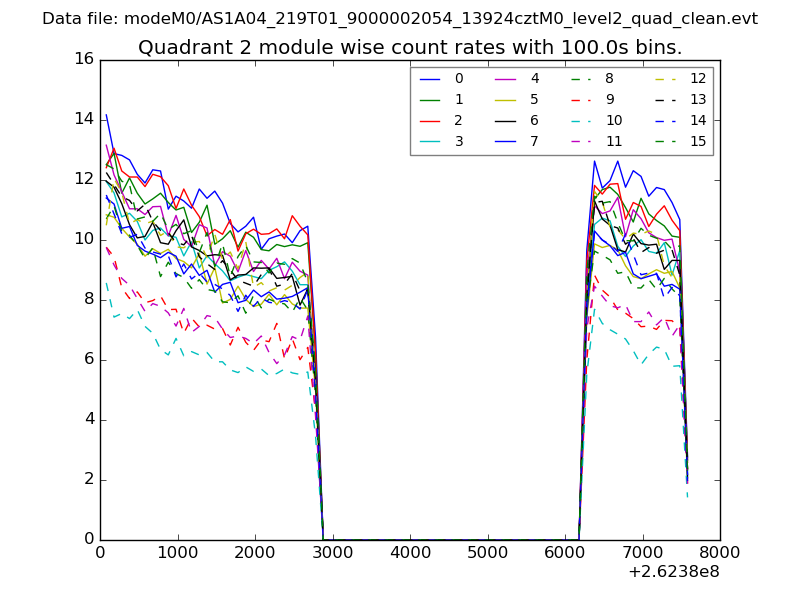
| Module-wise count rates for Quadrant A Data is divided into 100 sec bins |
 |
 |
| Module-wise count rates for Quadrant B Data is divided into 100 sec bins |
 |
 |
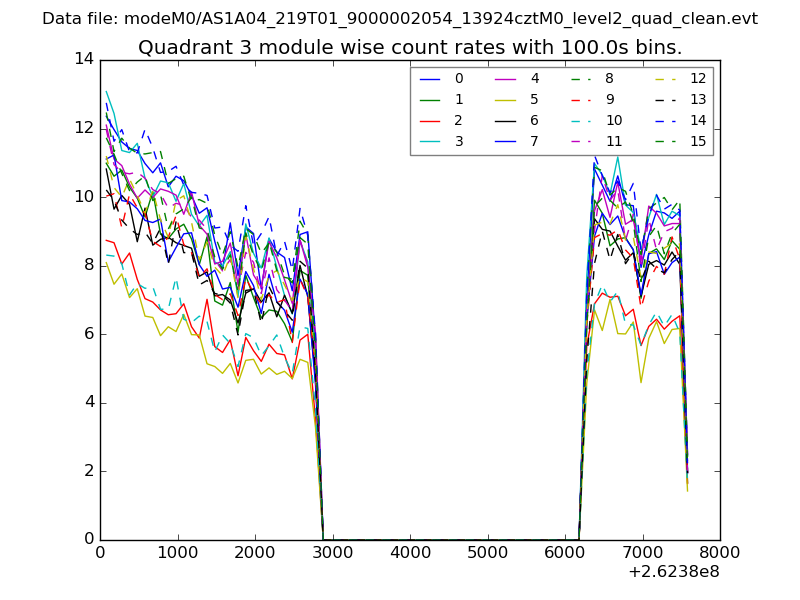
| Module-wise count rates for Quadrant C Data is divided into 100 sec bins |
 |
 |
| Module-wise count rates for Quadrant D Data is divided into 100 sec bins |
 |
 |
| Parameter | Plot |
|---|---|
| CZT HV Monitor | 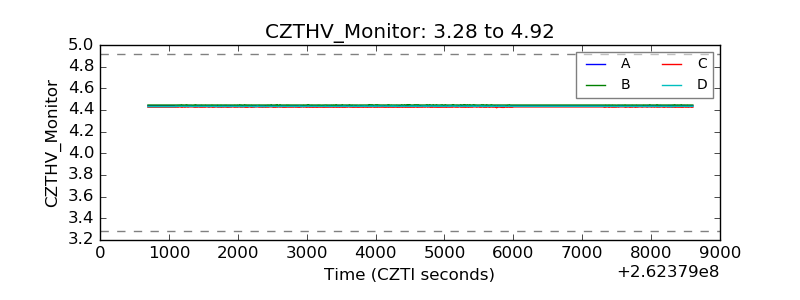 |
| D_VDD | 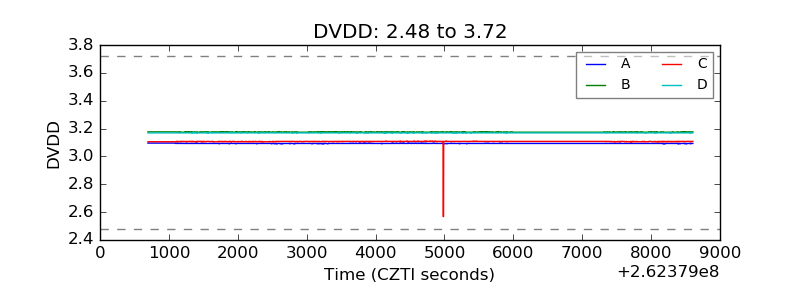 |
| Temperature 1 | 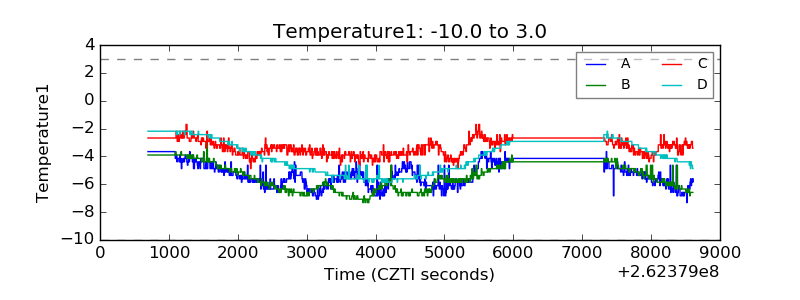 |
| Veto HV Monitor |  |
| Veto LLD | 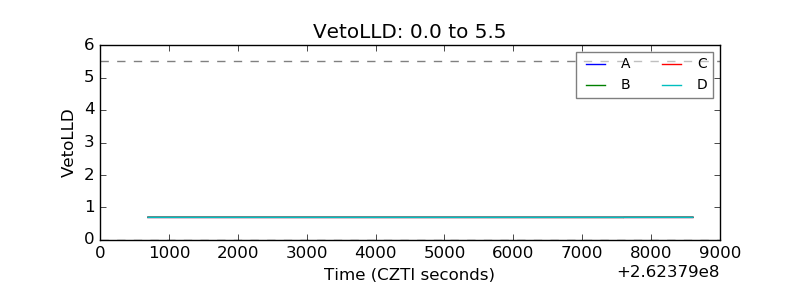 |
| Alpha Counter | 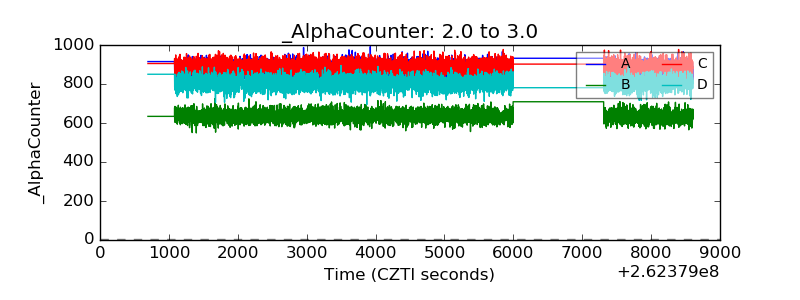 |
| _CPM_Rate | 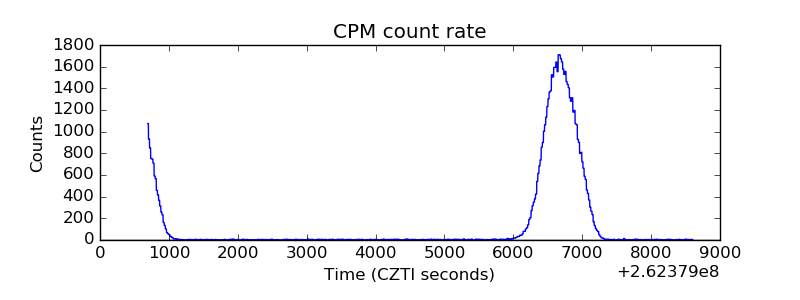 |
| CZT Counter | 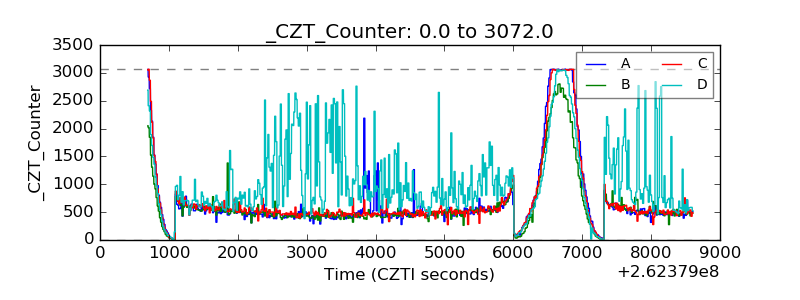 |
| +2.5 Volts monitor |  |
| +5 Volts monitor |  |
| _ROLL_ROT | 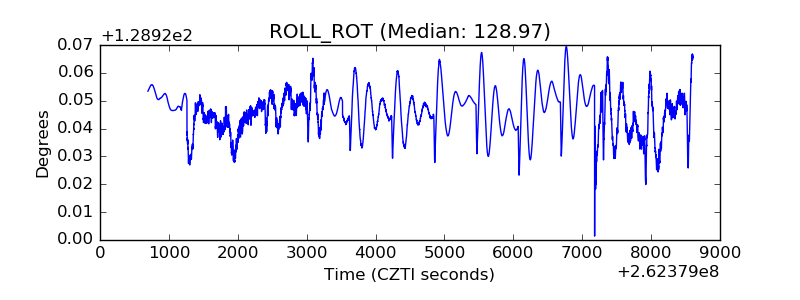 |
| _Roll_DEC |  |
| _Roll_RA | 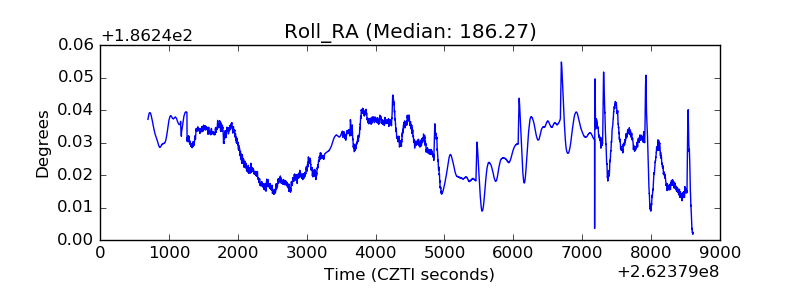 |
| Veto Counter | 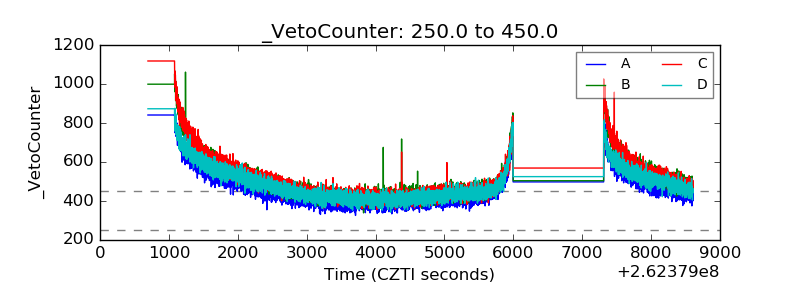 |