| Param | Original file | Final file |
|---|---|---|
| Filename | modeM0/AS1A04_219T01_9000002054_13925cztM0_level2.evt | modeM0/AS1A04_219T01_9000002054_13925cztM0_level2_quad_clean.evt |
| Size (bytes) | 133,326,720 | 34,001,280 |
| Size | 127.2 MB | 32.4 MB |
| Events in quadrant A | 795,937 | 231,467 |
| Events in quadrant B | 827,043 | 236,118 |
| Events in quadrant C | 823,767 | 234,915 |
| Events in quadrant D | 1,483,146 | 212,203 |
| Mode M0 | |||
|---|---|---|---|
| Quadrant | BADHDUFLAG | Total packets | Discarded packets |
| A | 0 | 3296 | 1 |
| B | 0 | 3391 | 1 |
| C | 0 | 3352 | 1 |
| D | 0 | 5467 | 1 |
| Mode SS | |||
|---|---|---|---|
| Quadrant | BADHDUFLAG | Total packets | Discarded packets |
| A | 0 | 30 | 0 |
| B | 0 | 30 | 0 |
| C | 0 | 30 | 0 |
| D | 0 | 30 | 0 |
| Mode M9 | |||
|---|---|---|---|
| Quadrant | BADHDUFLAG | Total packets | Discarded packets |
| A | 0 | 8 | 0 |
| B | 0 | 8 | 0 |
| C | 0 | 8 | 0 |
| D | 0 | 9 | 0 |
| Quadrant | Total seconds | Saturated seconds | Saturation percentage |
|---|---|---|---|
| A | 1553 | 5 | 0.321958% |
| B | 1553 | 9 | 0.579524% |
| C | 1553 | 1 | 0.064392% |
| D | 1553 | 161 | 10.367032% |
Noise dominated data is calculated using 1-second bins in cleaned event files. If a bin has >2000 counts, and if more than 50% of those come from <1% of pixels, then it is considered to be noise-dominated and hence unusable.
| Quadrant | # 1 sec bins | Bins with >0 counts | Bins with >2000 counts | High rate bins dominated by noise | Noise dominated (total time) | Noise dominated (detector-on time) | Marked lightcurve |
|---|---|---|---|---|---|---|---|
| A | 1554 | 1554 | 0 | 0 | 0.00% | 0.00% | 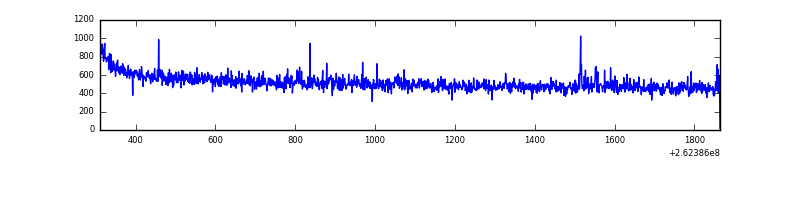 |
| B | 1554 | 1554 | 1 | 1 | 0.06% | 0.06% | 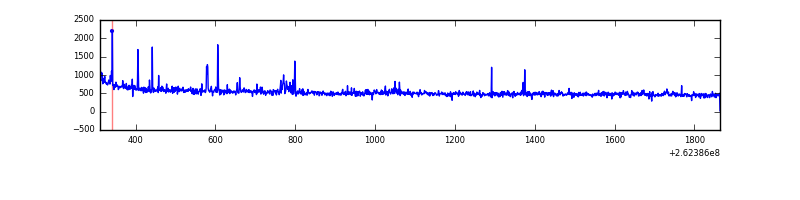 |
| C | 1554 | 1554 | 1 | 1 | 0.06% | 0.06% | 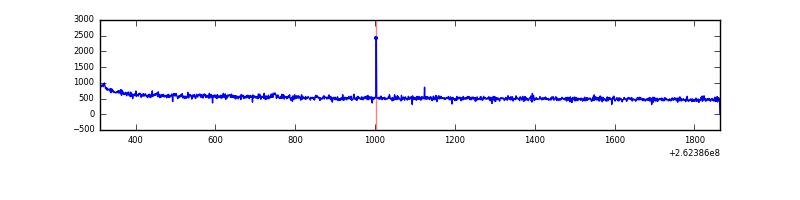 |
| D | 1554 | 1554 | 106 | 106 | 6.82% | 6.82% | 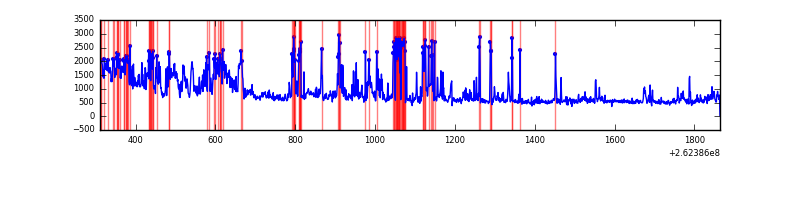 |
Top three noisy pixels from each quadrant. If the there are fewer than three noisy pixels in the level2.evt file, extra rows are filled as -1
| Pixel properties | Quadrant properties | ||||||
|---|---|---|---|---|---|---|---|
| Quadrant | DetID | PixID | Counts | Sigma | Mean | Median | Sigma |
| A | 1 | 162 | 9649 | 224.2 | 202 | 198 | 42.2 |
| A | 1 | 178 | 3009 | 66.68 | 202 | 198 | 42.2 |
| A | 1 | 161 | 2763 | 60.85 | 202 | 198 | 42.2 |
| B | 0 | 244 | 13844 | 348.05 | 201 | 197 | 39.2 |
| B | 4 | 142 | 7050 | 174.78 | 201 | 197 | 39.2 |
| B | 0 | 230 | 6014 | 148.36 | 201 | 197 | 39.2 |
| C | 3 | 233 | 38786 | 809.04 | 200 | 202 | 47.7 |
| C | 14 | 234 | 2237 | 42.67 | 200 | 202 | 47.7 |
| C | 13 | 61 | 1419 | 25.52 | 200 | 202 | 47.7 |
| D | 13 | 122 | 308213 | 6650.11 | 191 | 187 | 46.3 |
| D | 1 | 52 | 300671 | 6487.28 | 191 | 187 | 46.3 |
| D | 10 | 157 | 80543 | 1734.84 | 191 | 187 | 46.3 |
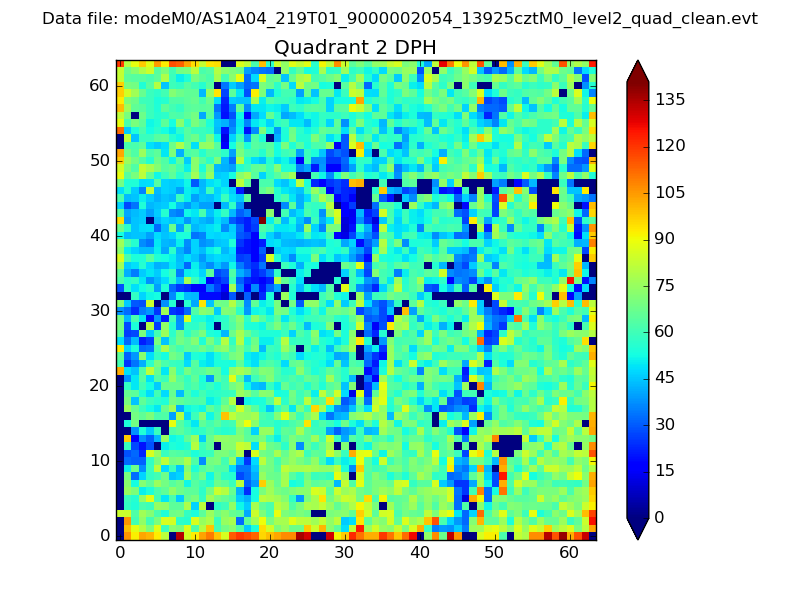
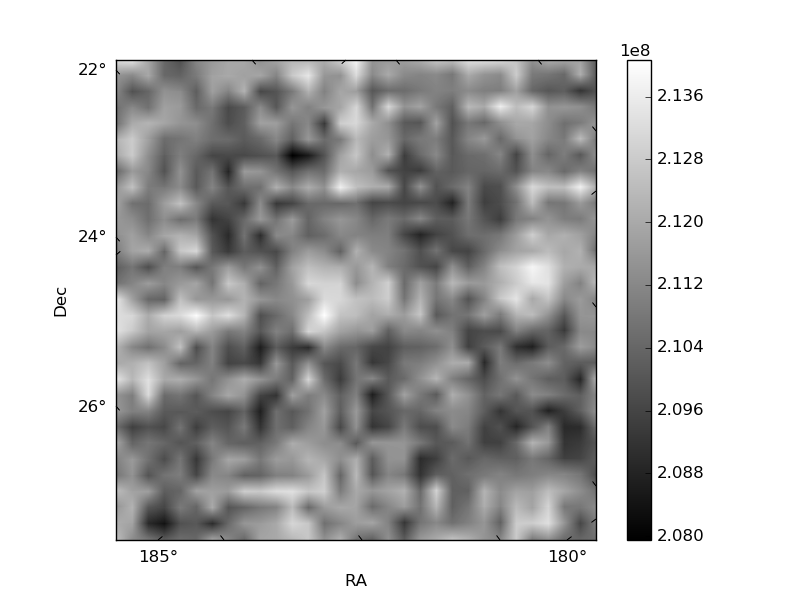
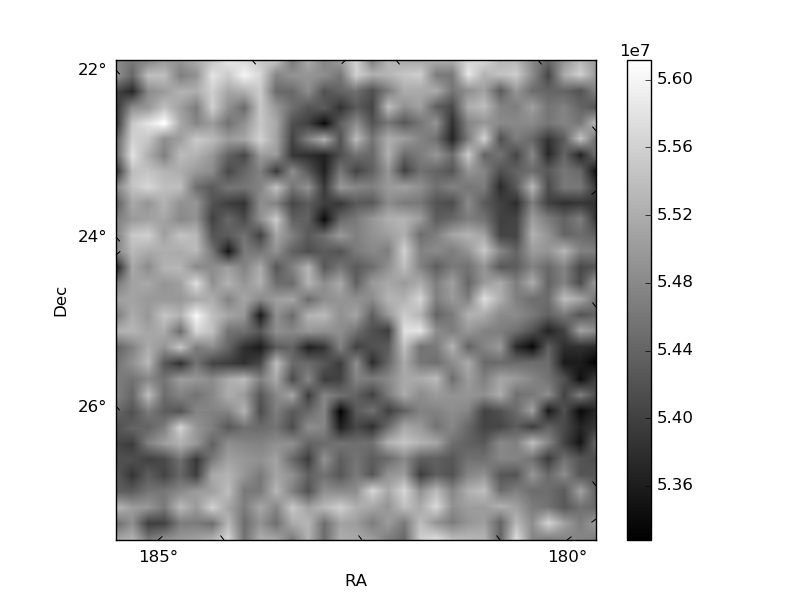
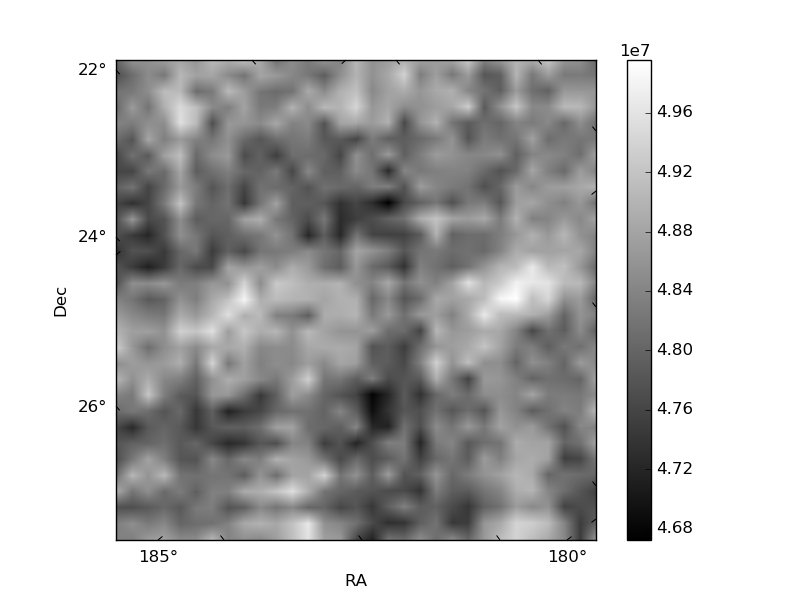
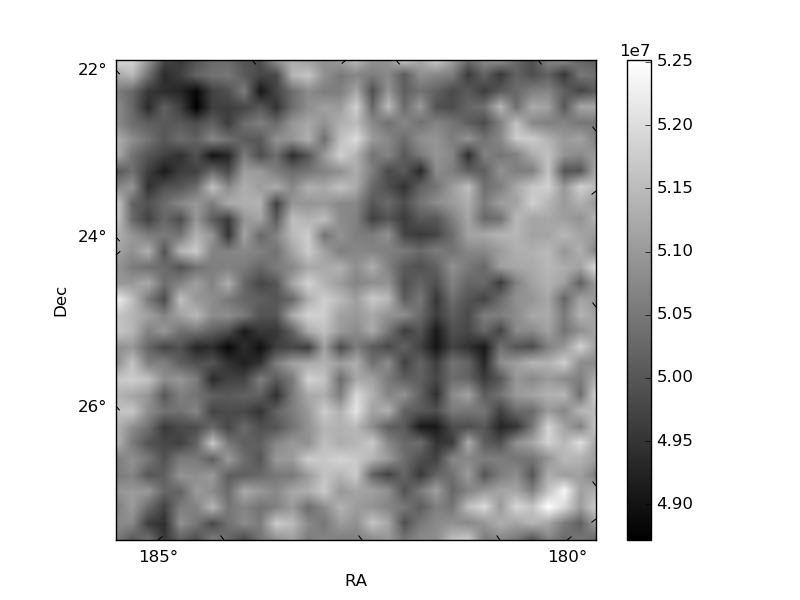
Histogram calculated using DETX and DETY for each event in the final _common_clean file
| Quadrant A | 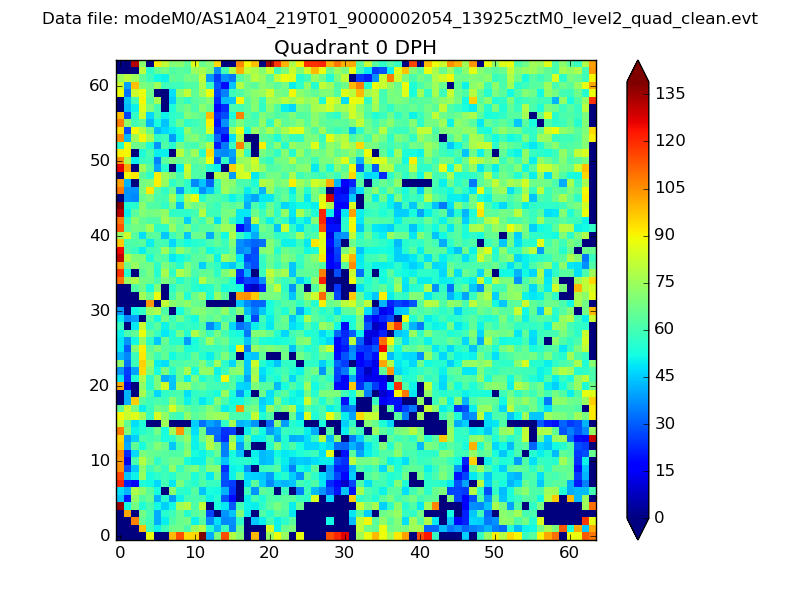 |
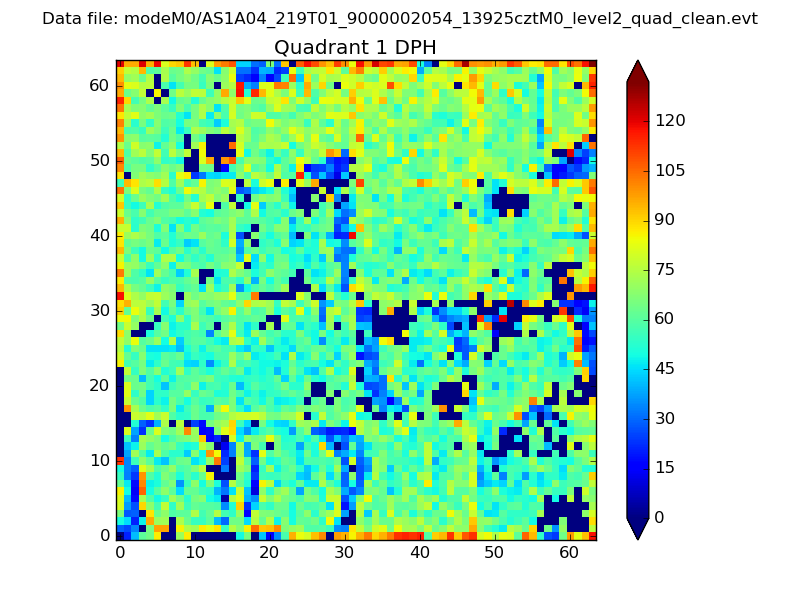 |
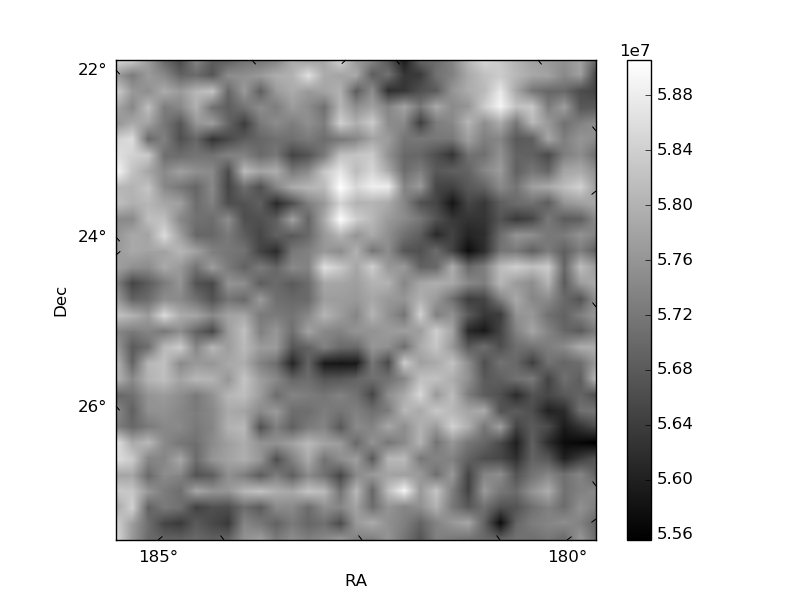
Quadrant B |
|---|---|---|---|
| Quadrant D | 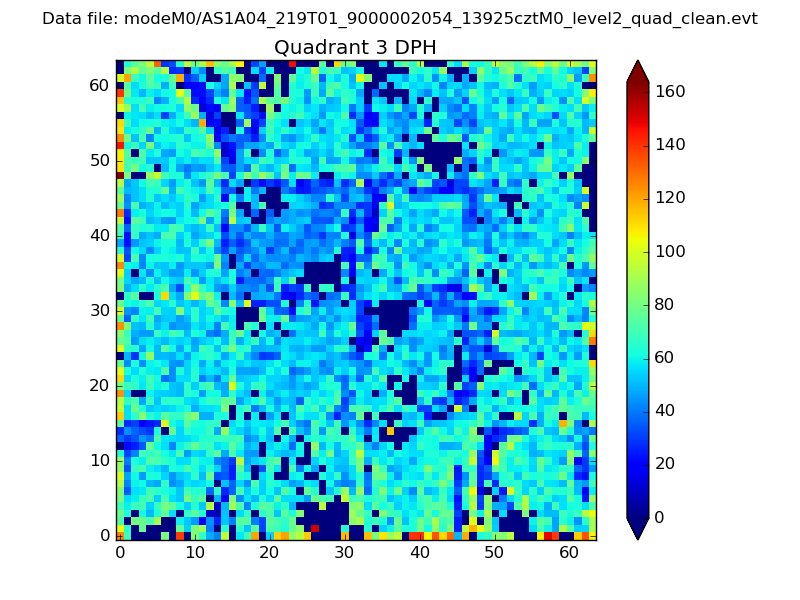 |
 |
Quadrant C |
| Plot type | Count rate plots | Images |
|---|---|---|
| Comparison with Poisson distribution Blue bars denote a histogram of data divided into 1 sec bins. Red curve is a Poisson curve with rate = median count rate of data. |
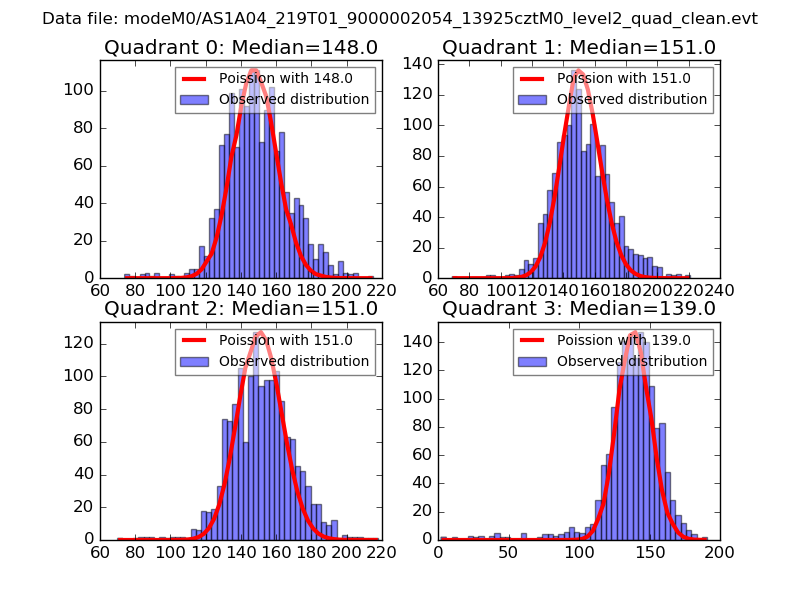 |
 |
| Quadrant-wise count rates Data is divided into 100 sec bins |
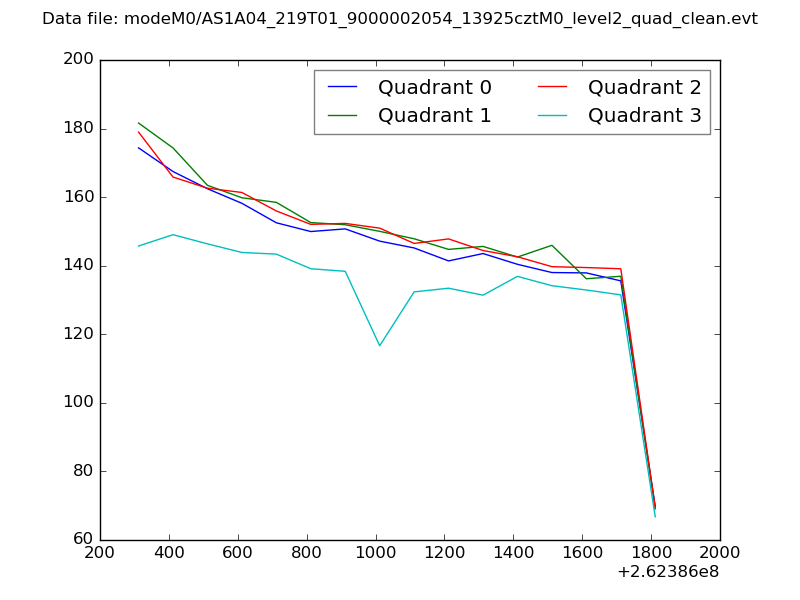 |
|
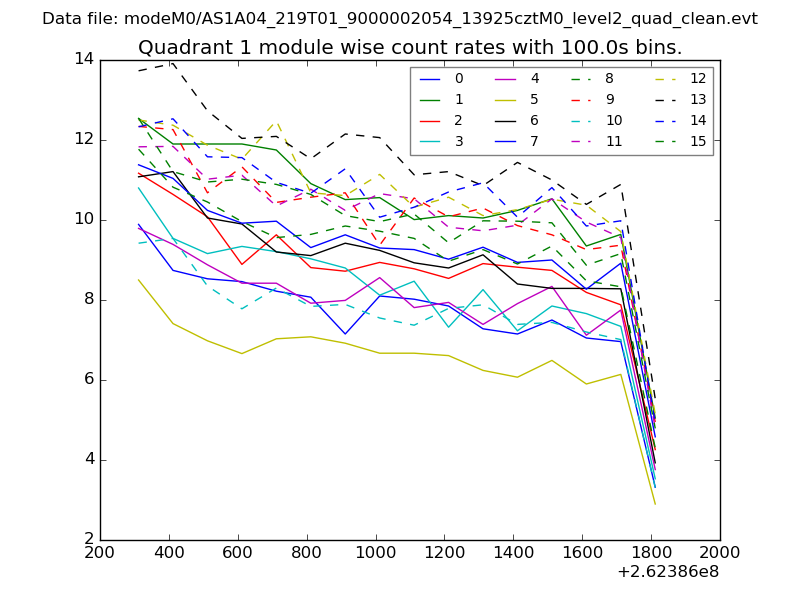
| Module-wise count rates for Quadrant A Data is divided into 100 sec bins |
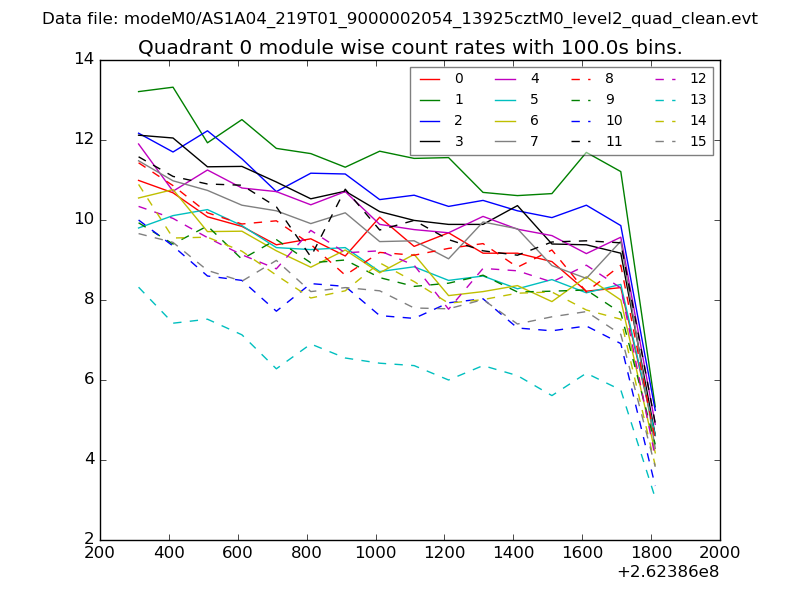 |
 |
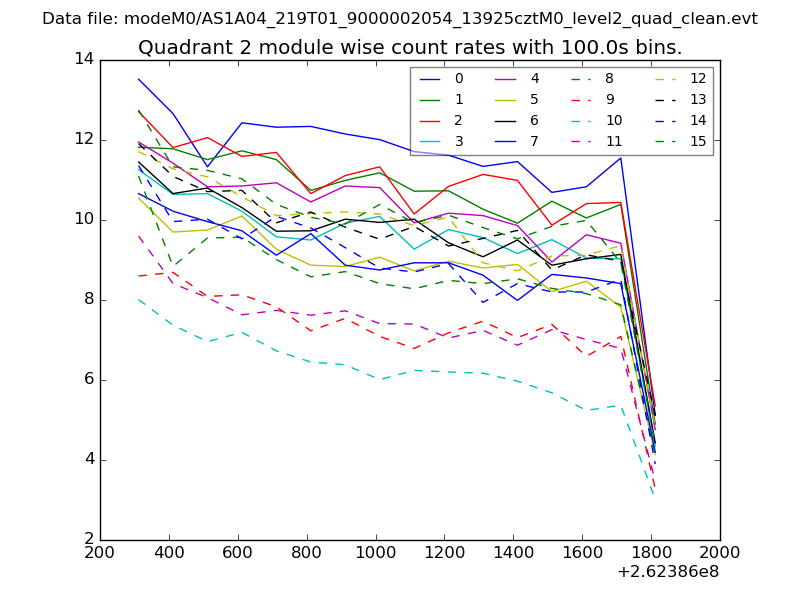
| Module-wise count rates for Quadrant B Data is divided into 100 sec bins |
 |
 |
| Module-wise count rates for Quadrant C Data is divided into 100 sec bins |
 |
 |
| Module-wise count rates for Quadrant D Data is divided into 100 sec bins |
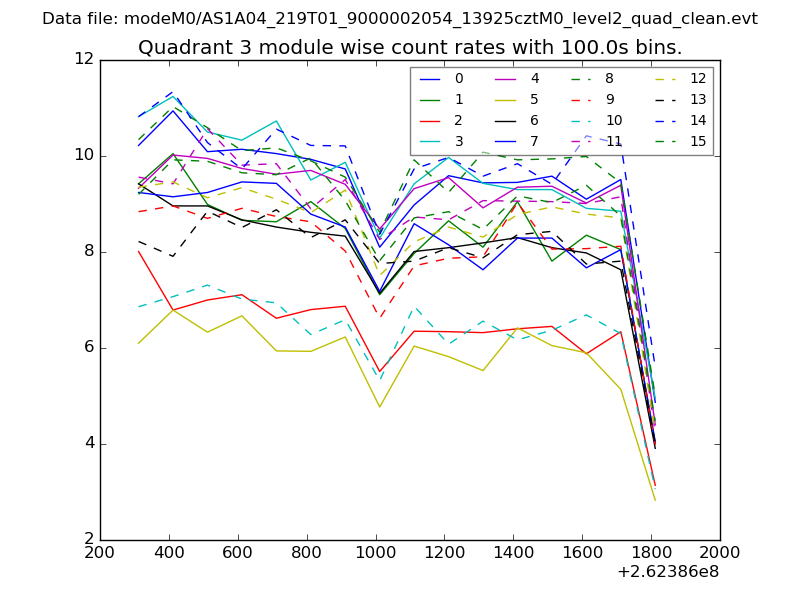 |
 |
| Parameter | Plot |
|---|---|
| CZT HV Monitor | 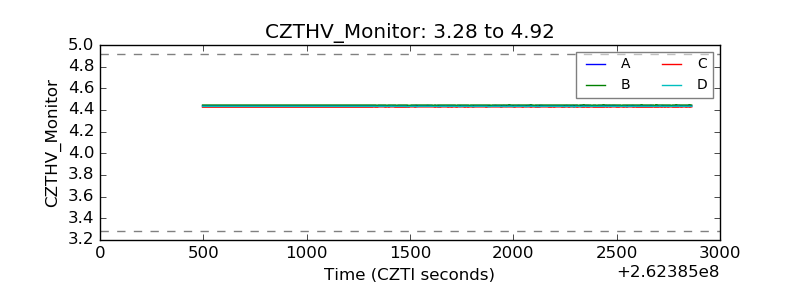 |
| D_VDD | 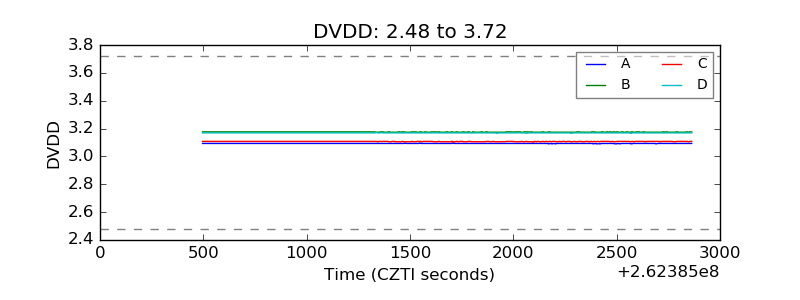 |
| Temperature 1 | 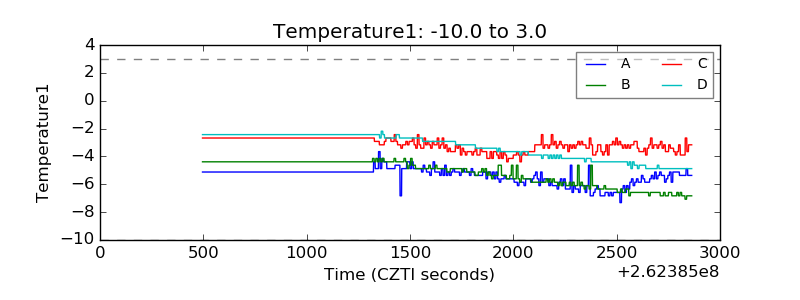 |
| Veto HV Monitor | 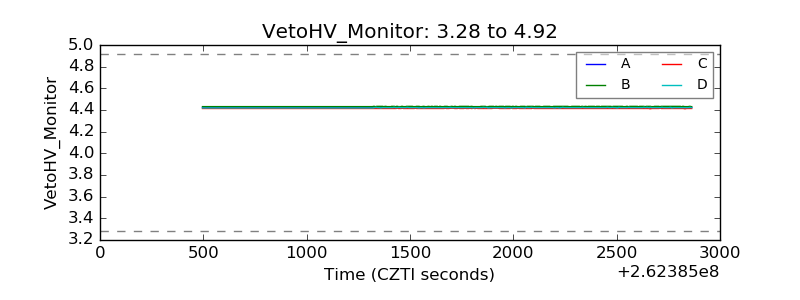 |
| Veto LLD | 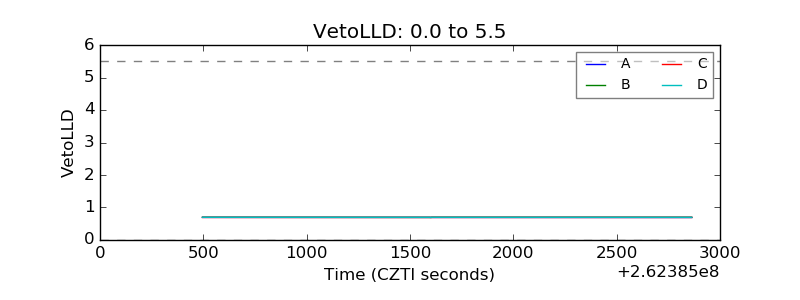 |
| Alpha Counter | 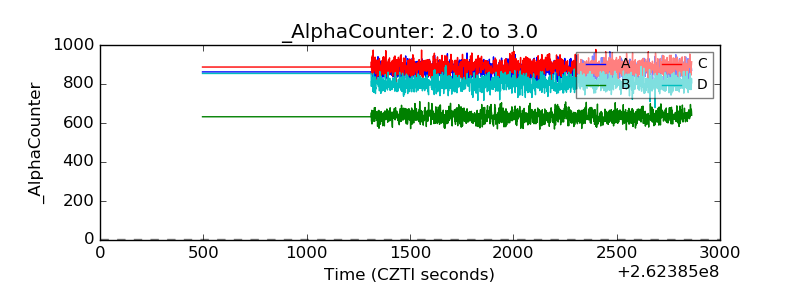 |
| _CPM_Rate | 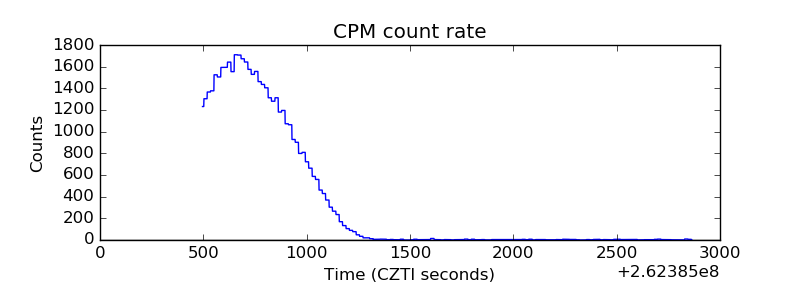 |
| CZT Counter | 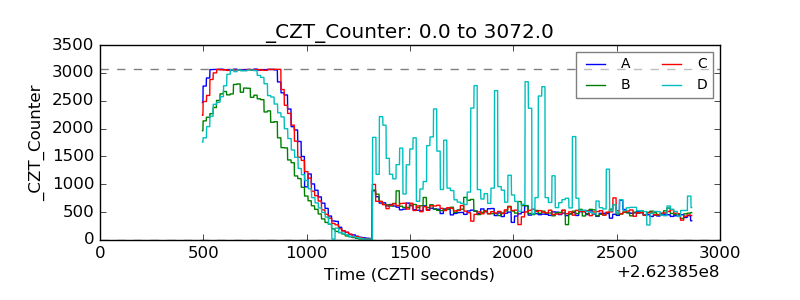 |
| +2.5 Volts monitor | 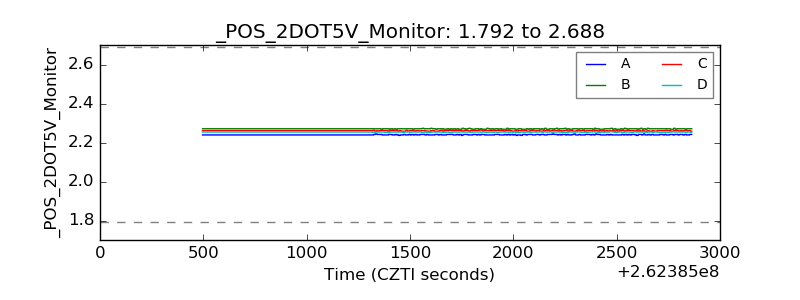 |
| +5 Volts monitor | 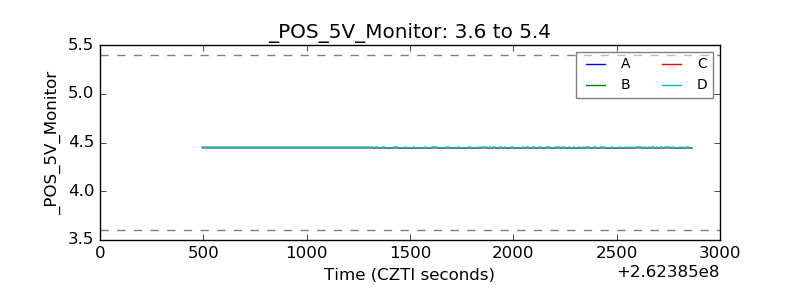 |
| _ROLL_ROT | 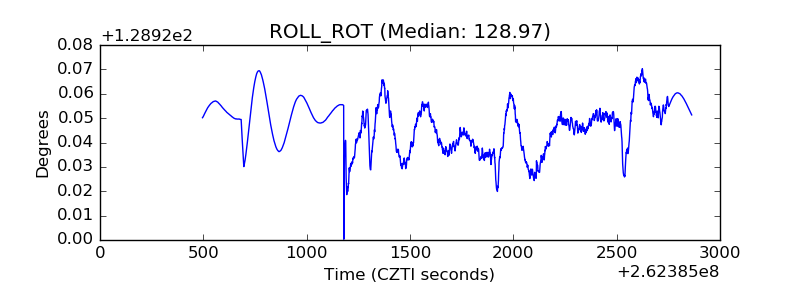 |
| _Roll_DEC | 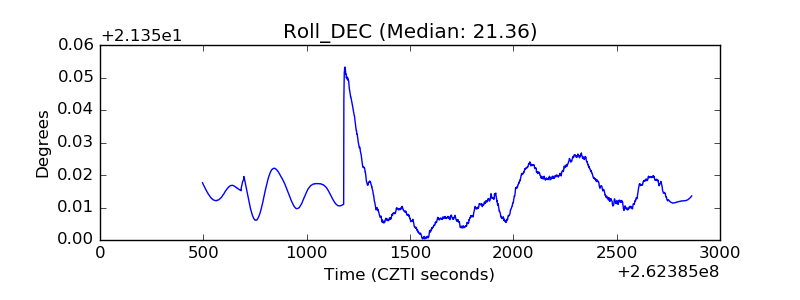 |
| _Roll_RA | 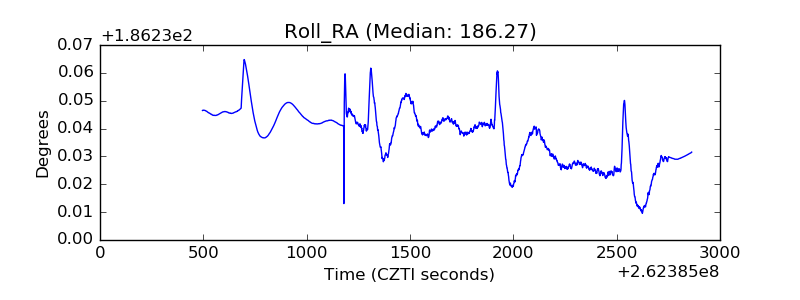 |
| Veto Counter | 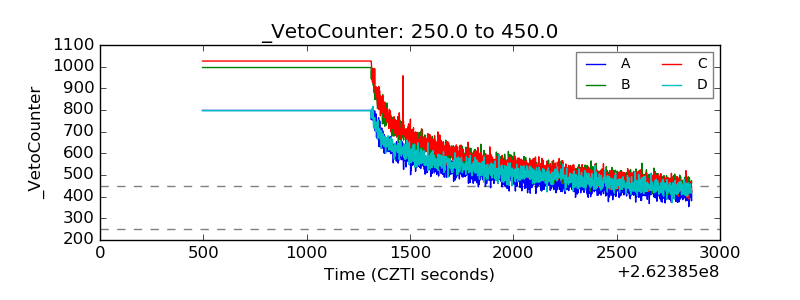 |