| Param | Original file | Final file |
|---|---|---|
| Filename | modeM0/AS1G08_076T01_9000002056cztM0_level2.fits | modeM0/AS1G08_076T01_9000002056cztM0_level2_quad_clean.evt |
| Size (bytes) | 279,999,360 | 271,333,440 |
| Size | 267.0 MB | 258.8 MB |
| Events in quadrant A | 1,675,564 | 1,541,259 |
| Events in quadrant B | 1,626,388 | 1,552,414 |
| Events in quadrant C | 1,679,594 | 1,608,642 |
| Events in quadrant D | 1,429,464 | 1,445,882 |
| Mode M9 | |||
|---|---|---|---|
| Quadrant | BADHDUFLAG | Total packets | Discarded packets |
| A | 0 | 33 | 0 |
| B | 0 | 33 | 0 |
| C | 0 | 33 | 0 |
| D | 0 | 33 | 0 |
| Mode M0 | |||
|---|---|---|---|
| Quadrant | BADHDUFLAG | Total packets | Discarded packets |
| A | 0 | 61851 | 0 |
| B | 0 | 63122 | 0 |
| C | 0 | 62402 | 0 |
| D | 0 | 76216 | 0 |
| Mode SS | |||
|---|---|---|---|
| Quadrant | BADHDUFLAG | Total packets | Discarded packets |
| A | 0 | 614 | 0 |
| B | 0 | 614 | 0 |
| C | 0 | 614 | 0 |
| D | 0 | 614 | 0 |
| Quadrant | Total seconds | Saturated seconds | Saturation percentage |
|---|---|---|---|
| A | 30096 | 317 | 1.053296% |
| B | 30096 | 419 | 1.392212% |
| C | 30096 | 221 | 0.734317% |
| D | 30096 | 802 | 2.664806% |
Noise dominated data is calculated using 1-second bins in cleaned event files. If a bin has >2000 counts, and if more than 50% of those come from <1% of pixels, then it is considered to be noise-dominated and hence unusable.
| Quadrant | # 1 sec bins | Bins with >0 counts | Bins with >2000 counts | High rate bins dominated by noise | Noise dominated (total time) | Noise dominated (detector-on time) | Marked lightcurve |
|---|---|---|---|---|---|---|---|
| A | 33360 | 30091 | 0 | 0 | 0.00% | 0.00% | 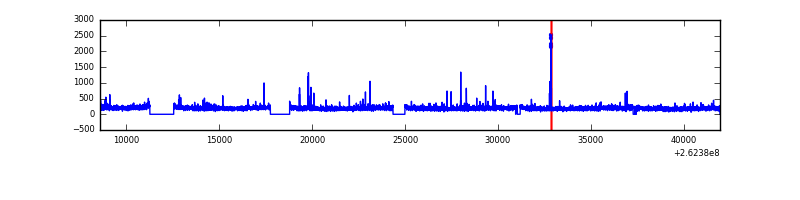 |
| B | 33360 | 30092 | 0 | 0 | 0.00% | 0.00% | 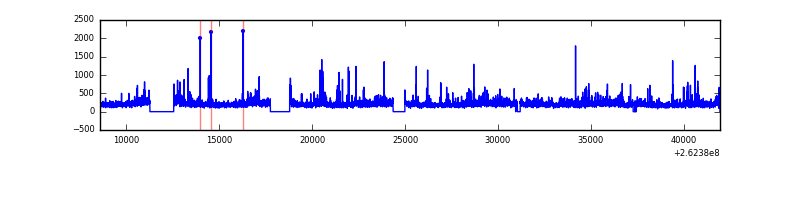 |
| C | 33360 | 30094 | 0 | 0 | 0.00% | 0.00% |  |
| D | 33361 | 30080 | 0 | 0 | 0.00% | 0.00% | 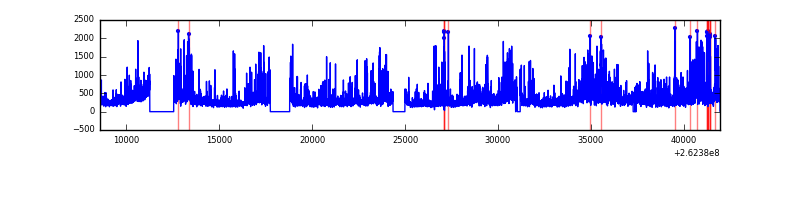 |
Top three noisy pixels from each quadrant. If the there are fewer than three noisy pixels in the level2.evt file, extra rows are filled as -1
| Pixel properties | Quadrant properties | ||||||
|---|---|---|---|---|---|---|---|
| Quadrant | DetID | PixID | Counts | Sigma | Mean | Median | Sigma |
| A | 0 | 29 | 1584 | 10.63 | 436 | 409 | 110.5 |
| A | 7 | 110 | 1368 | 8.68 | 436 | 409 | 110.5 |
| A | 9 | 19 | 1305 | 8.11 | 436 | 409 | 110.5 |
| B | 2 | 9 | 1407 | 11.49 | 428 | 407 | 87.1 |
| B | 2 | 8 | 1059 | 7.49 | 428 | 407 | 87.1 |
| B | 14 | 254 | 1058 | 7.48 | 428 | 407 | 87.1 |
| C | 1 | 81 | 1281 | 7.43 | 442 | 411 | 117.1 |
| C | 1 | 80 | 1242 | 7.1 | 442 | 411 | 117.1 |
| C | 12 | 241 | 1240 | 7.08 | 442 | 411 | 117.1 |
| D | 4 | 246 | 1171 | 7.04 | 407 | 368 | 114.0 |
| D | 3 | 14 | 1115 | 6.55 | 407 | 368 | 114.0 |
| D | 6 | 231 | 1087 | 6.31 | 407 | 368 | 114.0 |
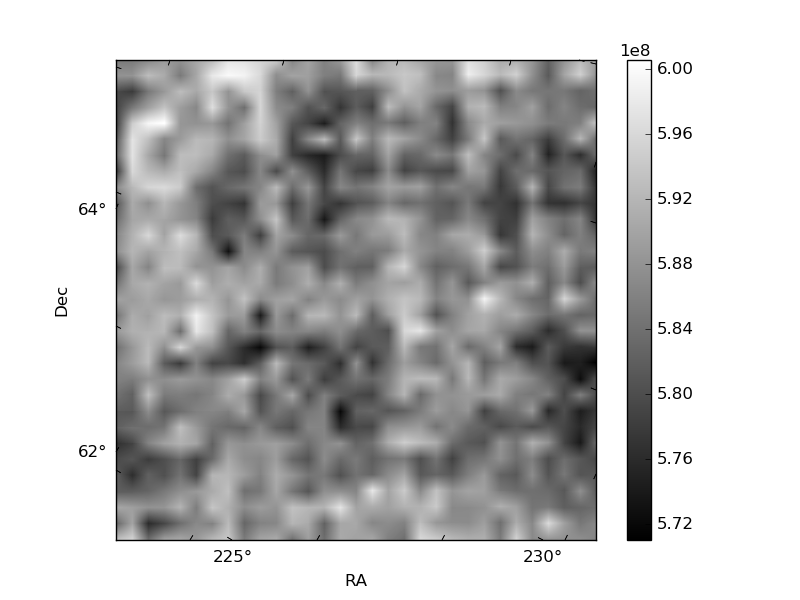
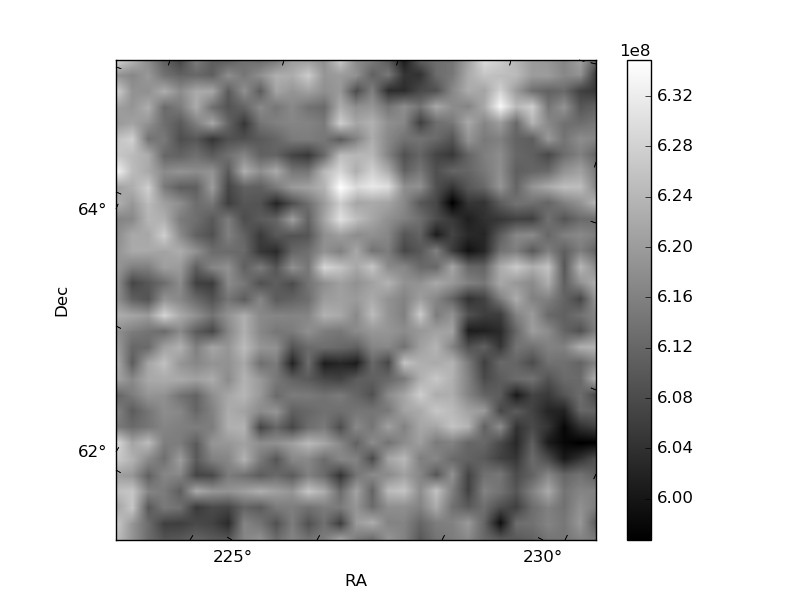
Histogram calculated using DETX and DETY for each event in the final _common_clean file
| Quadrant A | 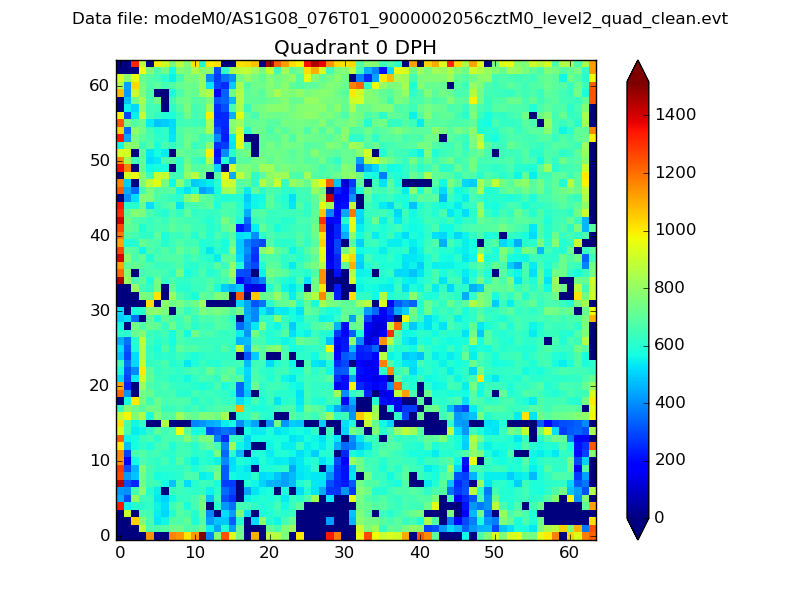 |
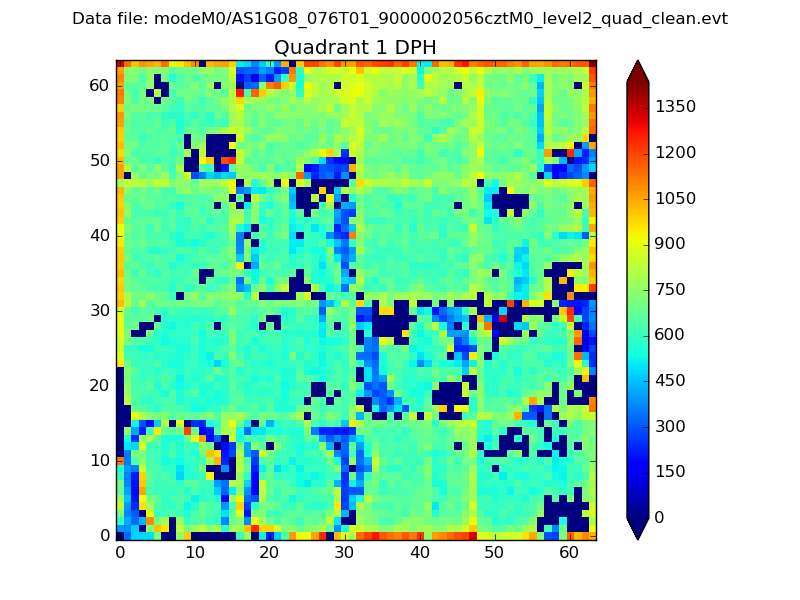 |
Quadrant B |
|---|---|---|---|
| Quadrant D | 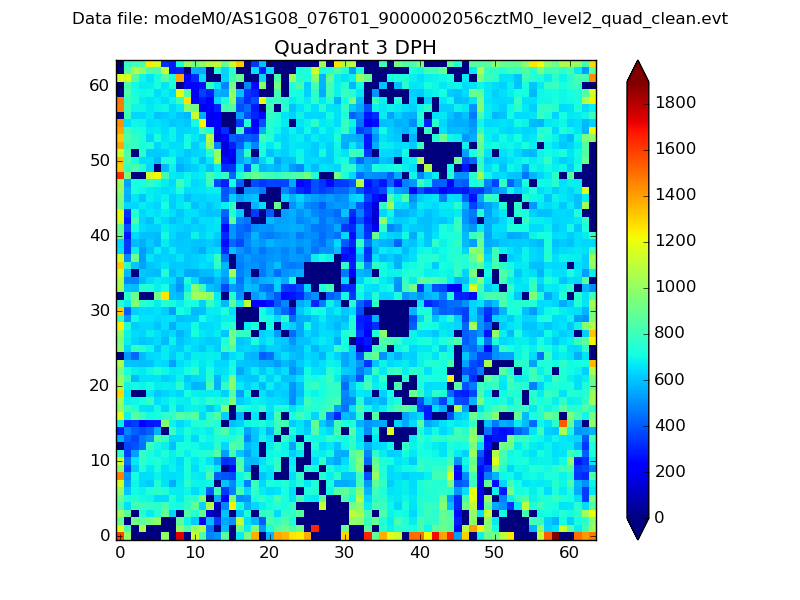 |
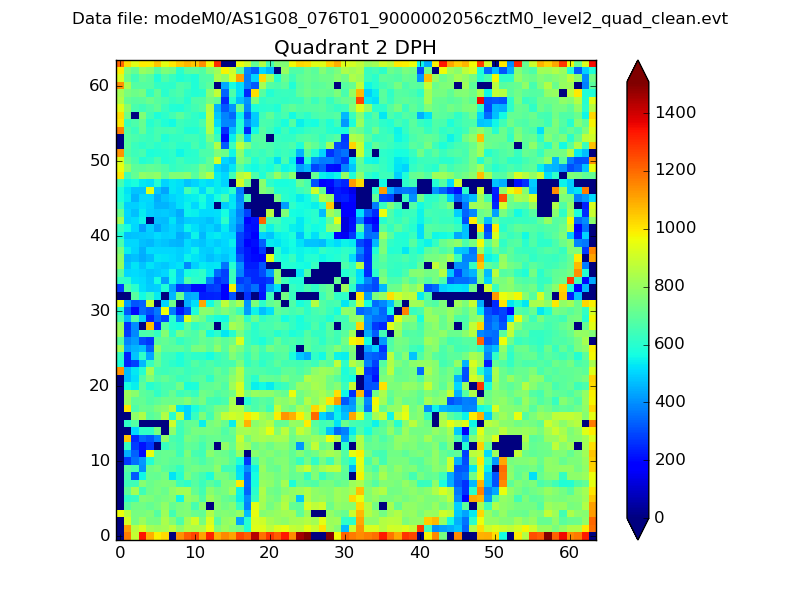 |
Quadrant C |
| Plot type | Count rate plots | Images |
|---|---|---|
| Comparison with Poisson distribution Blue bars denote a histogram of data divided into 1 sec bins. Red curve is a Poisson curve with rate = median count rate of data. |
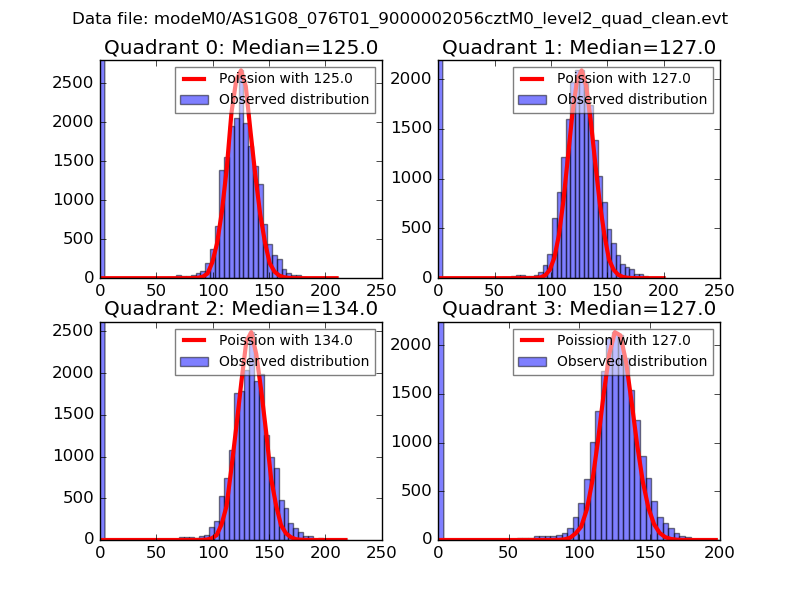 |
 |
| Quadrant-wise count rates Data is divided into 100 sec bins |
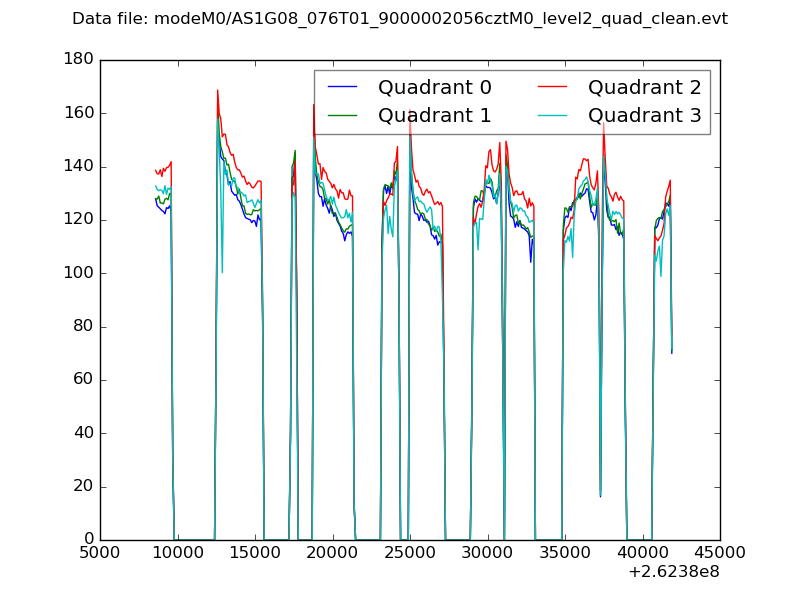 |
|
| Module-wise count rates for Quadrant A Data is divided into 100 sec bins |
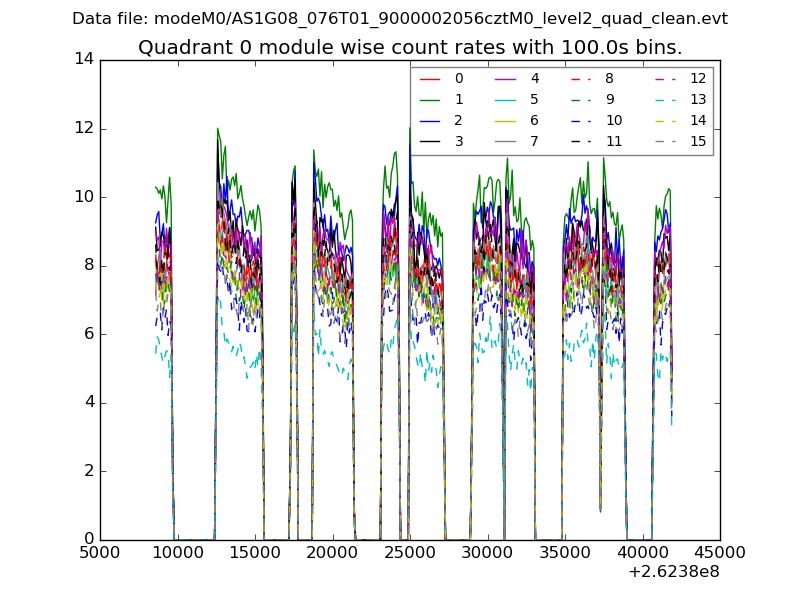 |
 |
| Module-wise count rates for Quadrant B Data is divided into 100 sec bins |
 |
 |
| Module-wise count rates for Quadrant C Data is divided into 100 sec bins |
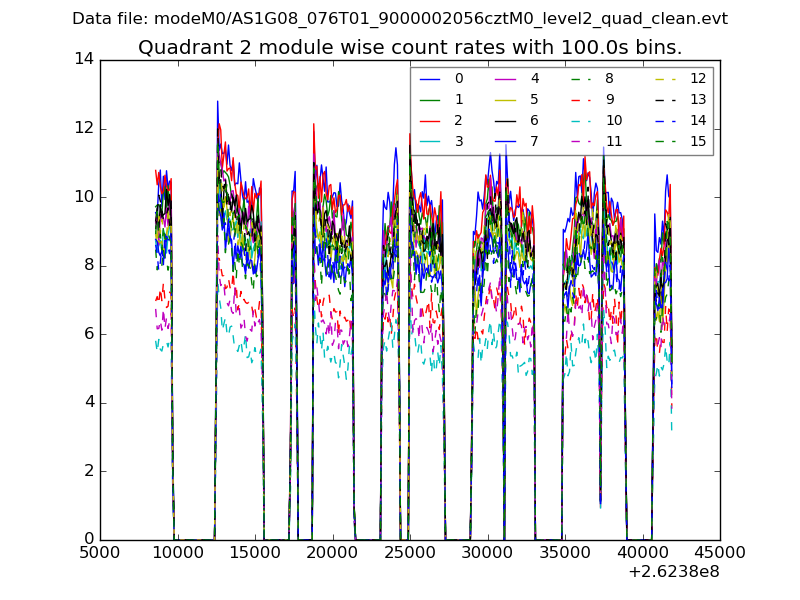 |
 |
| Module-wise count rates for Quadrant D Data is divided into 100 sec bins |
 |
 |
| Parameter | Plot |
|---|---|
| CZT HV Monitor |  |
| D_VDD | 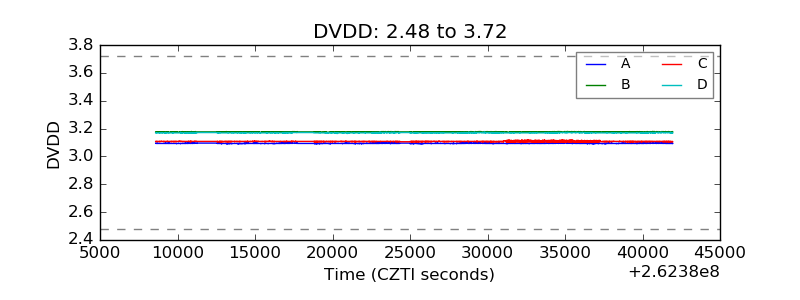 |
| Temperature 1 |  |
| Veto HV Monitor |  |
| Veto LLD | 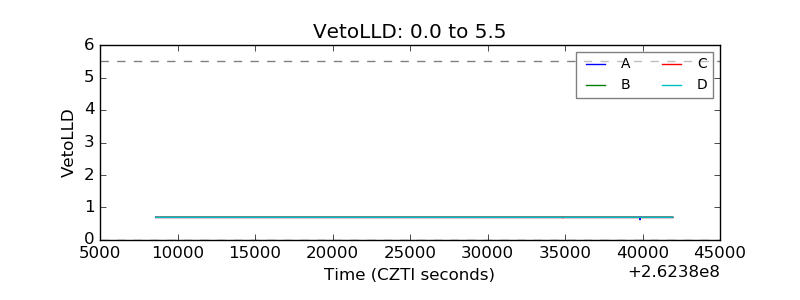 |
| Alpha Counter |  |
| _CPM_Rate | 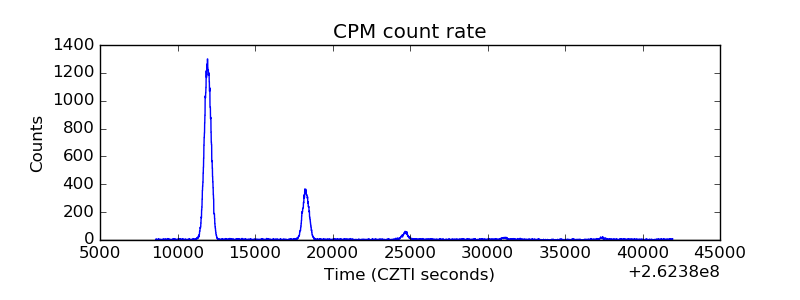 |
| CZT Counter |  |
| +2.5 Volts monitor |  |
| +5 Volts monitor | 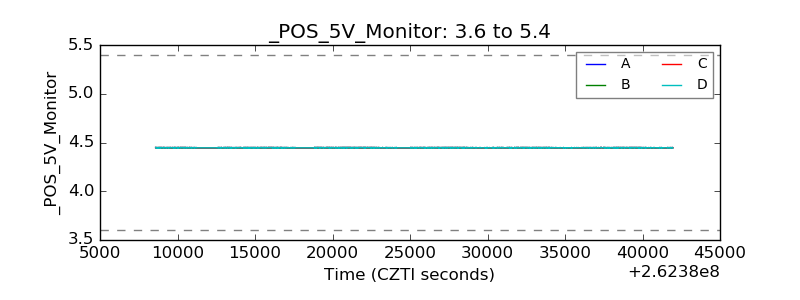 |
| _ROLL_ROT | 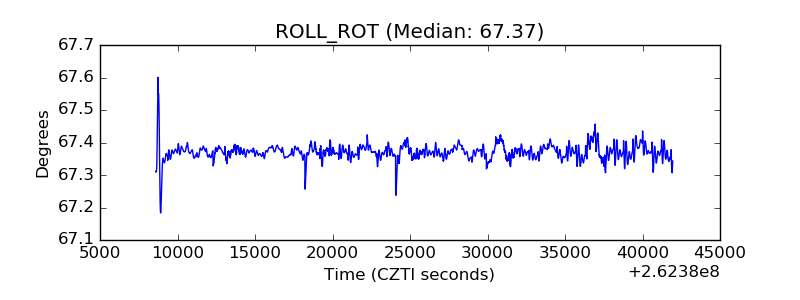 |
| _Roll_DEC | 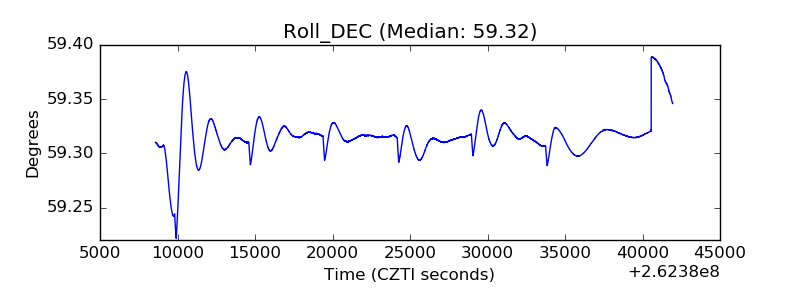 |
| _Roll_RA | 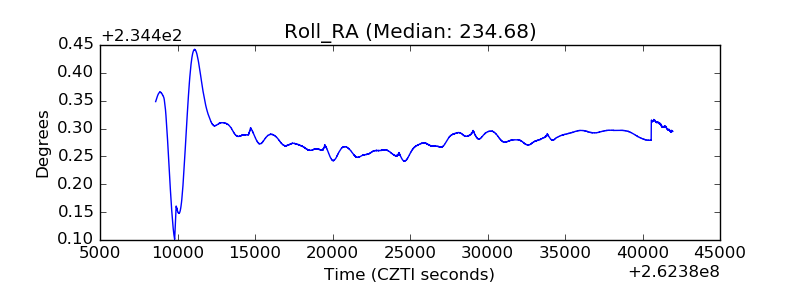 |
| Veto Counter |  |