| Param | Original file | Final file |
|---|---|---|
| Filename | modeM0/AS1G08_076T01_9000002056_13926cztM0_level2.evt | modeM0/AS1G08_076T01_9000002056_13926cztM0_level2_quad_clean.evt |
| Size (bytes) | 453,012,480 | 99,109,440 |
| Size | 432.0 MB | 94.5 MB |
| Events in quadrant A | 2,999,064 | 618,586 |
| Events in quadrant B | 3,172,361 | 633,546 |
| Events in quadrant C | 3,195,371 | 669,978 |
| Events in quadrant D | 3,908,239 | 623,329 |
| Mode M9 | |||
|---|---|---|---|
| Quadrant | BADHDUFLAG | Total packets | Discarded packets |
| A | 0 | 16 | 0 |
| B | 0 | 16 | 0 |
| C | 0 | 16 | 0 |
| D | 0 | 17 | 0 |
| Mode M0 | |||
|---|---|---|---|
| Quadrant | BADHDUFLAG | Total packets | Discarded packets |
| A | 0 | 13450 | 3 |
| B | 0 | 13886 | 2 |
| C | 0 | 13681 | 2 |
| D | 0 | 16052 | 2 |
| Mode SS | |||
|---|---|---|---|
| Quadrant | BADHDUFLAG | Total packets | Discarded packets |
| A | 0 | 134 | 0 |
| B | 0 | 134 | 0 |
| C | 0 | 134 | 0 |
| D | 0 | 134 | 0 |
| Quadrant | Total seconds | Saturated seconds | Saturation percentage |
|---|---|---|---|
| A | 6537 | 19 | 0.290653% |
| B | 6537 | 45 | 0.688389% |
| C | 6537 | 22 | 0.336546% |
| D | 6537 | 147 | 2.248738% |
Noise dominated data is calculated using 1-second bins in cleaned event files. If a bin has >2000 counts, and if more than 50% of those come from <1% of pixels, then it is considered to be noise-dominated and hence unusable.
| Quadrant | # 1 sec bins | Bins with >0 counts | Bins with >2000 counts | High rate bins dominated by noise | Noise dominated (total time) | Noise dominated (detector-on time) | Marked lightcurve |
|---|---|---|---|---|---|---|---|
| A | 7578 | 6539 | 0 | 0 | 0.00% | 0.00% | 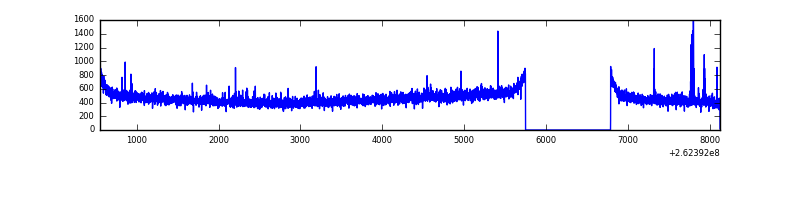 |
| B | 7578 | 6539 | 5 | 5 | 0.07% | 0.08% | 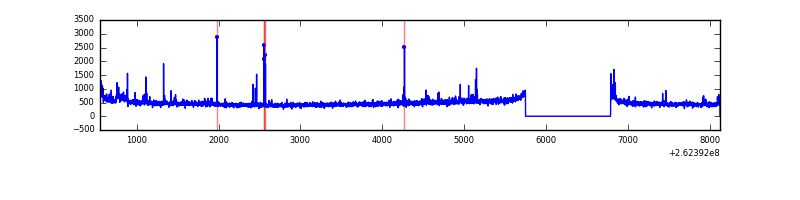 |
| C | 7578 | 6539 | 0 | 0 | 0.00% | 0.00% | 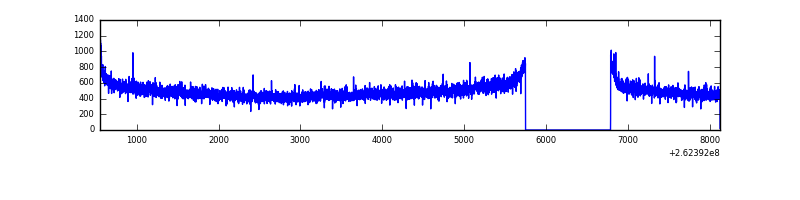 |
| D | 7578 | 6539 | 106 | 106 | 1.40% | 1.62% | 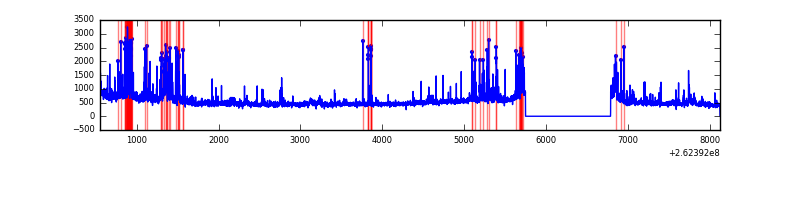 |
Top three noisy pixels from each quadrant. If the there are fewer than three noisy pixels in the level2.evt file, extra rows are filled as -1
| Pixel properties | Quadrant properties | ||||||
|---|---|---|---|---|---|---|---|
| Quadrant | DetID | PixID | Counts | Sigma | Mean | Median | Sigma |
| A | 8 | 15 | 26414 | 166.81 | 766 | 750 | 153.8 |
| A | 1 | 162 | 11166 | 67.7 | 766 | 750 | 153.8 |
| A | 0 | 226 | 6647 | 38.33 | 766 | 750 | 153.8 |
| B | 0 | 214 | 31053 | 207.46 | 773 | 752 | 146.1 |
| B | 4 | 80 | 29863 | 199.31 | 773 | 752 | 146.1 |
| B | 0 | 230 | 22583 | 149.47 | 773 | 752 | 146.1 |
| C | 3 | 233 | 190909 | 1077.33 | 770 | 775 | 176.5 |
| C | 13 | 61 | 5710 | 27.96 | 770 | 775 | 176.5 |
| C | 14 | 234 | 2670 | 10.74 | 770 | 775 | 176.5 |
| D | 1 | 52 | 257581 | 1467.49 | 743 | 726 | 175.0 |
| D | 13 | 189 | 200828 | 1143.24 | 743 | 726 | 175.0 |
| D | 7 | 80 | 138867 | 789.24 | 743 | 726 | 175.0 |
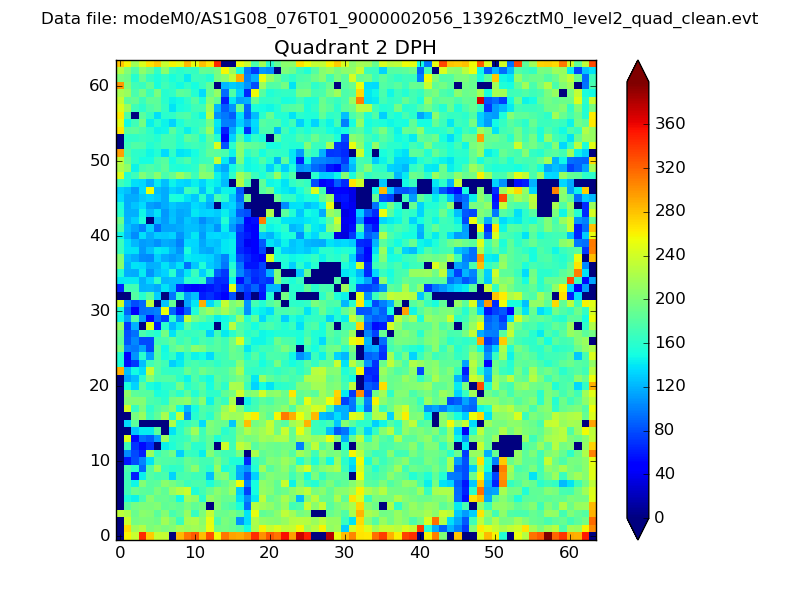
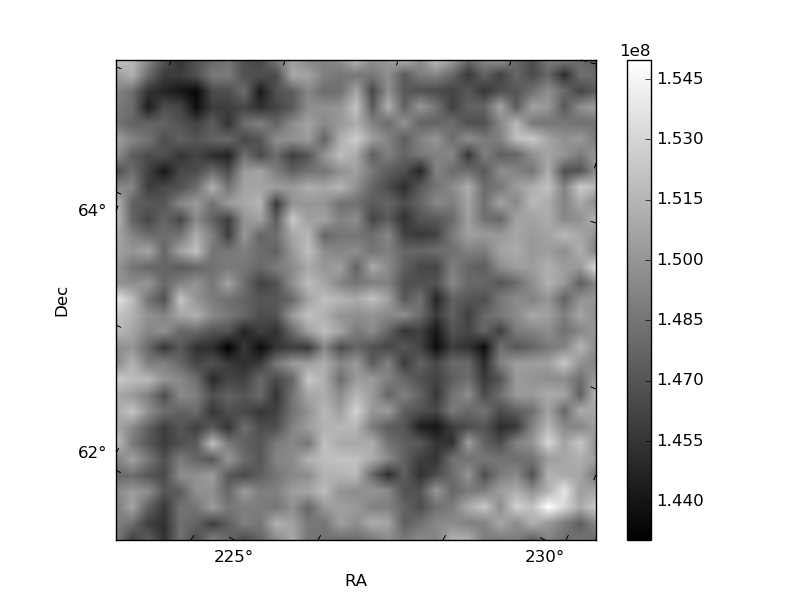
Histogram calculated using DETX and DETY for each event in the final _common_clean file
| Quadrant A |  |
 |
Quadrant B |
|---|---|---|---|
| Quadrant D | 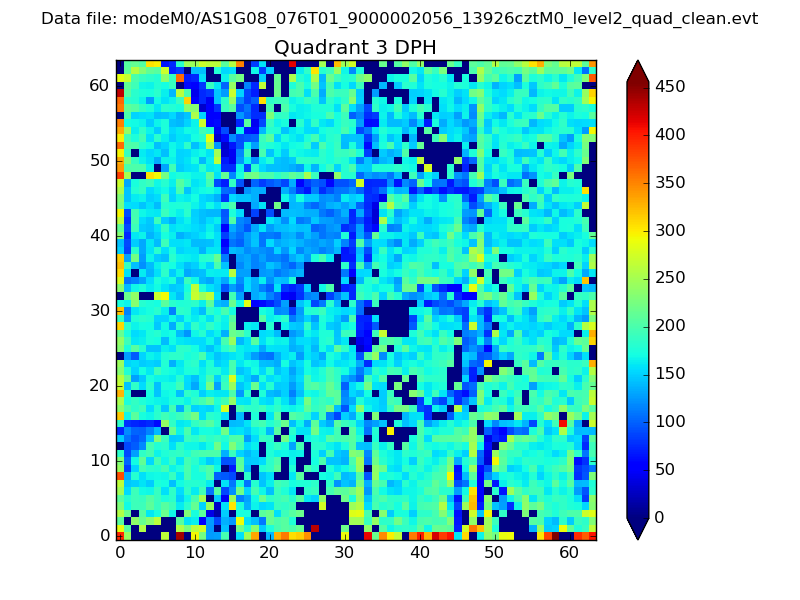 |
 |
Quadrant C |
| Plot type | Count rate plots | Images |
|---|---|---|
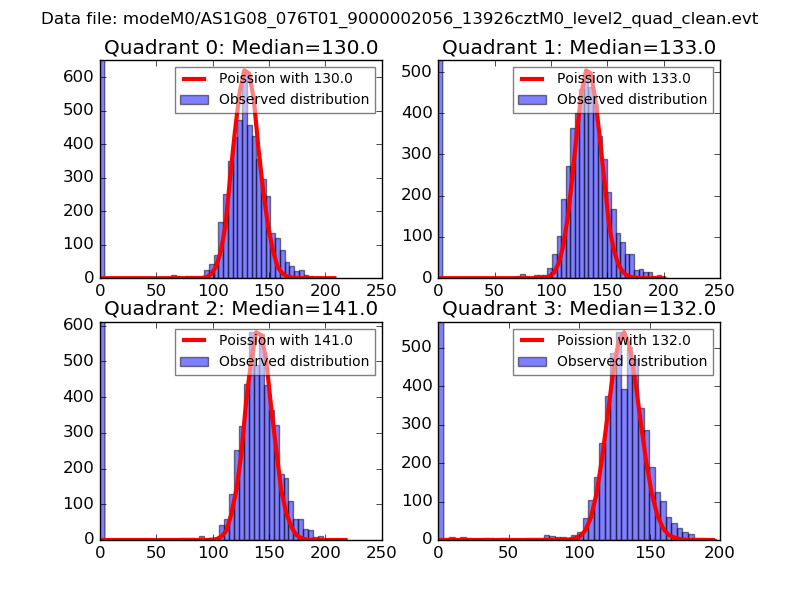
| Comparison with Poisson distribution Blue bars denote a histogram of data divided into 1 sec bins. Red curve is a Poisson curve with rate = median count rate of data. |
 |
 |
| Quadrant-wise count rates Data is divided into 100 sec bins |
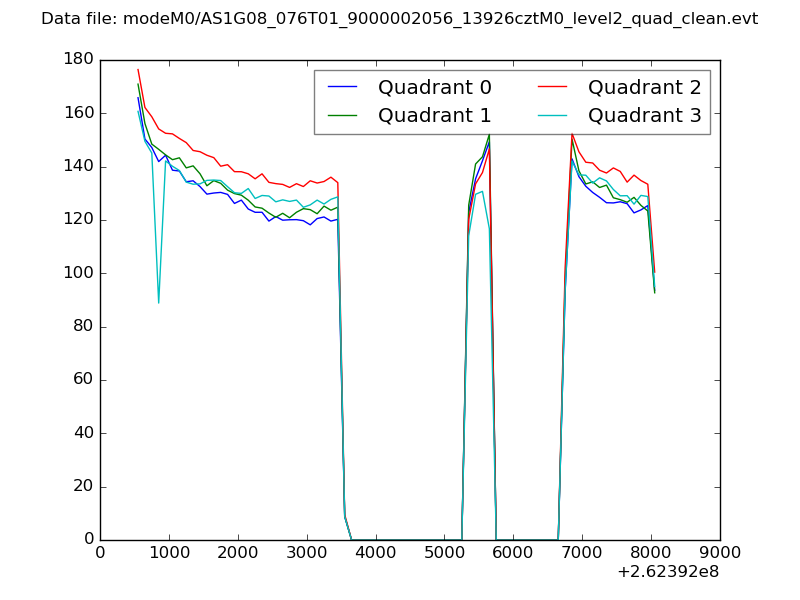 |
|
| Module-wise count rates for Quadrant A Data is divided into 100 sec bins |
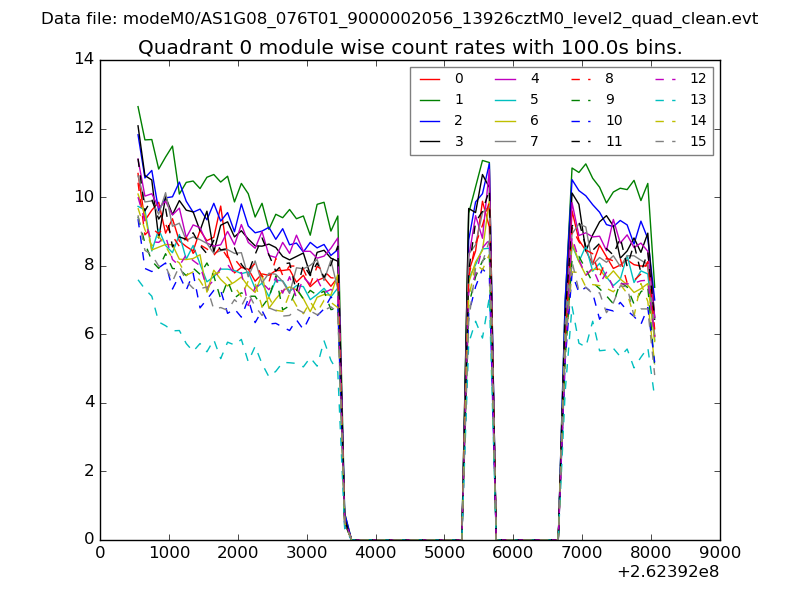 |
 |
| Module-wise count rates for Quadrant B Data is divided into 100 sec bins |
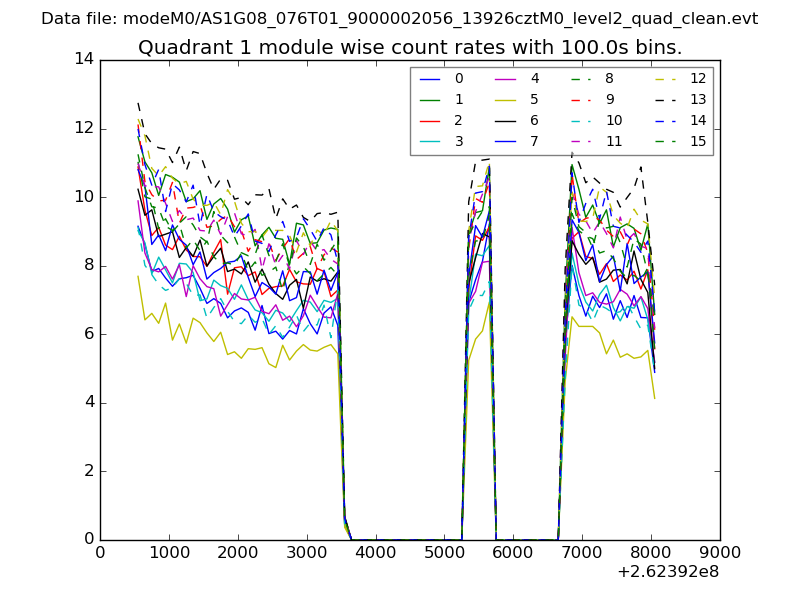 |
 |
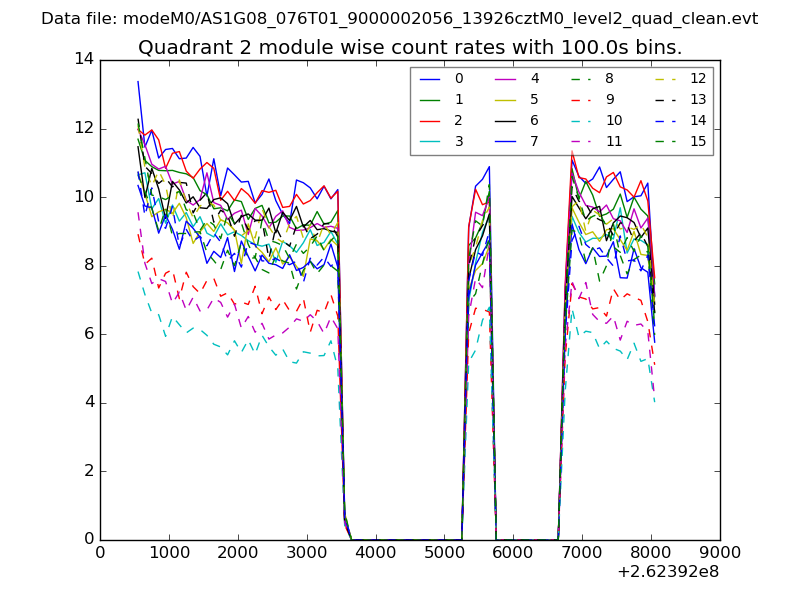
| Module-wise count rates for Quadrant C Data is divided into 100 sec bins |
 |
 |
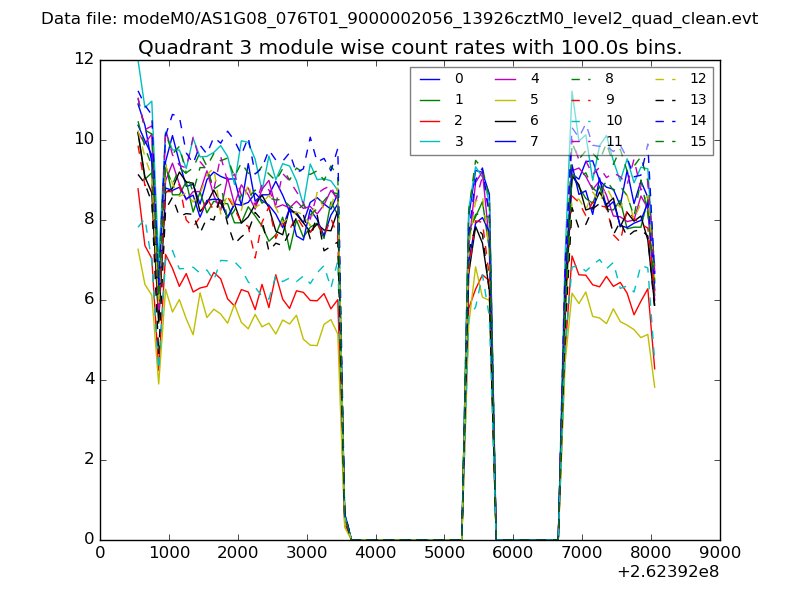
| Module-wise count rates for Quadrant D Data is divided into 100 sec bins |
 |
 |
| Parameter | Plot |
|---|---|
| CZT HV Monitor | 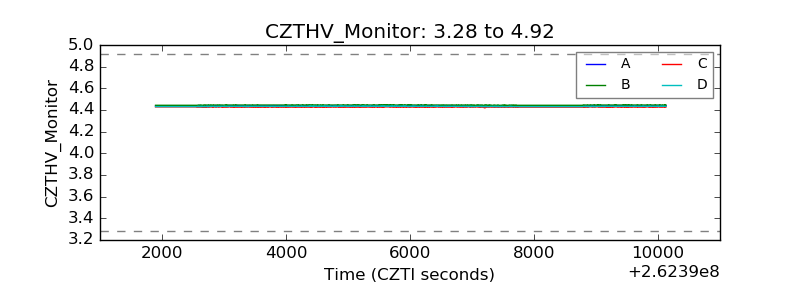 |
| D_VDD | 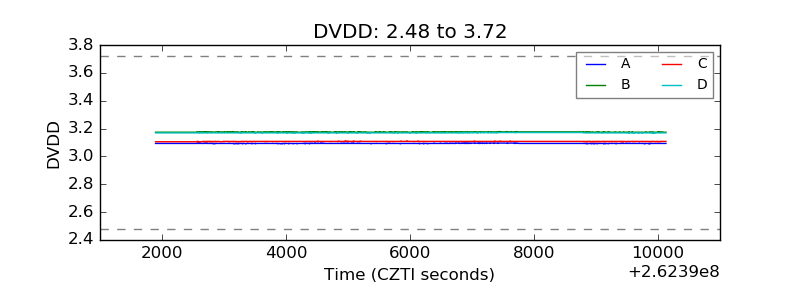 |
| Temperature 1 | 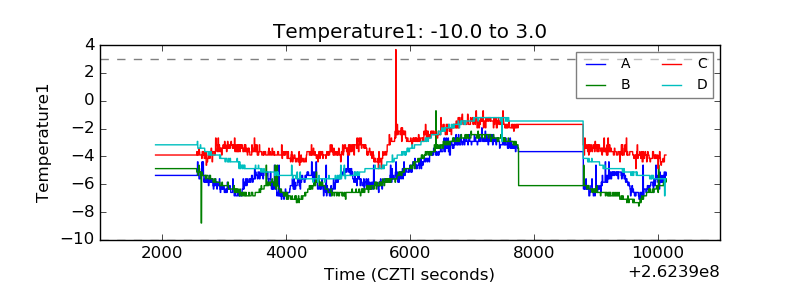 |
| Veto HV Monitor |  |
| Veto LLD | 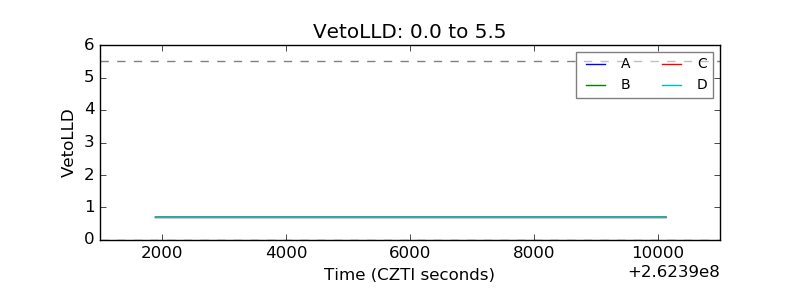 |
| Alpha Counter | 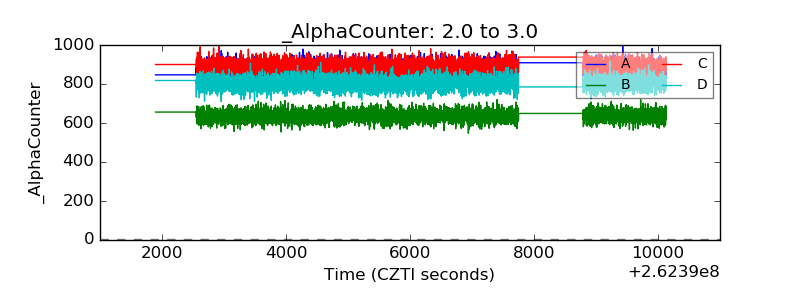 |
| _CPM_Rate | 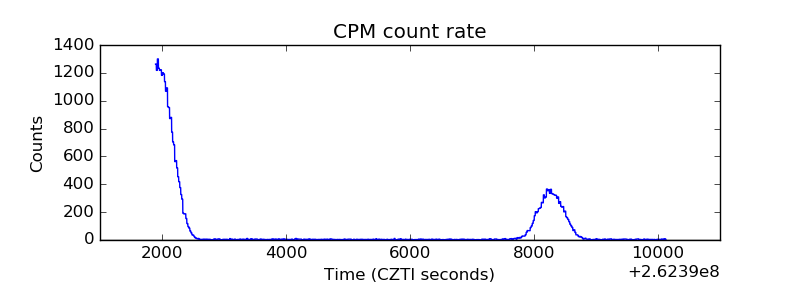 |
| CZT Counter | 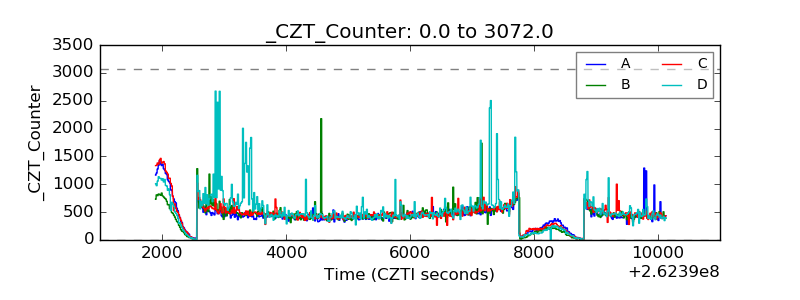 |
| +2.5 Volts monitor | 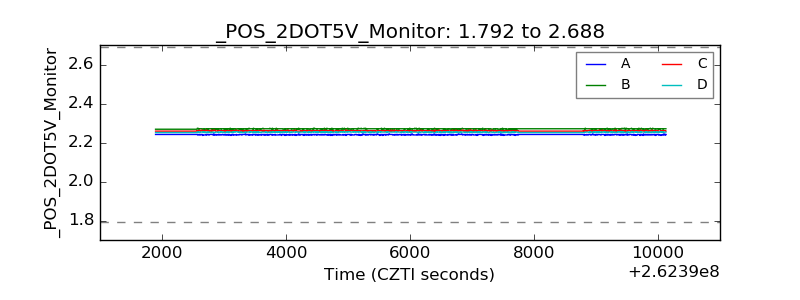 |
| +5 Volts monitor |  |
| _ROLL_ROT | 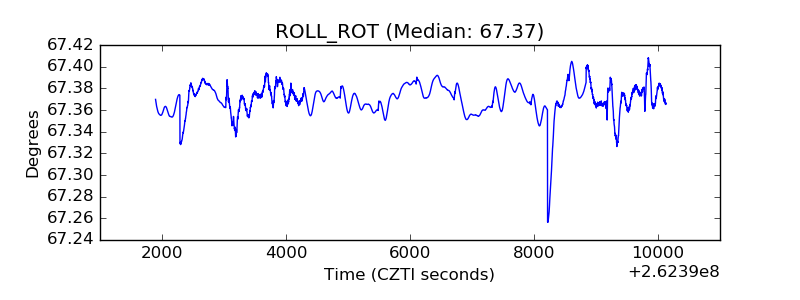 |
| _Roll_DEC | 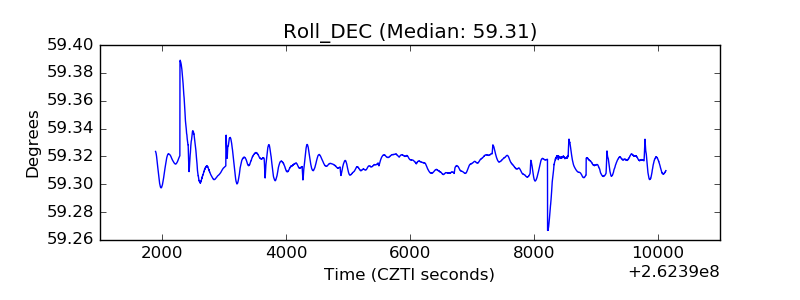 |
| _Roll_RA | 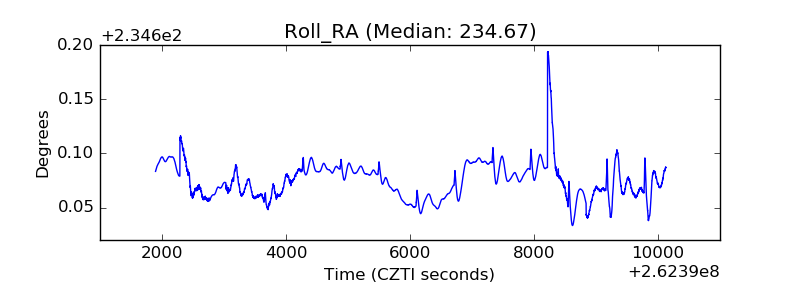 |
| Veto Counter | 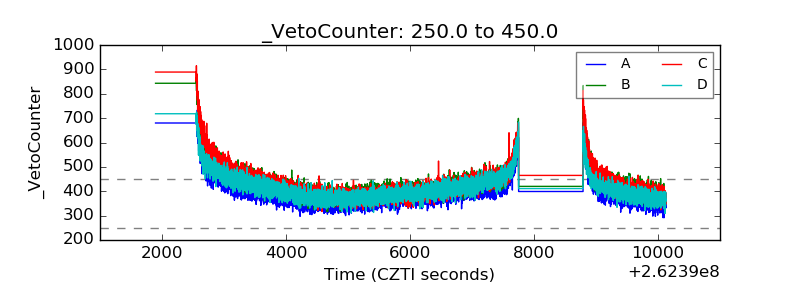 |