| Param | Original file | Final file |
|---|---|---|
| Filename | modeM0/AS1G08_076T01_9000002056_13927cztM0_level2.evt | modeM0/AS1G08_076T01_9000002056_13927cztM0_level2_quad_clean.evt |
| Size (bytes) | 507,853,440 | 112,584,960 |
| Size | 484.3 MB | 107.4 MB |
| Events in quadrant A | 3,426,221 | 706,461 |
| Events in quadrant B | 3,630,239 | 719,000 |
| Events in quadrant C | 3,610,739 | 753,309 |
| Events in quadrant D | 4,205,652 | 710,941 |
| Mode M9 | |||
|---|---|---|---|
| Quadrant | BADHDUFLAG | Total packets | Discarded packets |
| A | 0 | 16 | 0 |
| B | 0 | 16 | 0 |
| C | 0 | 16 | 0 |
| D | 0 | 16 | 0 |
| Mode M0 | |||
|---|---|---|---|
| Quadrant | BADHDUFLAG | Total packets | Discarded packets |
| A | 0 | 15446 | 3 |
| B | 0 | 15822 | 2 |
| C | 0 | 15638 | 2 |
| D | 0 | 17609 | 2 |
| Mode SS | |||
|---|---|---|---|
| Quadrant | BADHDUFLAG | Total packets | Discarded packets |
| A | 0 | 156 | 0 |
| B | 0 | 156 | 0 |
| C | 0 | 156 | 0 |
| D | 0 | 156 | 0 |
| Quadrant | Total seconds | Saturated seconds | Saturation percentage |
|---|---|---|---|
| A | 7465 | 30 | 0.401875% |
| B | 7465 | 64 | 0.857334% |
| C | 7465 | 35 | 0.468855% |
| D | 7465 | 175 | 2.344273% |
Noise dominated data is calculated using 1-second bins in cleaned event files. If a bin has >2000 counts, and if more than 50% of those come from <1% of pixels, then it is considered to be noise-dominated and hence unusable.
| Quadrant | # 1 sec bins | Bins with >0 counts | Bins with >2000 counts | High rate bins dominated by noise | Noise dominated (total time) | Noise dominated (detector-on time) | Marked lightcurve |
|---|---|---|---|---|---|---|---|
| A | 9146 | 7467 | 0 | 0 | 0.00% | 0.00% | 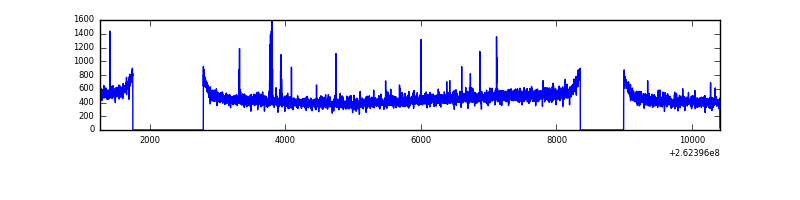 |
| B | 9146 | 7468 | 1 | 1 | 0.01% | 0.01% | 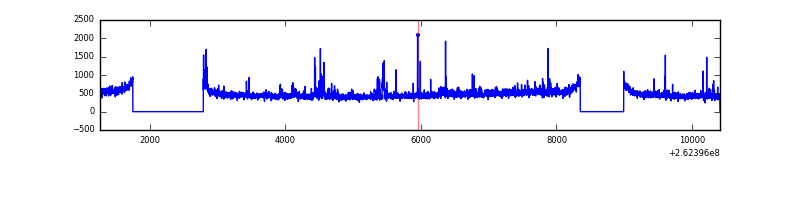 |
| C | 9146 | 7468 | 1 | 1 | 0.01% | 0.01% | 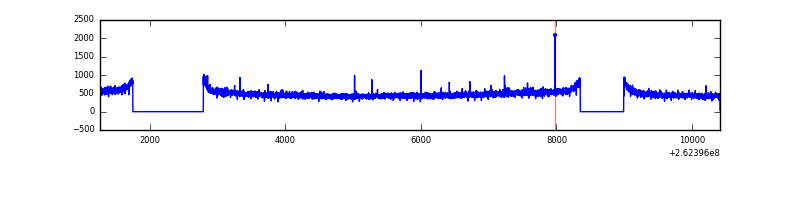 |
| D | 9146 | 7468 | 96 | 96 | 1.05% | 1.29% | 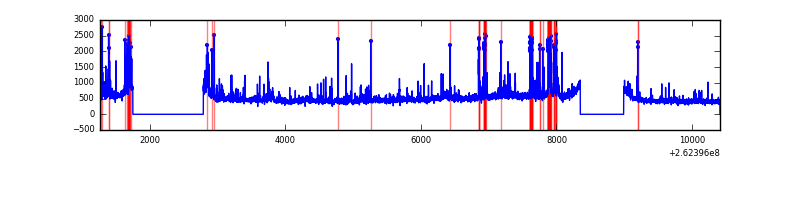 |
Top three noisy pixels from each quadrant. If the there are fewer than three noisy pixels in the level2.evt file, extra rows are filled as -1
| Pixel properties | Quadrant properties | ||||||
|---|---|---|---|---|---|---|---|
| Quadrant | DetID | PixID | Counts | Sigma | Mean | Median | Sigma |
| A | 8 | 15 | 34135 | 186.91 | 877 | 857 | 178.0 |
| A | 1 | 162 | 11966 | 62.4 | 877 | 857 | 178.0 |
| A | 0 | 226 | 7666 | 38.24 | 877 | 857 | 178.0 |
| B | 10 | 245 | 88786 | 524.76 | 882 | 858 | 167.6 |
| B | 0 | 214 | 23471 | 134.96 | 882 | 858 | 167.6 |
| B | 12 | 111 | 20131 | 115.02 | 882 | 858 | 167.6 |
| C | 3 | 233 | 193286 | 950.85 | 876 | 881 | 202.4 |
| C | 13 | 61 | 6394 | 27.24 | 876 | 881 | 202.4 |
| C | 14 | 234 | 3589 | 13.38 | 876 | 881 | 202.4 |
| D | 13 | 189 | 379647 | 1886.73 | 851 | 832 | 200.8 |
| D | 8 | 195 | 166261 | 823.94 | 851 | 832 | 200.8 |
| D | 1 | 52 | 115414 | 570.69 | 851 | 832 | 200.8 |
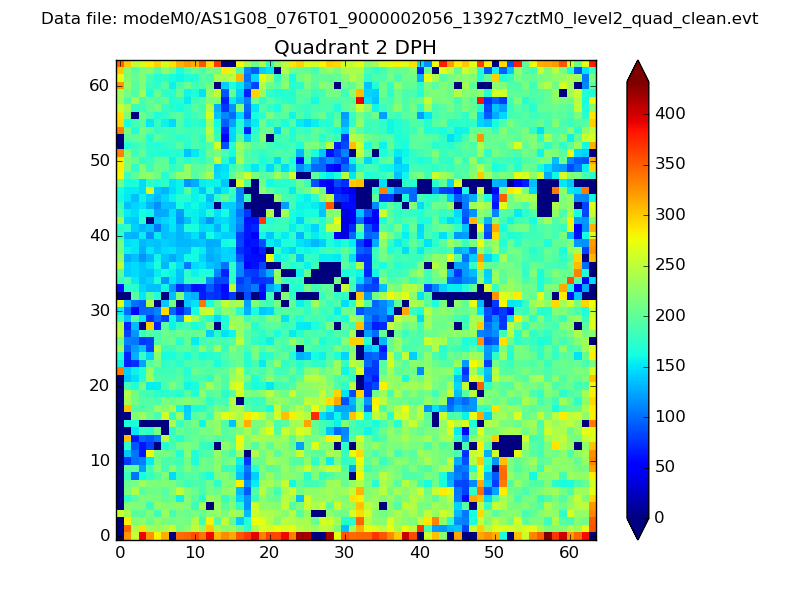
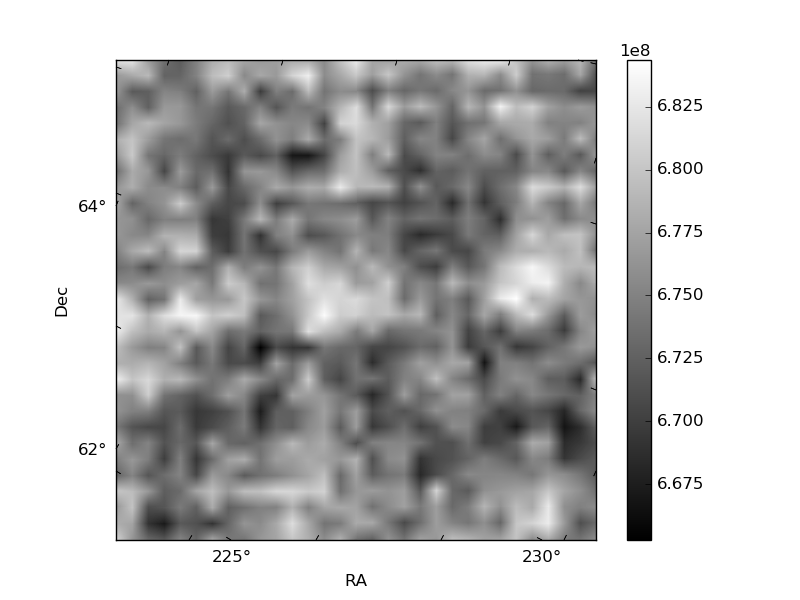
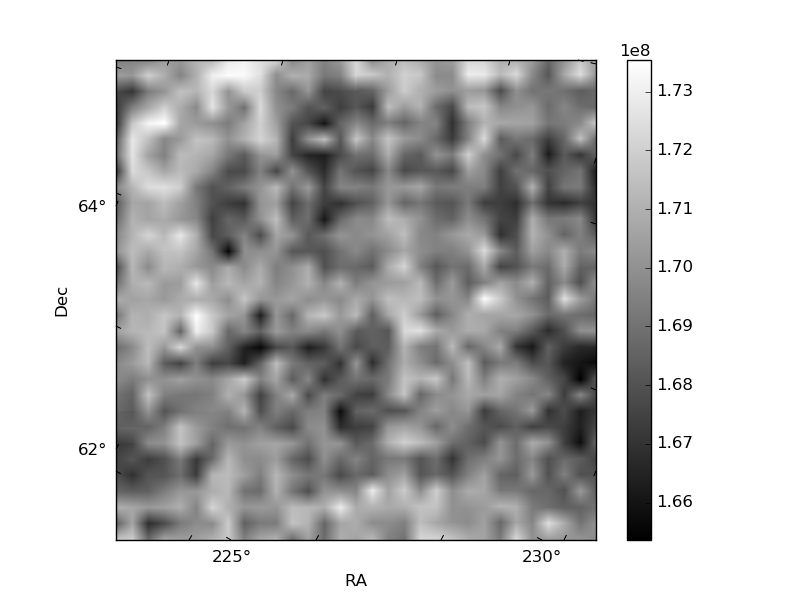
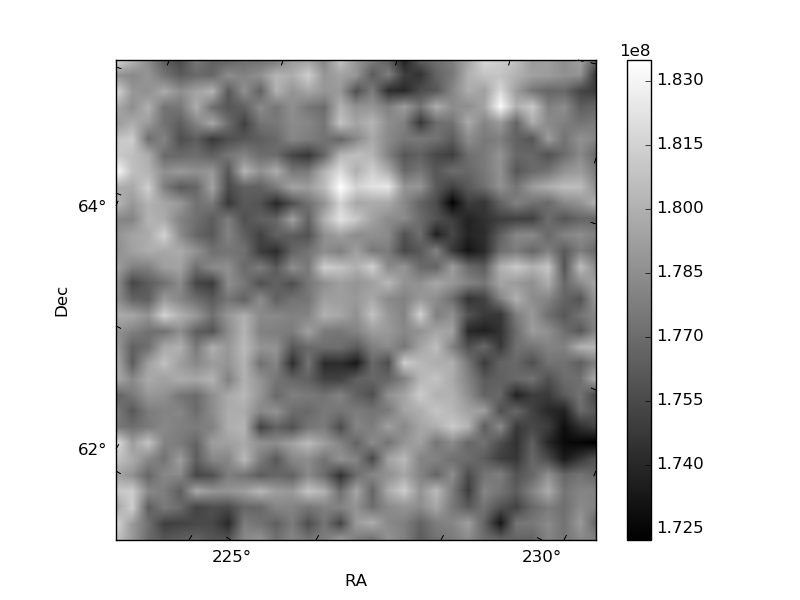
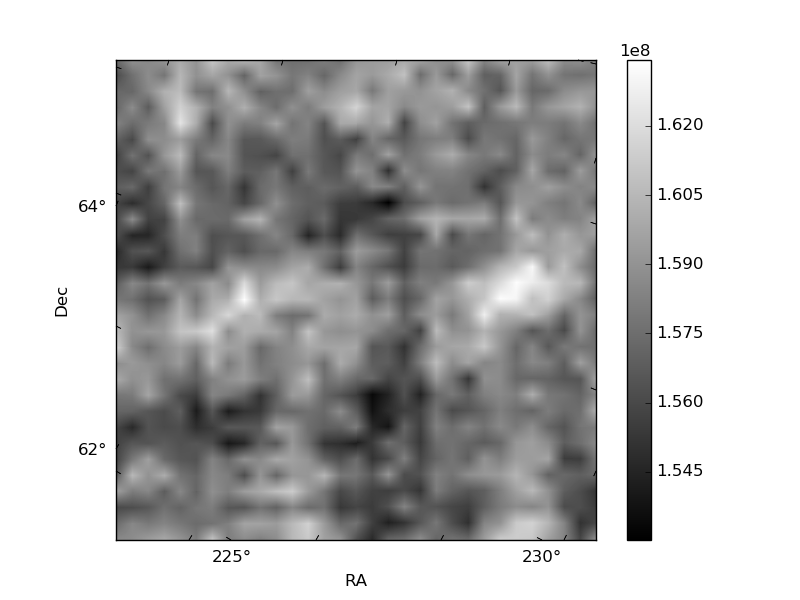
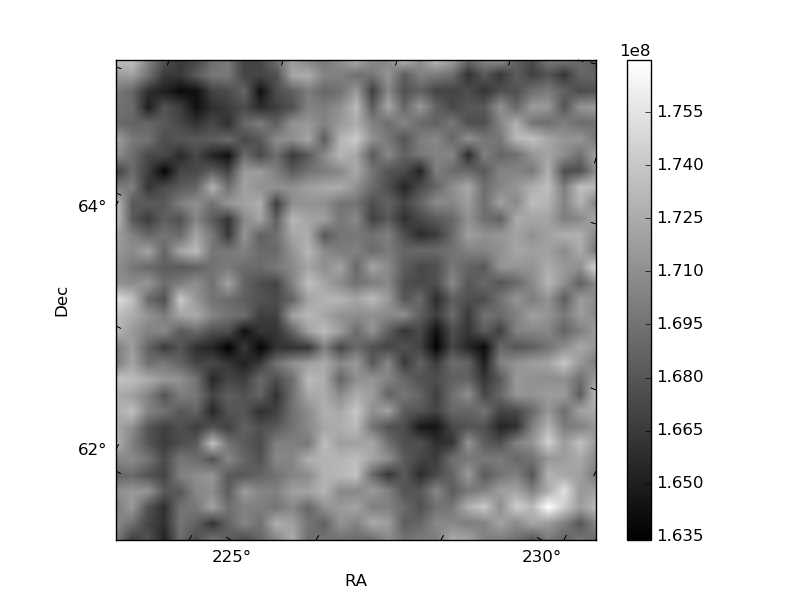
Histogram calculated using DETX and DETY for each event in the final _common_clean file
| Quadrant A | 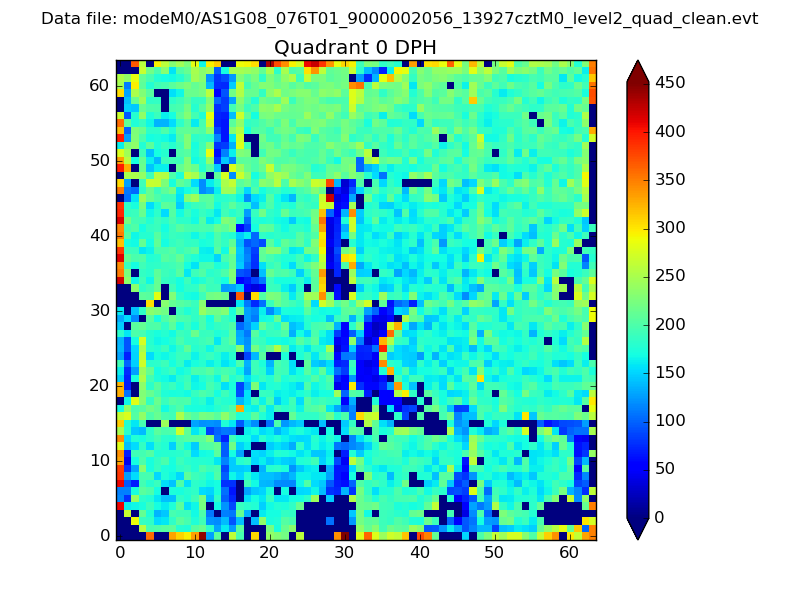 |
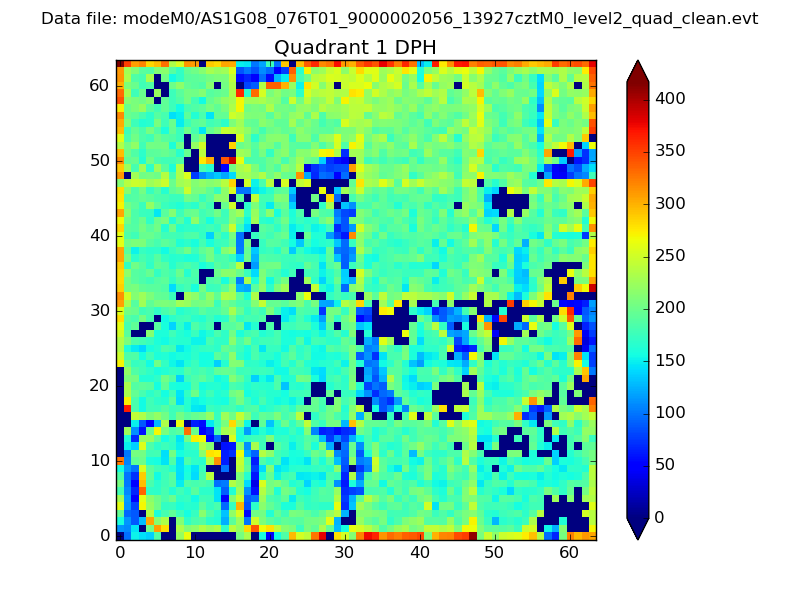 |
Quadrant B |
|---|---|---|---|
| Quadrant D | 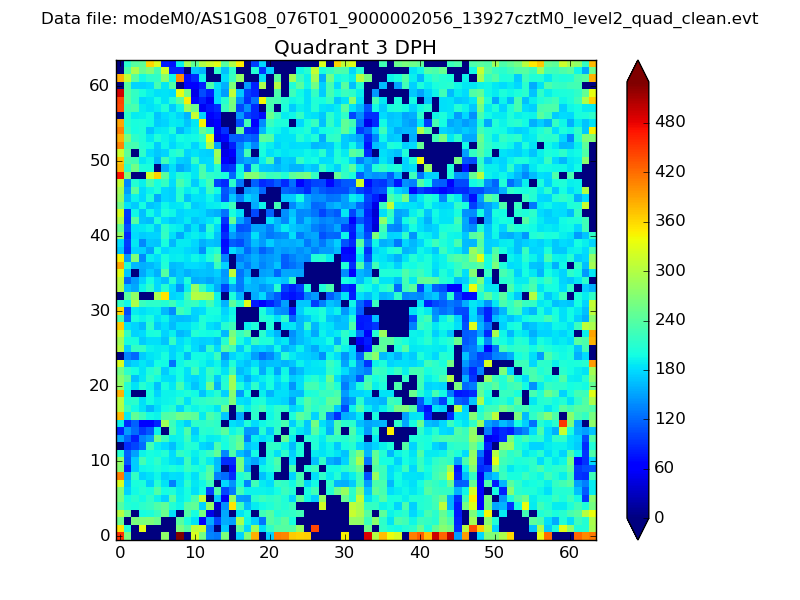 |
 |
Quadrant C |
| Plot type | Count rate plots | Images |
|---|---|---|
| Comparison with Poisson distribution Blue bars denote a histogram of data divided into 1 sec bins. Red curve is a Poisson curve with rate = median count rate of data. |
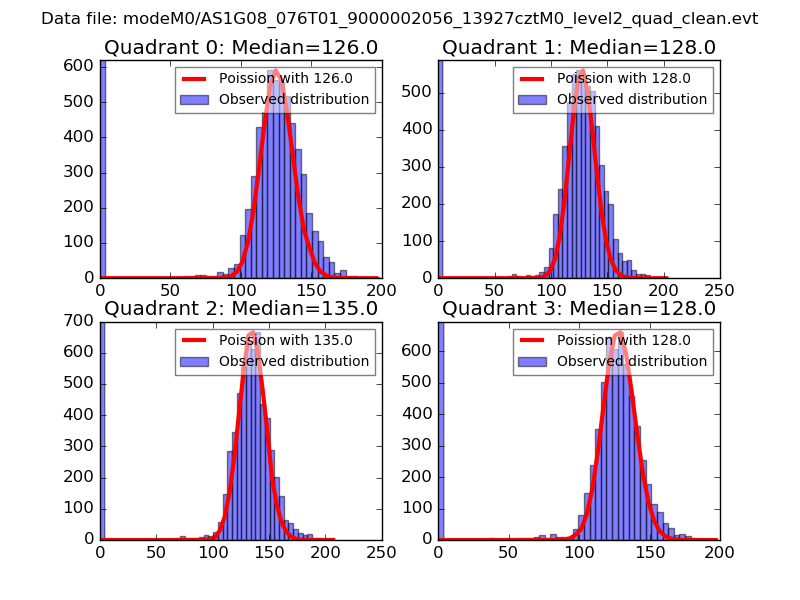 |
 |
| Quadrant-wise count rates Data is divided into 100 sec bins |
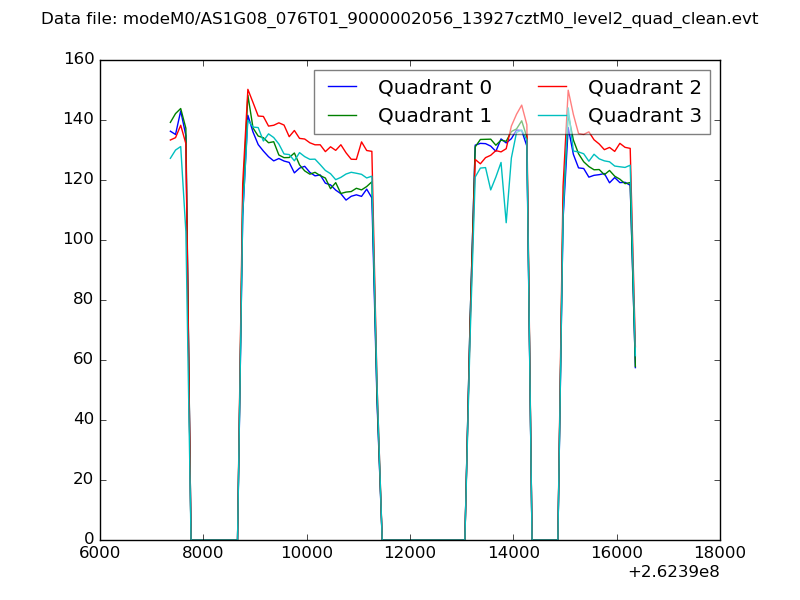 |
|
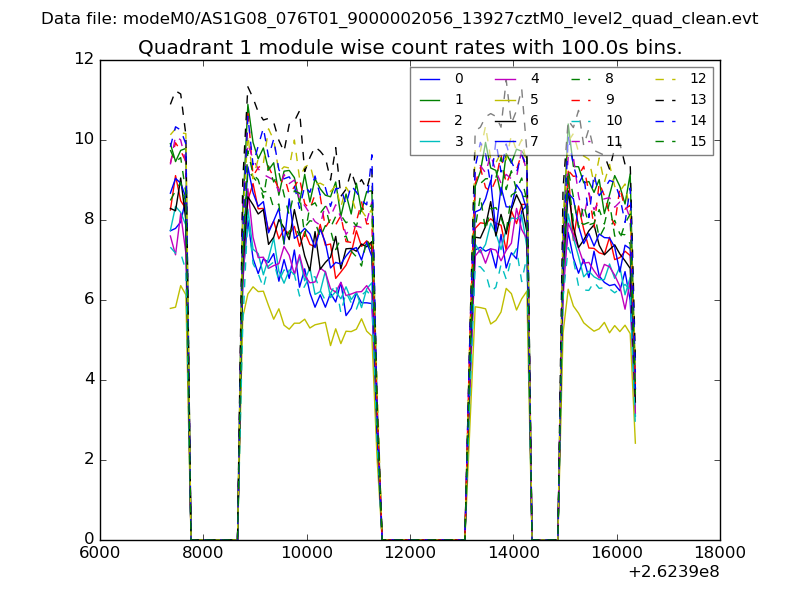
| Module-wise count rates for Quadrant A Data is divided into 100 sec bins |
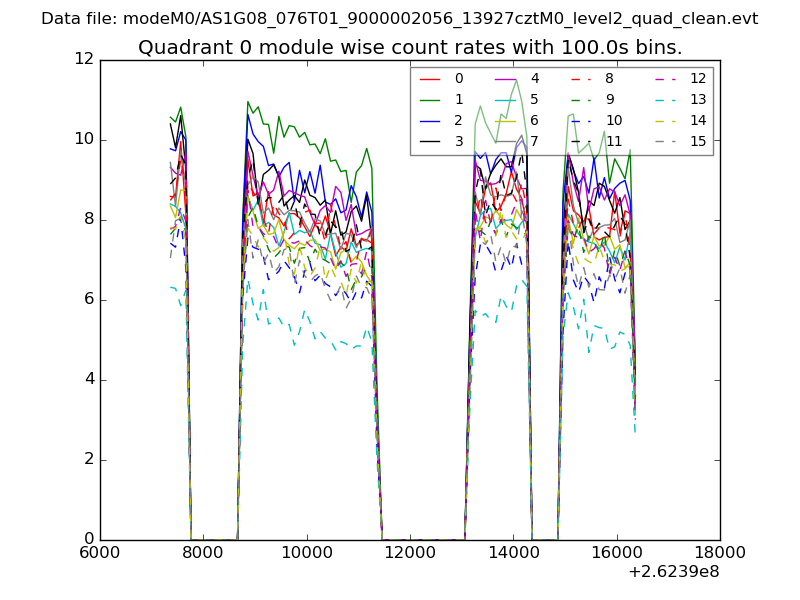 |
 |
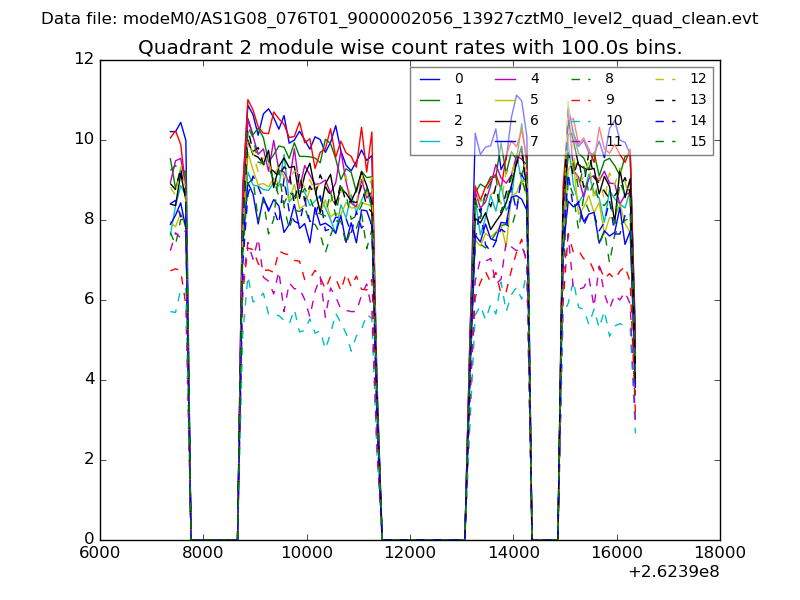
| Module-wise count rates for Quadrant B Data is divided into 100 sec bins |
 |
 |
| Module-wise count rates for Quadrant C Data is divided into 100 sec bins |
 |
 |
| Module-wise count rates for Quadrant D Data is divided into 100 sec bins |
 |
 |
| Parameter | Plot |
|---|---|
| CZT HV Monitor |  |
| D_VDD | 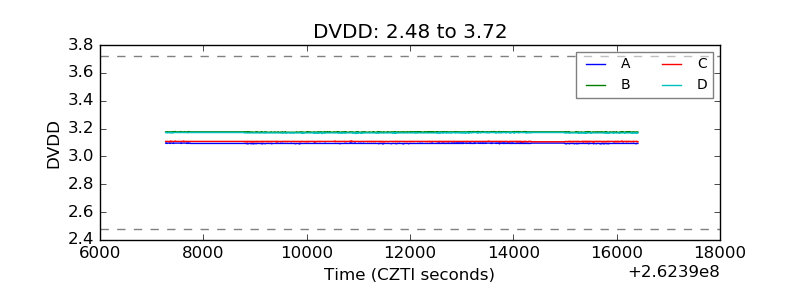 |
| Temperature 1 | 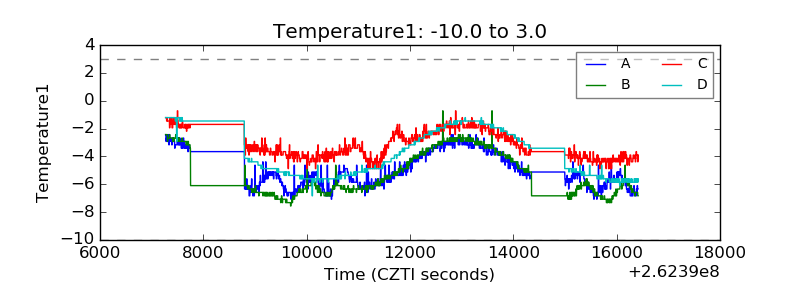 |
| Veto HV Monitor | 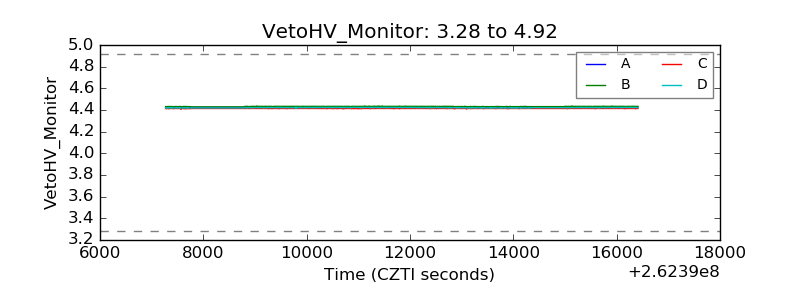 |
| Veto LLD |  |
| Alpha Counter | 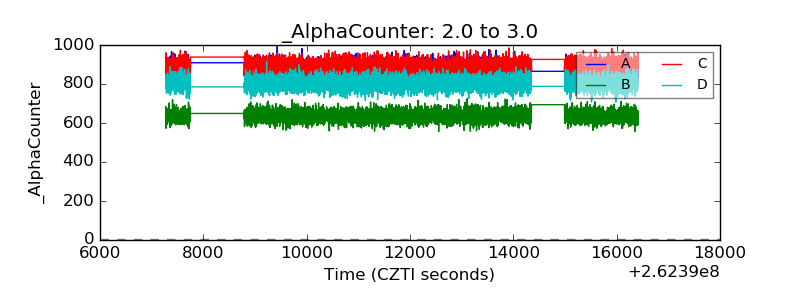 |
| _CPM_Rate | 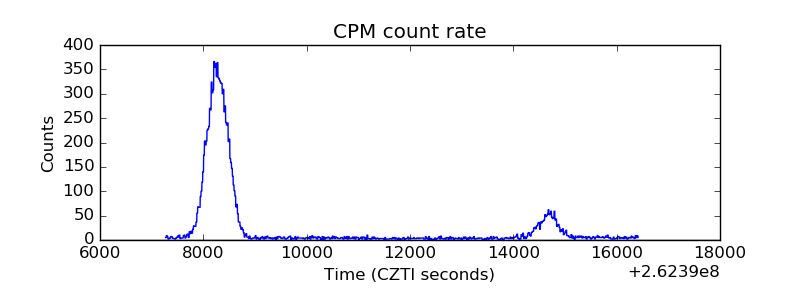 |
| CZT Counter | 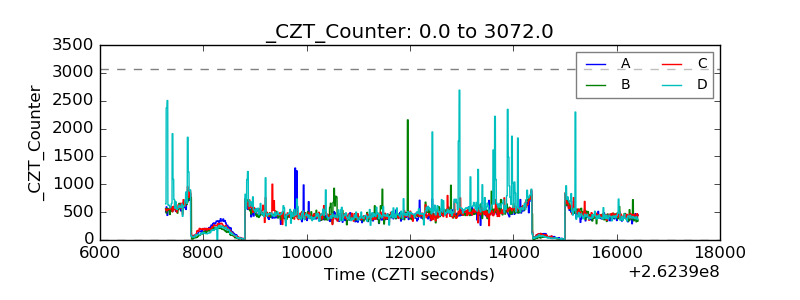 |
| +2.5 Volts monitor | 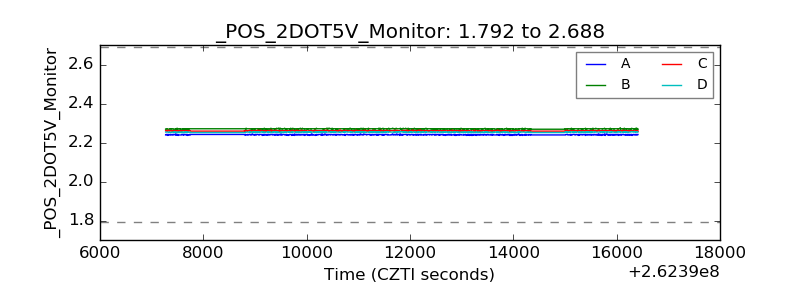 |
| +5 Volts monitor | 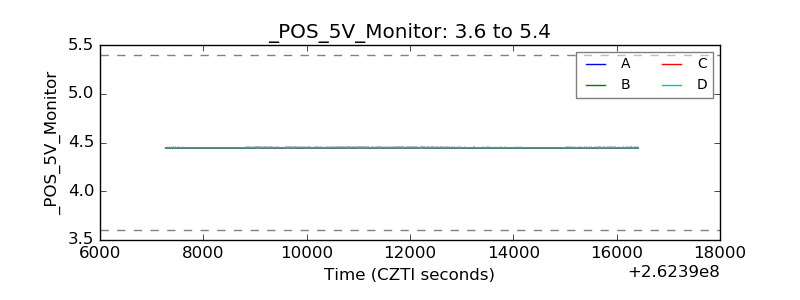 |
| _ROLL_ROT |  |
| _Roll_DEC | 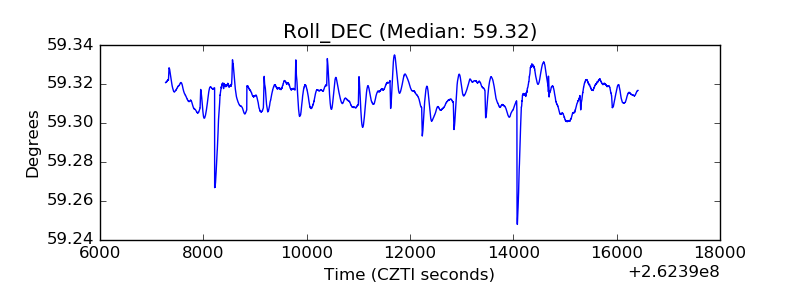 |
| _Roll_RA | 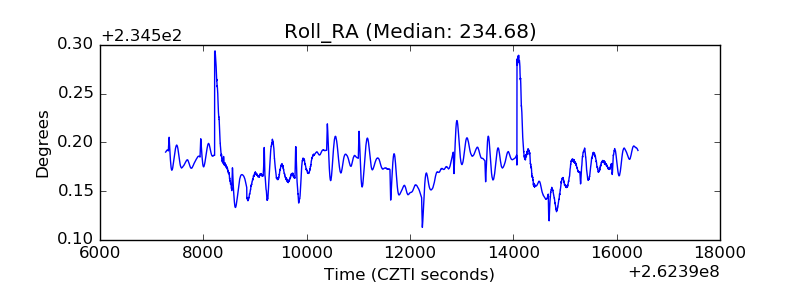 |
| Veto Counter | 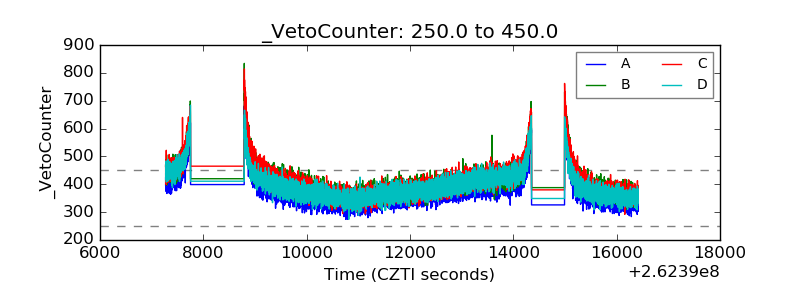 |