| Param | Original file | Final file |
|---|---|---|
| Filename | modeM0/AS1T02_041T01_9000002058cztM0_level2.fits | modeM0/AS1T02_041T01_9000002058cztM0_level2_quad_clean.evt |
| Size (bytes) | 729,089,280 | 870,134,400 |
| Size | 695.3 MB | 829.8 MB |
| Events in quadrant A | 4,414,356 | 5,427,726 |
| Events in quadrant B | 4,247,906 | 5,351,554 |
| Events in quadrant C | 4,442,430 | 5,489,159 |
| Events in quadrant D | 3,619,754 | 4,733,864 |
| Mode M0 | |||
|---|---|---|---|
| Quadrant | BADHDUFLAG | Total packets | Discarded packets |
| A | 0 | 160586 | 0 |
| B | 0 | 182550 | 0 |
| C | 0 | 172605 | 0 |
| D | 0 | 286606 | 0 |
| Mode M9 | |||
|---|---|---|---|
| Quadrant | BADHDUFLAG | Total packets | Discarded packets |
| A | 0 | 121 | 0 |
| B | 0 | 121 | 0 |
| C | 0 | 121 | 0 |
| D | 0 | 121 | 0 |
| Mode SS | |||
|---|---|---|---|
| Quadrant | BADHDUFLAG | Total packets | Discarded packets |
| A | 0 | 1590 | 0 |
| B | 0 | 1590 | 0 |
| C | 0 | 1590 | 0 |
| D | 0 | 1590 | 0 |
| Quadrant | Total seconds | Saturated seconds | Saturation percentage |
|---|---|---|---|
| A | 78060 | 804 | 1.029977% |
| B | 78060 | 2507 | 3.211632% |
| C | 78060 | 1259 | 1.612862% |
| D | 78060 | 8053 | 10.316423% |
Noise dominated data is calculated using 1-second bins in cleaned event files. If a bin has >2000 counts, and if more than 50% of those come from <1% of pixels, then it is considered to be noise-dominated and hence unusable.
| Quadrant | # 1 sec bins | Bins with >0 counts | Bins with >2000 counts | High rate bins dominated by noise | Noise dominated (total time) | Noise dominated (detector-on time) | Marked lightcurve |
|---|---|---|---|---|---|---|---|
| A | 90064 | 78045 | 0 | 0 | 0.00% | 0.00% |  |
| B | 90064 | 78035 | 0 | 0 | 0.00% | 0.00% |  |
| C | 90064 | 78034 | 0 | 0 | 0.00% | 0.00% |  |
| D | 90064 | 78005 | 0 | 0 | 0.00% | 0.00% |  |
Top three noisy pixels from each quadrant. If the there are fewer than three noisy pixels in the level2.evt file, extra rows are filled as -1
| Pixel properties | Quadrant properties | ||||||
|---|---|---|---|---|---|---|---|
| Quadrant | DetID | PixID | Counts | Sigma | Mean | Median | Sigma |
| A | 0 | 29 | 4201 | 10.8 | 1149 | 1078 | 289.3 |
| A | 7 | 110 | 3761 | 9.27 | 1149 | 1078 | 289.3 |
| A | 9 | 19 | 3279 | 7.61 | 1149 | 1078 | 289.3 |
| B | 2 | 9 | 3885 | 12.68 | 1121 | 1069 | 222.0 |
| B | 2 | 8 | 2914 | 8.31 | 1121 | 1069 | 222.0 |
| B | 5 | 128 | 2855 | 8.04 | 1121 | 1069 | 222.0 |
| C | 1 | 80 | 3418 | 7.58 | 1174 | 1098 | 305.9 |
| C | 1 | 81 | 3387 | 7.48 | 1174 | 1098 | 305.9 |
| C | 12 | 241 | 3195 | 6.86 | 1174 | 1098 | 305.9 |
| D | 6 | 231 | 2709 | 6.33 | 1034 | 939 | 279.8 |
| D | 6 | 38 | 2659 | 6.15 | 1034 | 939 | 279.8 |
| D | 3 | 14 | 2595 | 5.92 | 1034 | 939 | 279.8 |
Histogram calculated using DETX and DETY for each event in the final _common_clean file
| Quadrant A | 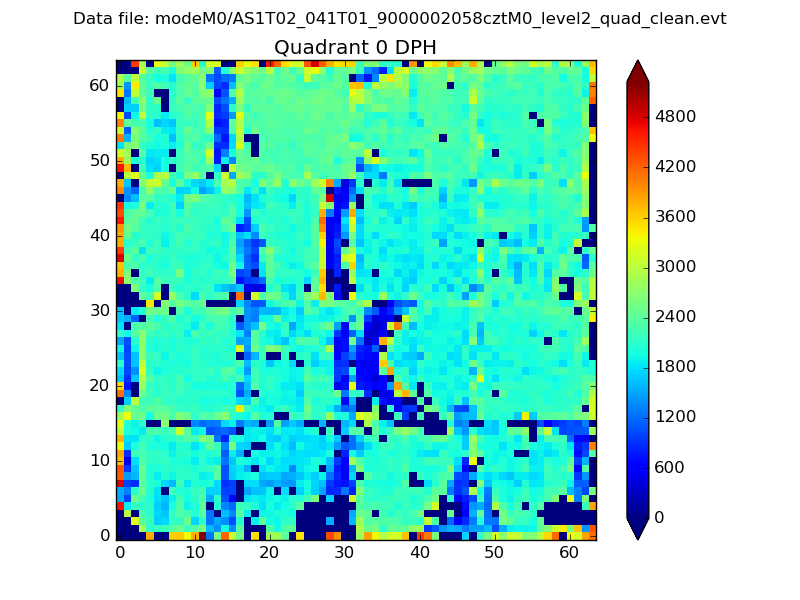 |
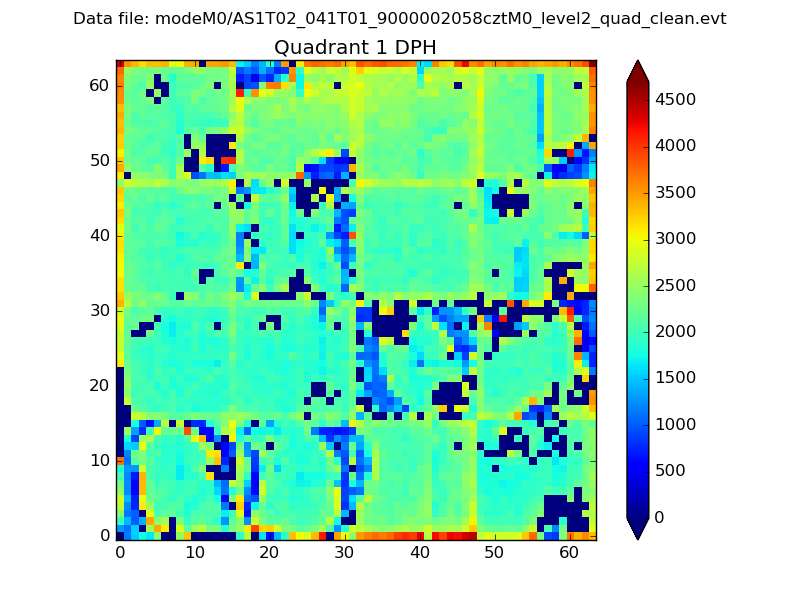 |
Quadrant B |
|---|---|---|---|
| Quadrant D |  |
 |
Quadrant C |
| Plot type | Count rate plots | Images |
|---|---|---|
| Comparison with Poisson distribution Blue bars denote a histogram of data divided into 1 sec bins. Red curve is a Poisson curve with rate = median count rate of data. |
 |
 |
| Quadrant-wise count rates Data is divided into 100 sec bins |
 |
|
| Module-wise count rates for Quadrant A Data is divided into 100 sec bins |
 |
 |
| Module-wise count rates for Quadrant B Data is divided into 100 sec bins |
 |
 |
| Module-wise count rates for Quadrant C Data is divided into 100 sec bins |
 |
 |
| Module-wise count rates for Quadrant D Data is divided into 100 sec bins |
 |
 |
| Parameter | Plot |
|---|---|
| CZT HV Monitor |  |
| D_VDD |  |
| Temperature 1 | 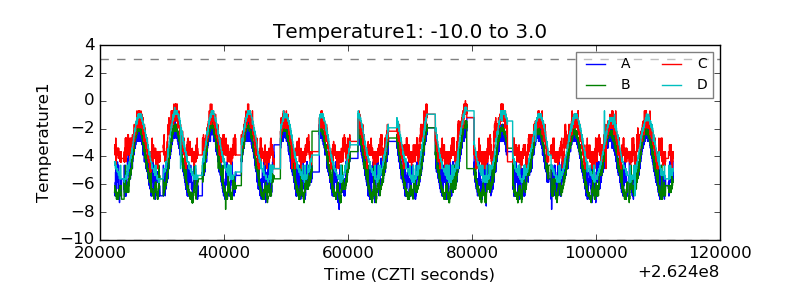 |
| Veto HV Monitor |  |
| Veto LLD |  |
| Alpha Counter |  |
| _CPM_Rate |  |
| CZT Counter |  |
| +2.5 Volts monitor |  |
| +5 Volts monitor |  |
| _ROLL_ROT |  |
| _Roll_DEC |  |
| _Roll_RA |  |
| Veto Counter |  |