| Param | Original file | Final file |
|---|---|---|
| Filename | modeM0/AS1T02_041T01_9000002058_13930cztM0_level2.evt | modeM0/AS1T02_041T01_9000002058_13930cztM0_level2_quad_clean.evt |
| Size (bytes) | 189,904,320 | 45,020,160 |
| Size | 181.1 MB | 42.9 MB |
| Events in quadrant A | 1,193,424 | 286,583 |
| Events in quadrant B | 1,250,806 | 292,748 |
| Events in quadrant C | 1,255,275 | 307,432 |
| Events in quadrant D | 1,872,623 | 289,630 |
| Mode M0 | |||
|---|---|---|---|
| Quadrant | BADHDUFLAG | Total packets | Discarded packets |
| A | 0 | 5338 | 2 |
| B | 0 | 5407 | 1 |
| C | 0 | 5358 | 1 |
| D | 0 | 7381 | 1 |
| Mode M9 | |||
|---|---|---|---|
| Quadrant | BADHDUFLAG | Total packets | Discarded packets |
| A | 0 | 4 | 0 |
| B | 0 | 4 | 0 |
| C | 0 | 4 | 0 |
| D | 0 | 4 | 0 |
| Mode SS | |||
|---|---|---|---|
| Quadrant | BADHDUFLAG | Total packets | Discarded packets |
| A | 0 | 54 | 0 |
| B | 0 | 54 | 0 |
| C | 0 | 54 | 0 |
| D | 0 | 54 | 0 |
| Quadrant | Total seconds | Saturated seconds | Saturation percentage |
|---|---|---|---|
| A | 2604 | 53 | 2.035330% |
| B | 2604 | 56 | 2.150538% |
| C | 2604 | 25 | 0.960061% |
| D | 2604 | 61 | 2.342550% |
Noise dominated data is calculated using 1-second bins in cleaned event files. If a bin has >2000 counts, and if more than 50% of those come from <1% of pixels, then it is considered to be noise-dominated and hence unusable.
| Quadrant | # 1 sec bins | Bins with >0 counts | Bins with >2000 counts | High rate bins dominated by noise | Noise dominated (total time) | Noise dominated (detector-on time) | Marked lightcurve |
|---|---|---|---|---|---|---|---|
| A | 3020 | 2605 | 0 | 0 | 0.00% | 0.00% | 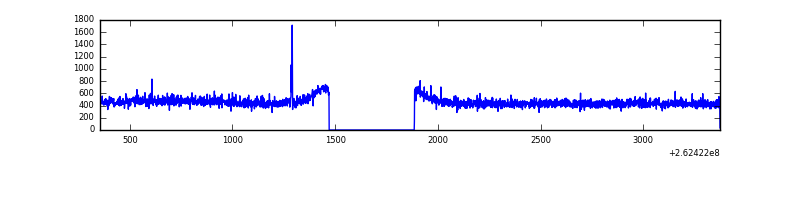 |
| B | 3020 | 2605 | 1 | 1 | 0.03% | 0.04% | 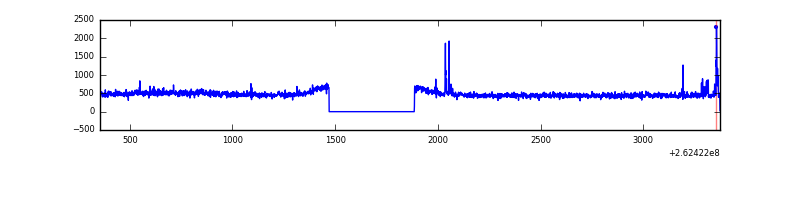 |
| C | 3020 | 2605 | 0 | 0 | 0.00% | 0.00% | 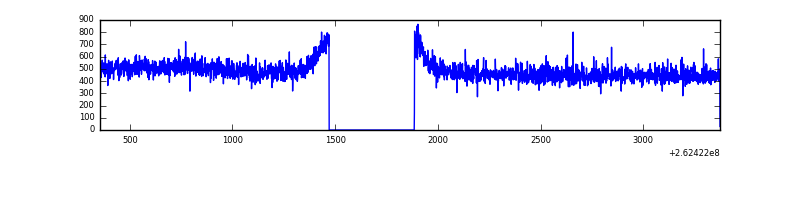 |
| D | 3020 | 2605 | 18 | 18 | 0.60% | 0.69% | 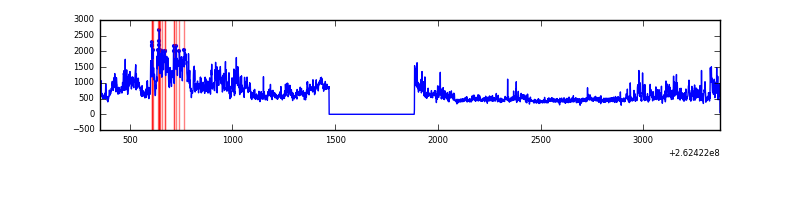 |
Top three noisy pixels from each quadrant. If the there are fewer than three noisy pixels in the level2.evt file, extra rows are filled as -1
| Pixel properties | Quadrant properties | ||||||
|---|---|---|---|---|---|---|---|
| Quadrant | DetID | PixID | Counts | Sigma | Mean | Median | Sigma |
| A | 1 | 162 | 6136 | 89.84 | 307 | 301 | 64.9 |
| A | 4 | 2 | 4678 | 67.39 | 307 | 301 | 64.9 |
| A | 0 | 226 | 2739 | 37.54 | 307 | 301 | 64.9 |
| B | 4 | 80 | 14358 | 223.17 | 311 | 302 | 63.0 |
| B | 0 | 214 | 9873 | 151.96 | 311 | 302 | 63.0 |
| B | 12 | 111 | 7448 | 113.46 | 311 | 302 | 63.0 |
| C | 3 | 233 | 56949 | 785.04 | 305 | 306 | 72.2 |
| C | 8 | 128 | 4055 | 51.96 | 305 | 306 | 72.2 |
| C | 13 | 61 | 2216 | 26.47 | 305 | 306 | 72.2 |
| D | 1 | 52 | 538945 | 7501.85 | 297 | 290 | 71.8 |
| D | 12 | 110 | 98721 | 1370.85 | 297 | 290 | 71.8 |
| D | 5 | 53 | 32550 | 449.29 | 297 | 290 | 71.8 |
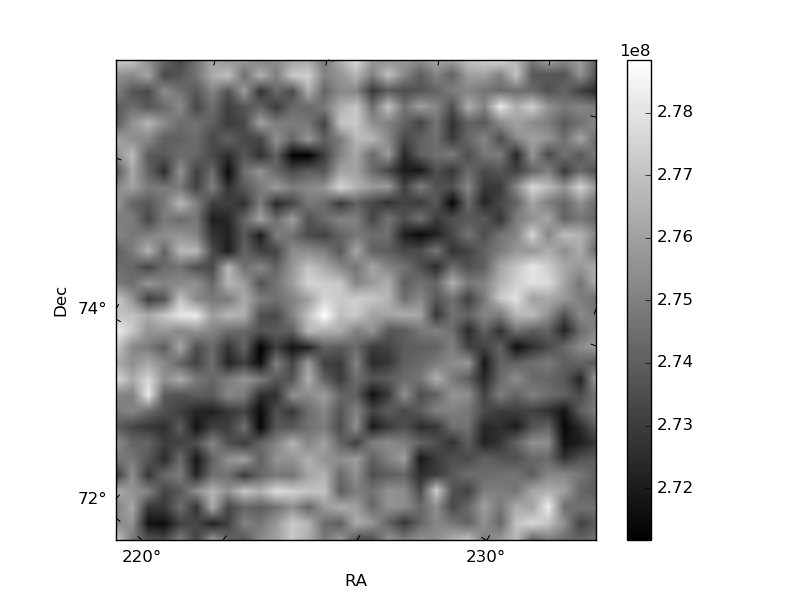
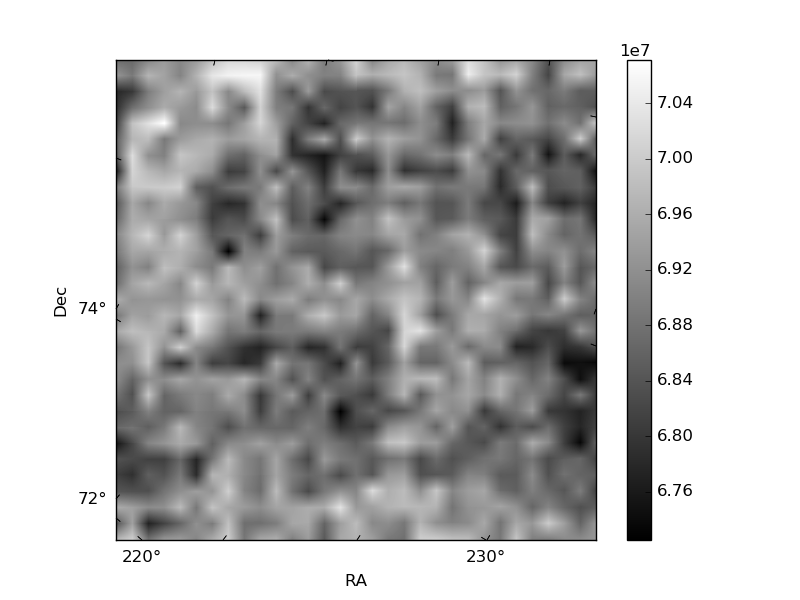
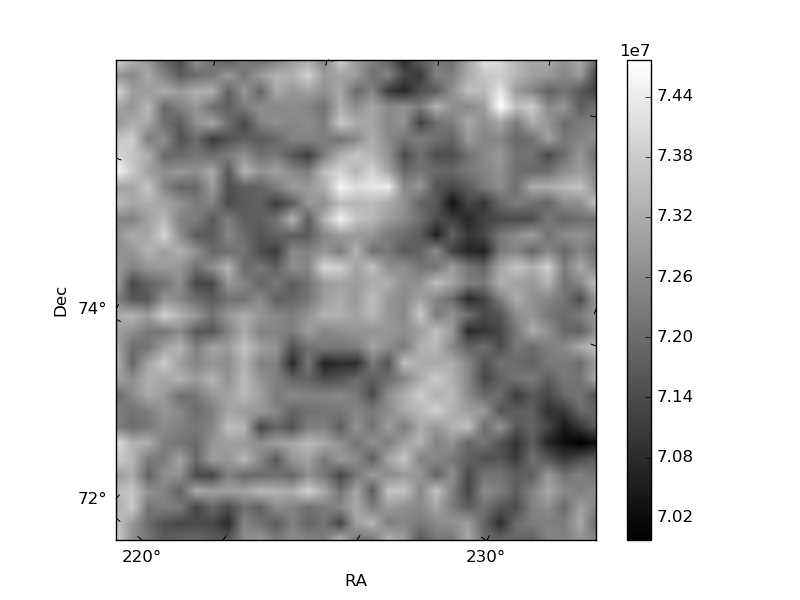
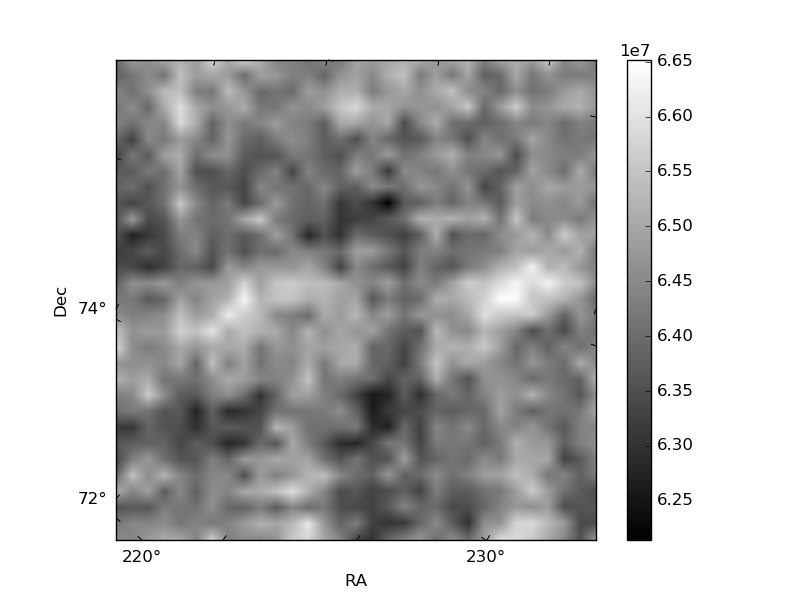
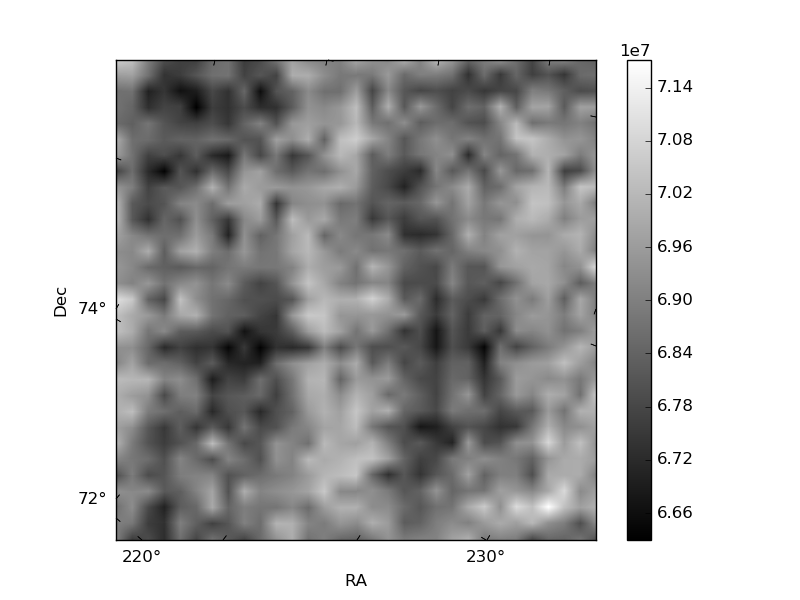
Histogram calculated using DETX and DETY for each event in the final _common_clean file
| Quadrant A | 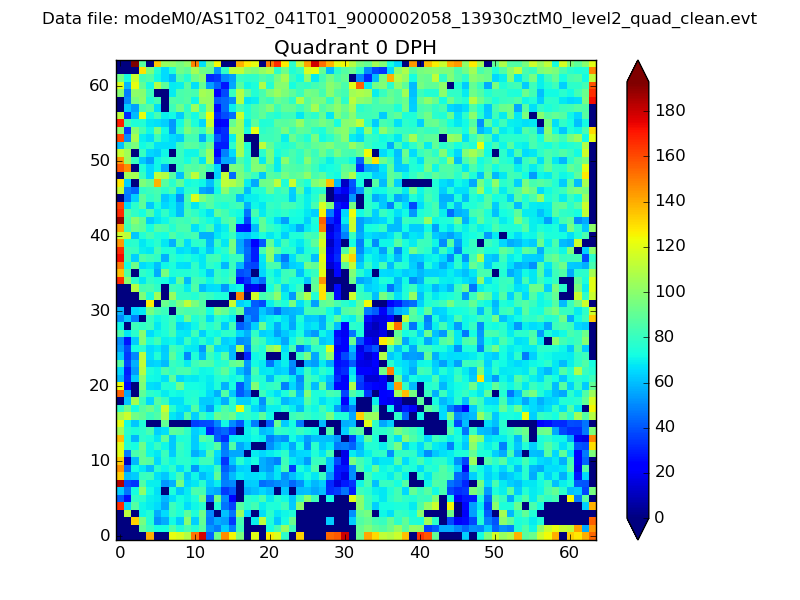 |
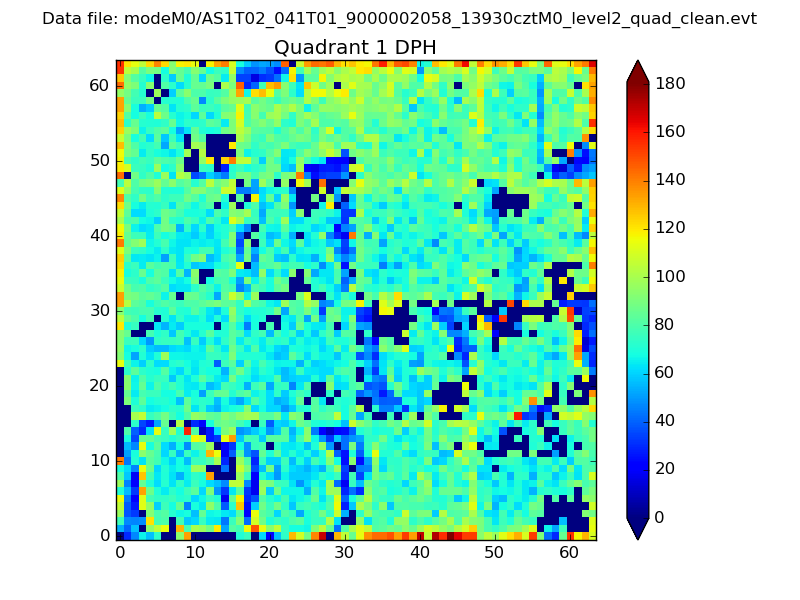 |
Quadrant B |
|---|---|---|---|
| Quadrant D |  |
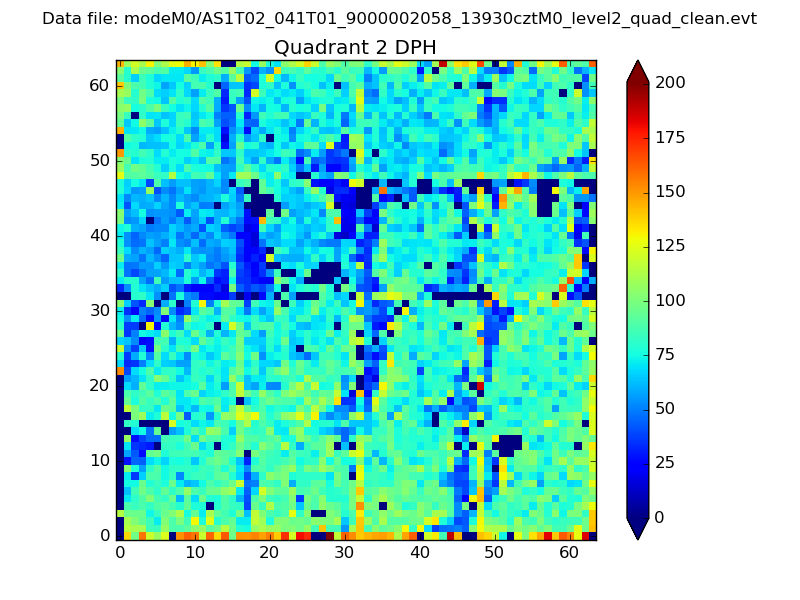 |
Quadrant C |
| Plot type | Count rate plots | Images |
|---|---|---|
| Comparison with Poisson distribution Blue bars denote a histogram of data divided into 1 sec bins. Red curve is a Poisson curve with rate = median count rate of data. |
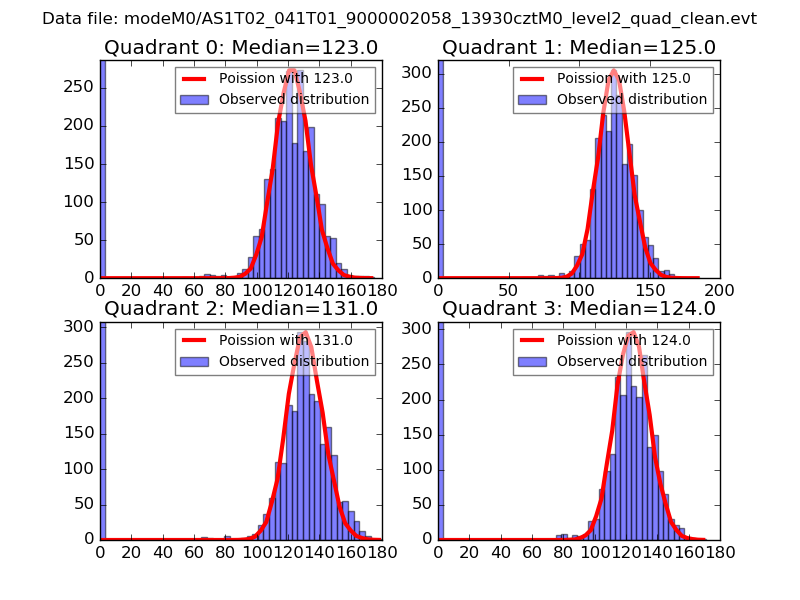 |
 |
| Quadrant-wise count rates Data is divided into 100 sec bins |
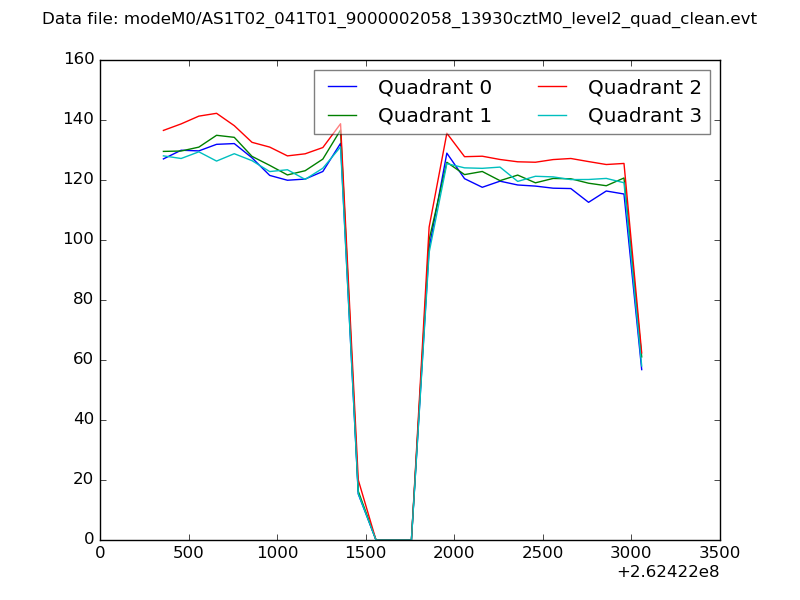 |
|
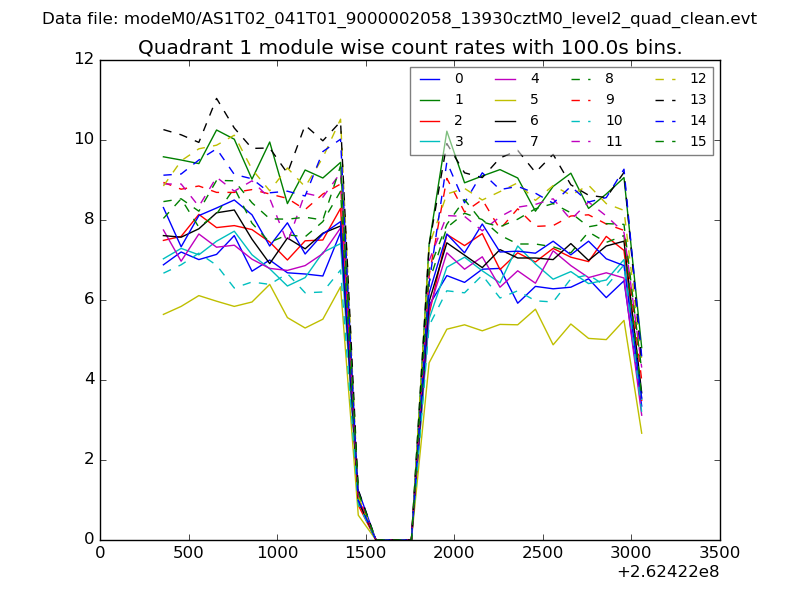
| Module-wise count rates for Quadrant A Data is divided into 100 sec bins |
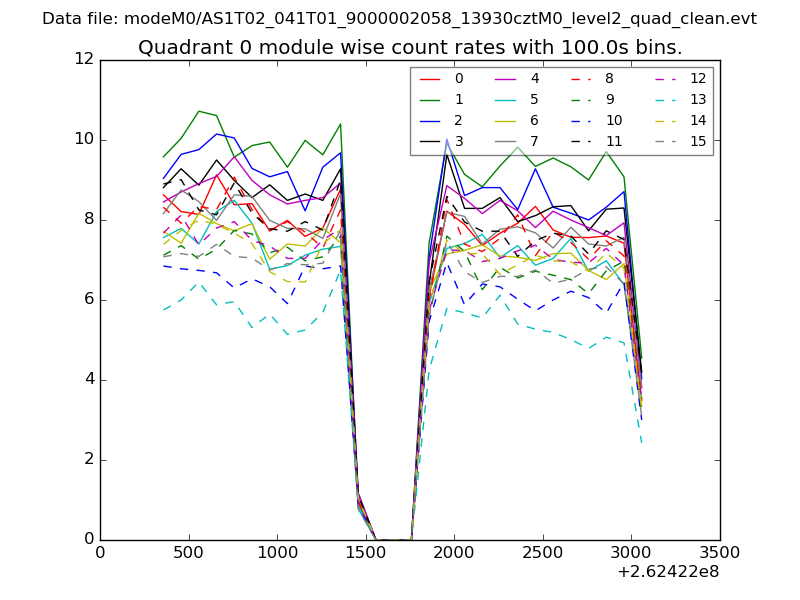 |
 |
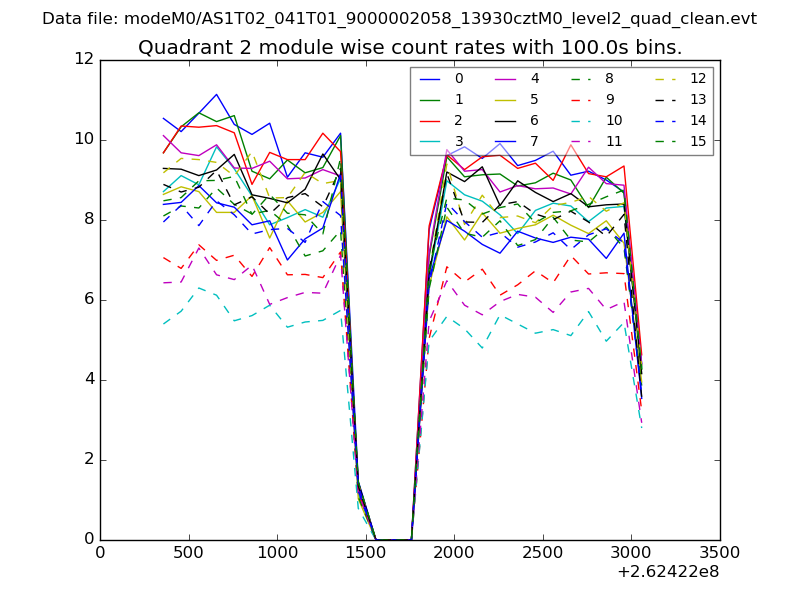
| Module-wise count rates for Quadrant B Data is divided into 100 sec bins |
 |
 |
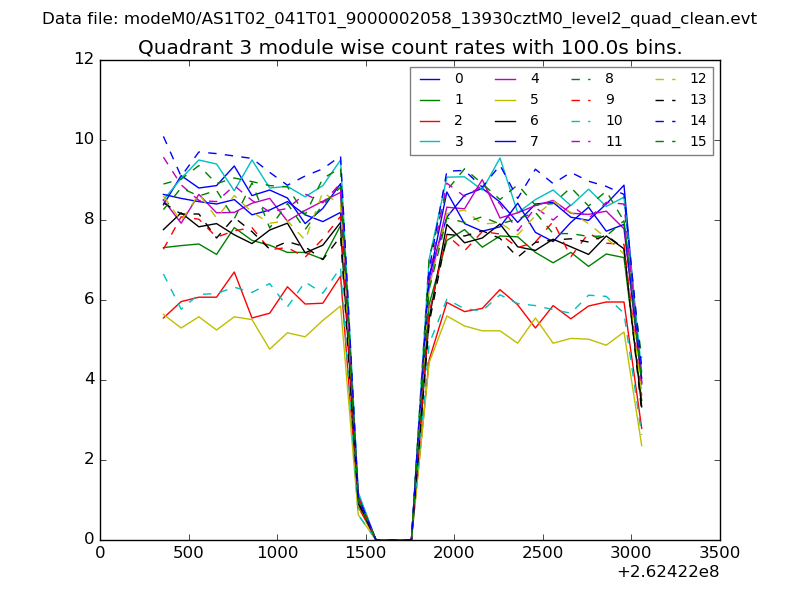
| Module-wise count rates for Quadrant C Data is divided into 100 sec bins |
 |
 |
| Module-wise count rates for Quadrant D Data is divided into 100 sec bins |
 |
 |
| Parameter | Plot |
|---|---|
| CZT HV Monitor | 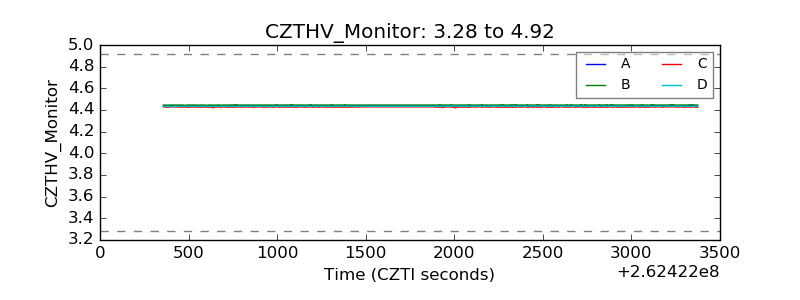 |
| D_VDD | 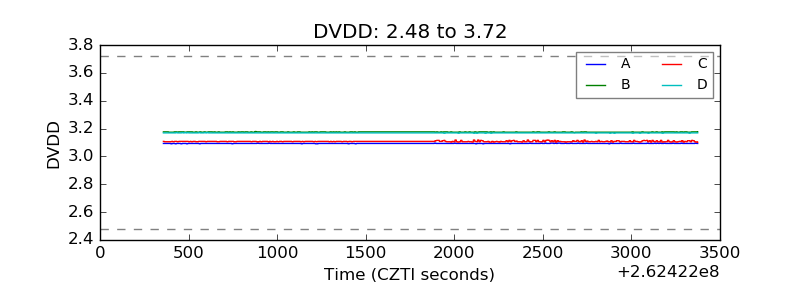 |
| Temperature 1 | 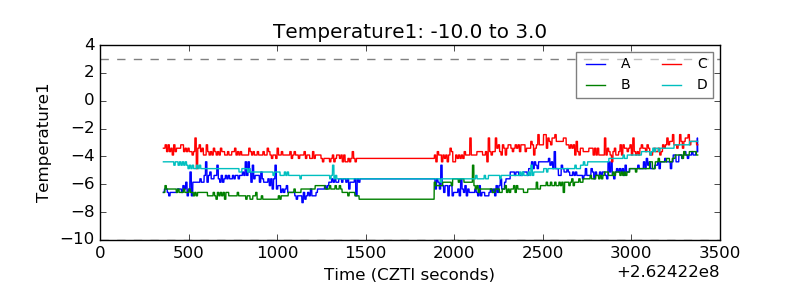 |
| Veto HV Monitor | 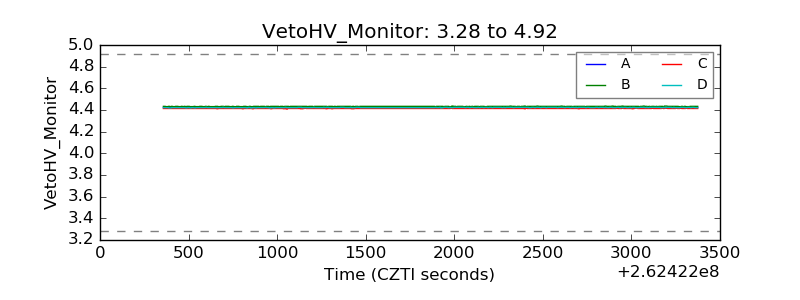 |
| Veto LLD | 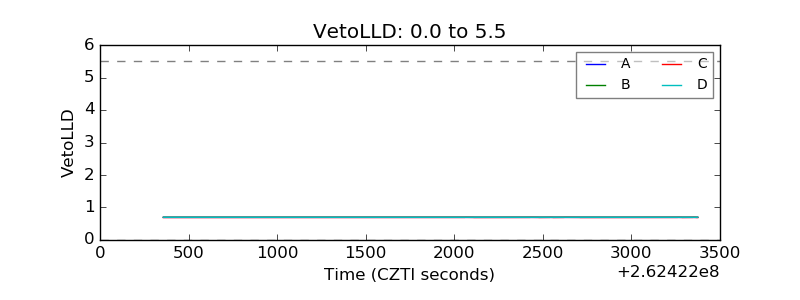 |
| Alpha Counter | 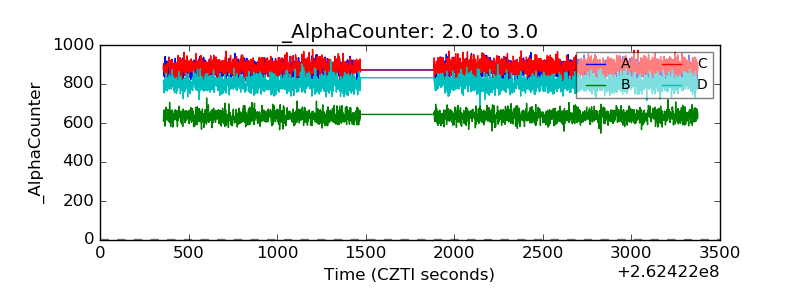 |
| _CPM_Rate |  |
| CZT Counter | 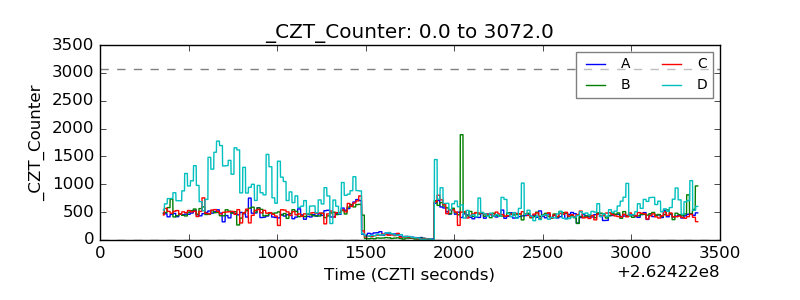 |
| +2.5 Volts monitor | 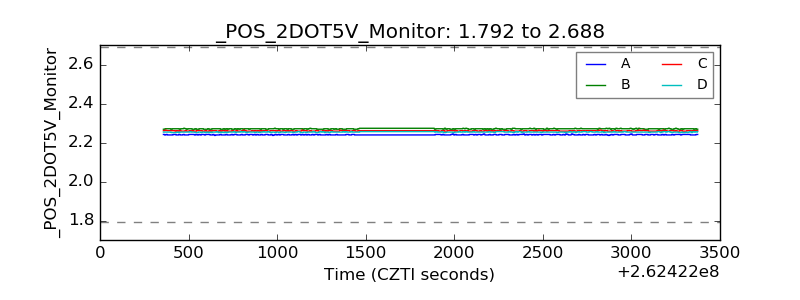 |
| +5 Volts monitor | 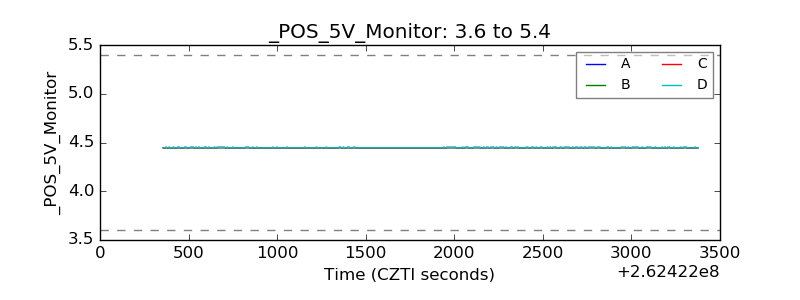 |
| _ROLL_ROT | 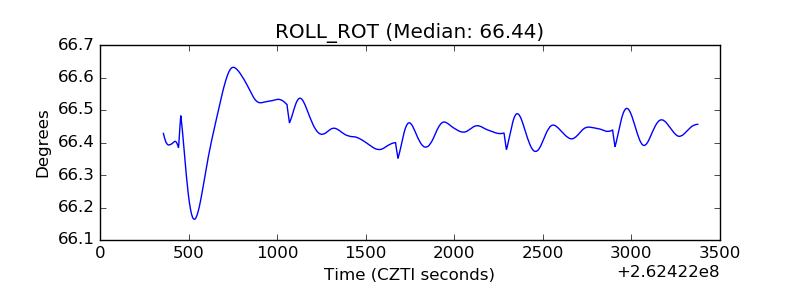 |
| _Roll_DEC | 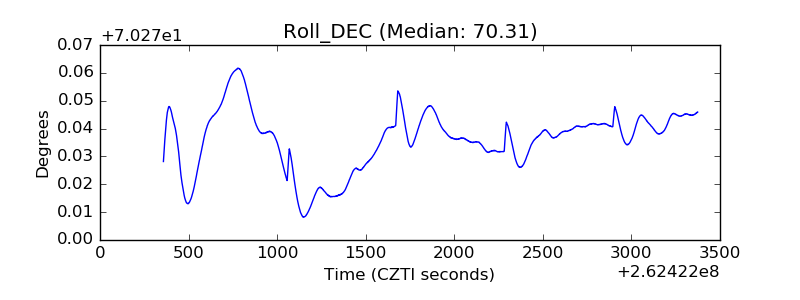 |
| _Roll_RA | 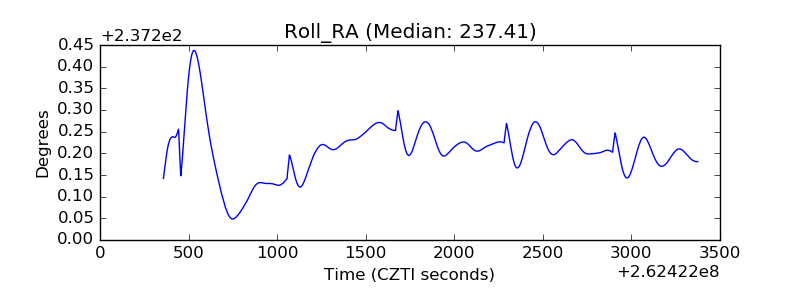 |
| Veto Counter | 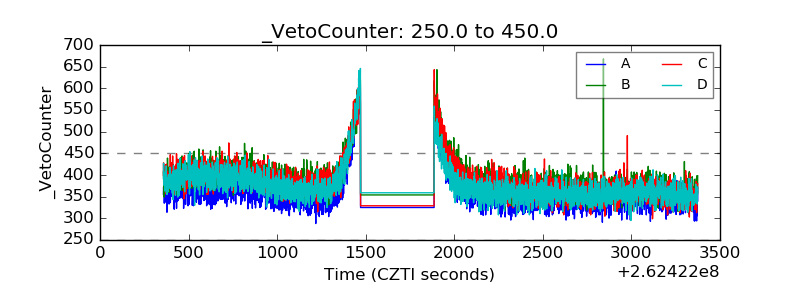 |