| Param | Original file | Final file |
|---|---|---|
| Filename | modeM0/AS1T02_041T01_9000002058_13932cztM0_level2.evt | modeM0/AS1T02_041T01_9000002058_13932cztM0_level2_quad_clean.evt |
| Size (bytes) | 1,078,303,680 | 162,665,280 |
| Size | 1.0 GB | 155.1 MB |
| Events in quadrant A | 5,472,567 | 1,027,452 |
| Events in quadrant B | 6,115,419 | 1,039,709 |
| Events in quadrant C | 6,605,416 | 1,047,920 |
| Events in quadrant D | 13,642,380 | 969,698 |
| Mode M0 | |||
|---|---|---|---|
| Quadrant | BADHDUFLAG | Total packets | Discarded packets |
| A | 0 | 24632 | 3 |
| B | 0 | 26034 | 2 |
| C | 0 | 27568 | 2 |
| D | 0 | 48988 | 2 |
| Mode M9 | |||
|---|---|---|---|
| Quadrant | BADHDUFLAG | Total packets | Discarded packets |
| A | 0 | 14 | 0 |
| B | 0 | 14 | 0 |
| C | 0 | 14 | 0 |
| D | 0 | 14 | 0 |
| Mode SS | |||
|---|---|---|---|
| Quadrant | BADHDUFLAG | Total packets | Discarded packets |
| A | 0 | 246 | 0 |
| B | 0 | 246 | 0 |
| C | 0 | 246 | 0 |
| D | 0 | 246 | 0 |
| Quadrant | Total seconds | Saturated seconds | Saturation percentage |
|---|---|---|---|
| A | 12168 | 130 | 1.068376% |
| B | 12168 | 158 | 1.298488% |
| C | 12168 | 354 | 2.909270% |
| D | 12168 | 1496 | 12.294543% |
Noise dominated data is calculated using 1-second bins in cleaned event files. If a bin has >2000 counts, and if more than 50% of those come from <1% of pixels, then it is considered to be noise-dominated and hence unusable.
| Quadrant | # 1 sec bins | Bins with >0 counts | Bins with >2000 counts | High rate bins dominated by noise | Noise dominated (total time) | Noise dominated (detector-on time) | Marked lightcurve |
|---|---|---|---|---|---|---|---|
| A | 13479 | 12169 | 0 | 0 | 0.00% | 0.00% | 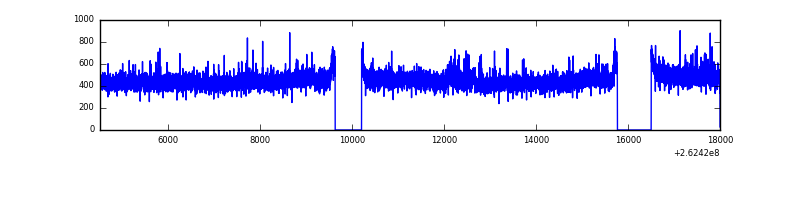 |
| B | 13479 | 12169 | 14 | 14 | 0.10% | 0.12% | 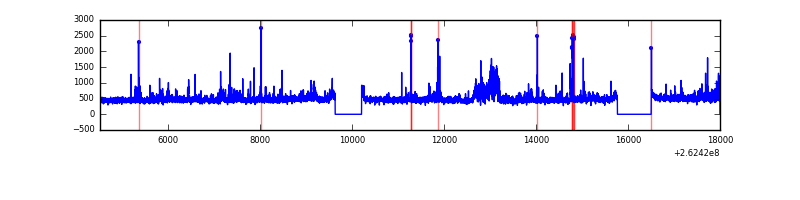 |
| C | 13479 | 12169 | 212 | 212 | 1.57% | 1.74% | 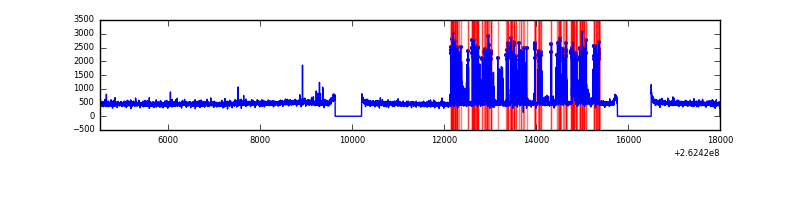 |
| D | 13479 | 12169 | 1469 | 1469 | 10.90% | 12.07% | 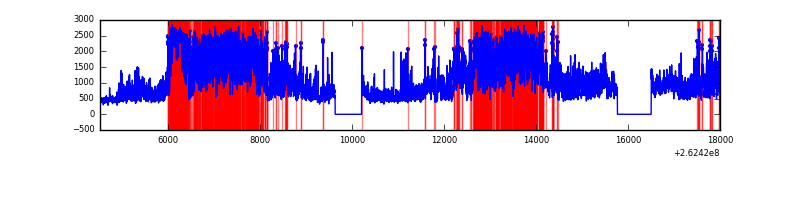 |
Top three noisy pixels from each quadrant. If the there are fewer than three noisy pixels in the level2.evt file, extra rows are filled as -1
| Pixel properties | Quadrant properties | ||||||
|---|---|---|---|---|---|---|---|
| Quadrant | DetID | PixID | Counts | Sigma | Mean | Median | Sigma |
| A | 8 | 15 | 28297 | 94.25 | 1403 | 1370 | 285.7 |
| A | 1 | 162 | 21461 | 70.32 | 1403 | 1370 | 285.7 |
| A | 11 | 29 | 15051 | 47.89 | 1403 | 1370 | 285.7 |
| B | 0 | 230 | 277911 | 1038.51 | 1404 | 1368 | 266.3 |
| B | 10 | 245 | 116786 | 433.43 | 1404 | 1368 | 266.3 |
| B | 4 | 80 | 61578 | 226.11 | 1404 | 1368 | 266.3 |
| C | 4 | 254 | 1022997 | 3258.41 | 1364 | 1374 | 313.5 |
| C | 3 | 233 | 225081 | 713.5 | 1364 | 1374 | 313.5 |
| C | 8 | 128 | 14854 | 42.99 | 1364 | 1374 | 313.5 |
| D | 1 | 52 | 6981900 | 22348.28 | 1317 | 1287 | 312.4 |
| D | 5 | 233 | 771188 | 2464.82 | 1317 | 1287 | 312.4 |
| D | 12 | 110 | 276268 | 880.35 | 1317 | 1287 | 312.4 |
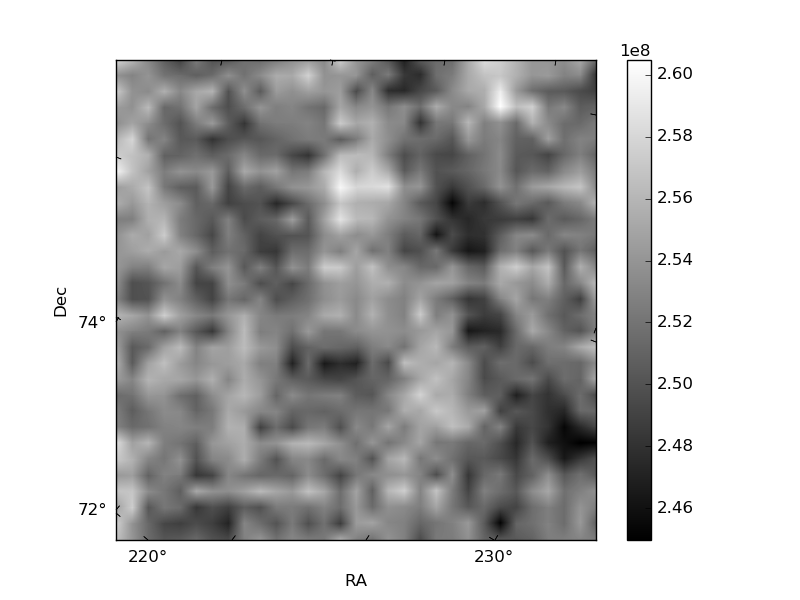
Histogram calculated using DETX and DETY for each event in the final _common_clean file
| Quadrant A |  |
 |
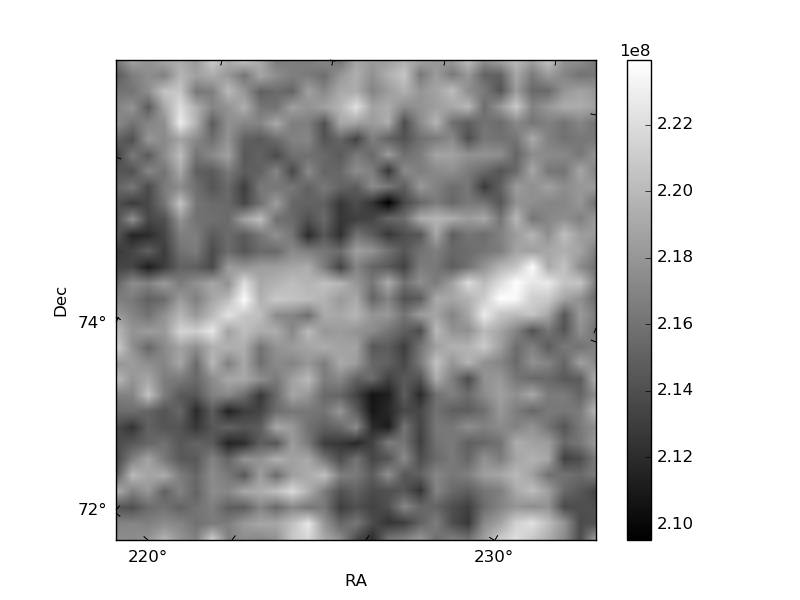
Quadrant B |
|---|---|---|---|
| Quadrant D | 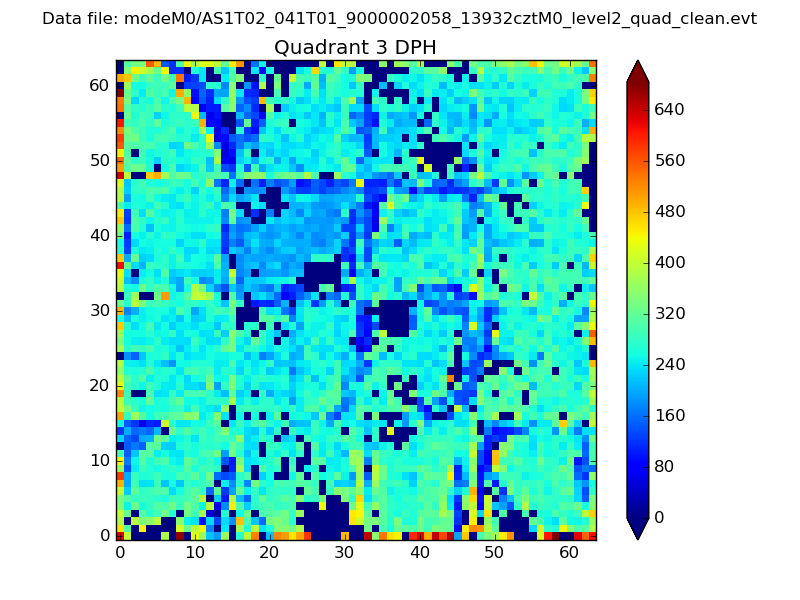 |
 |
Quadrant C |
| Plot type | Count rate plots | Images |
|---|---|---|
| Comparison with Poisson distribution Blue bars denote a histogram of data divided into 1 sec bins. Red curve is a Poisson curve with rate = median count rate of data. |
 |
 |
| Quadrant-wise count rates Data is divided into 100 sec bins |
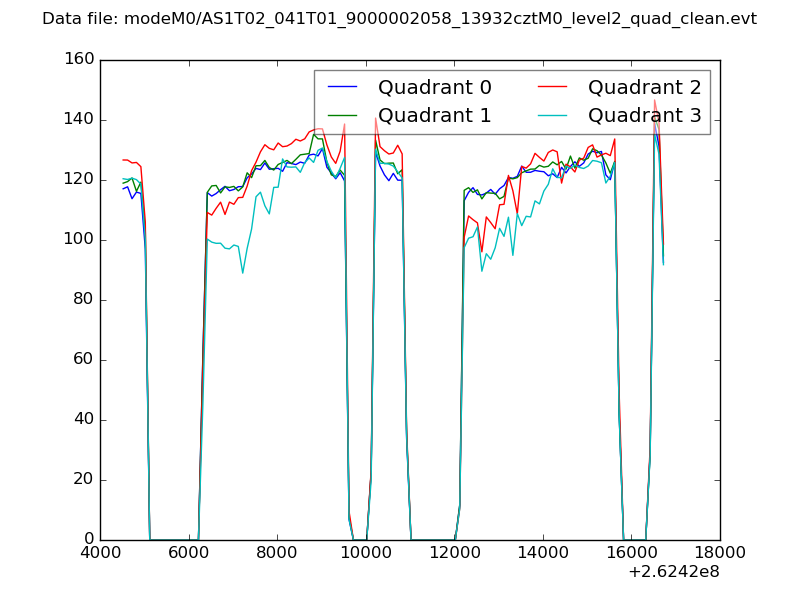 |
|
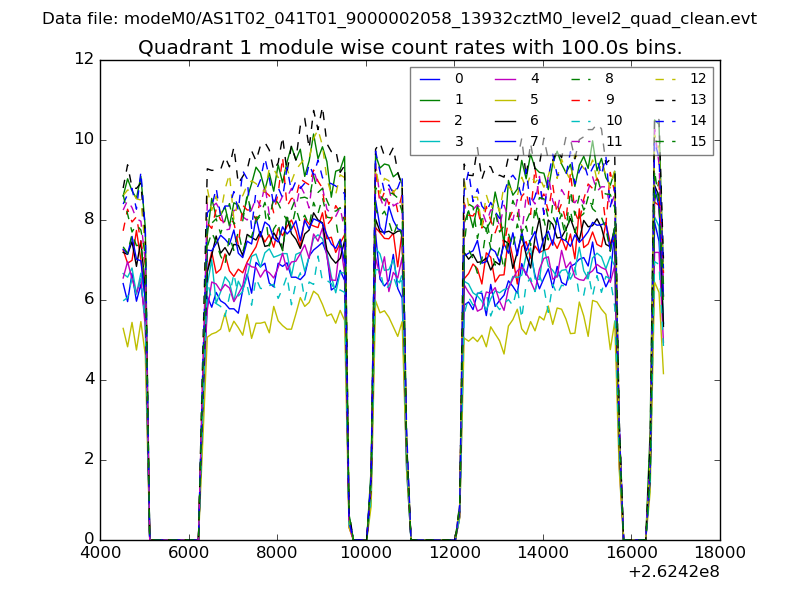
| Module-wise count rates for Quadrant A Data is divided into 100 sec bins |
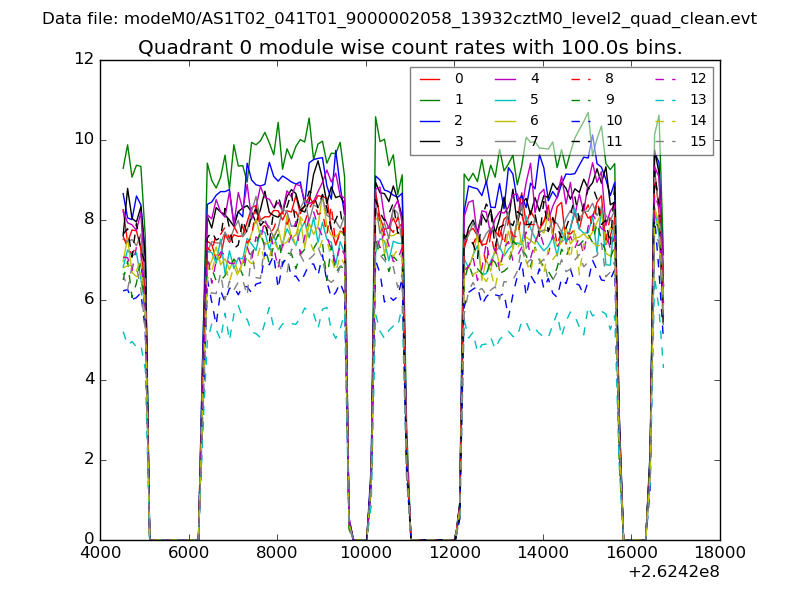 |
 |
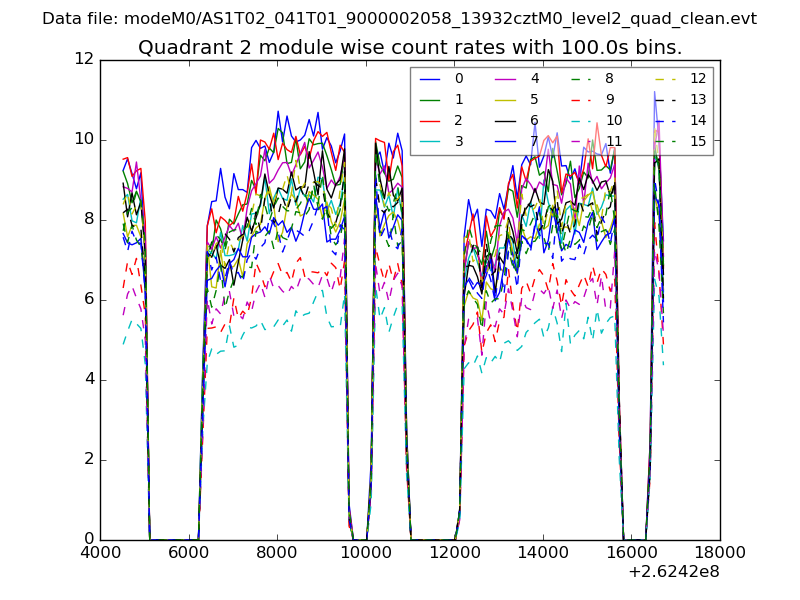
| Module-wise count rates for Quadrant B Data is divided into 100 sec bins |
 |
 |
| Module-wise count rates for Quadrant C Data is divided into 100 sec bins |
 |
 |
| Module-wise count rates for Quadrant D Data is divided into 100 sec bins |
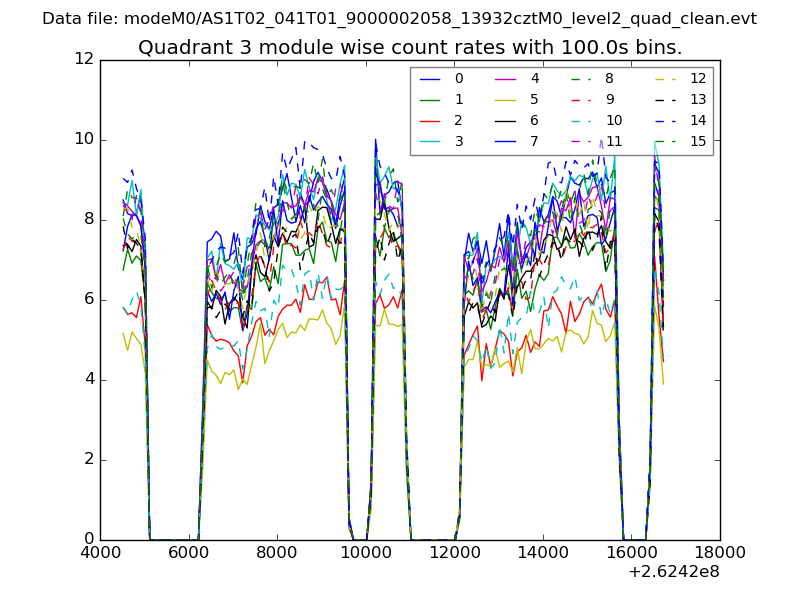 |
 |
| Parameter | Plot |
|---|---|
| CZT HV Monitor | 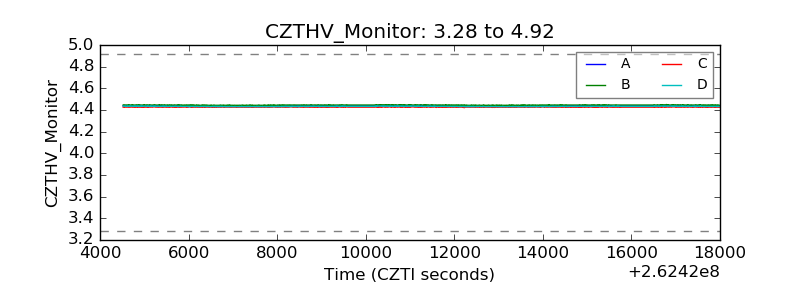 |
| D_VDD | 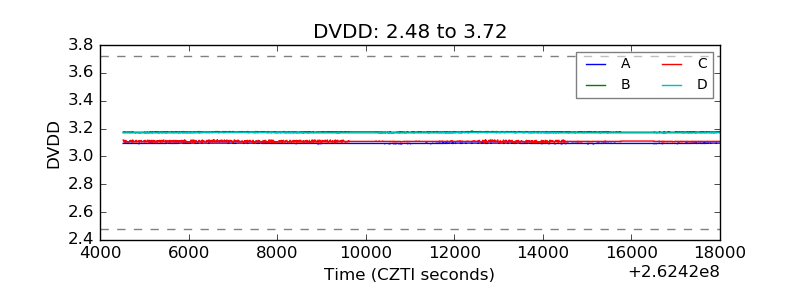 |
| Temperature 1 | 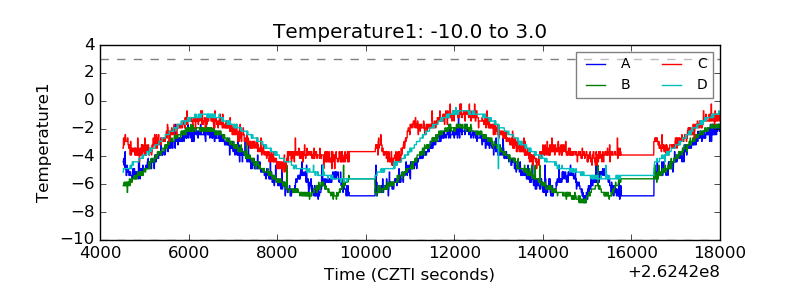 |
| Veto HV Monitor | 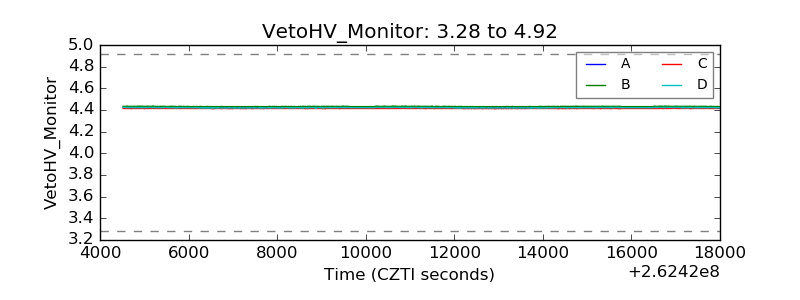 |
| Veto LLD | 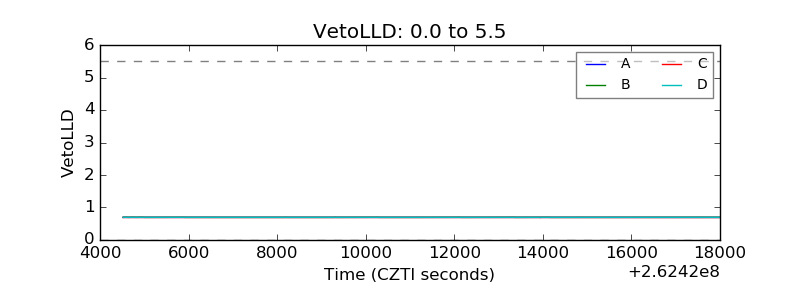 |
| Alpha Counter | 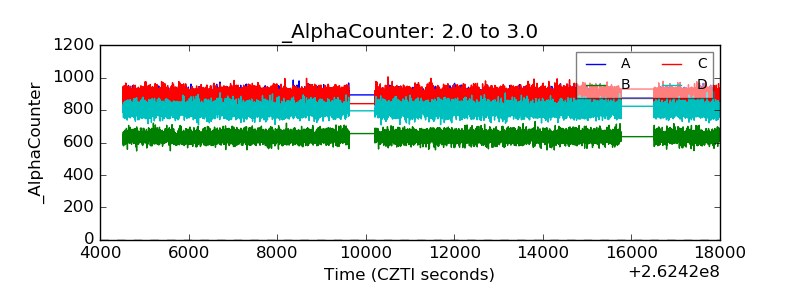 |
| _CPM_Rate | 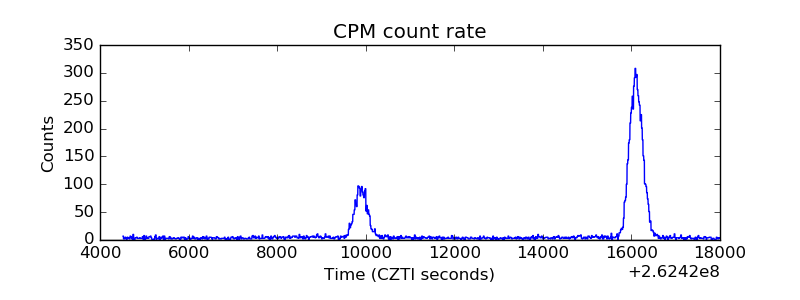 |
| CZT Counter |  |
| +2.5 Volts monitor |  |
| +5 Volts monitor | 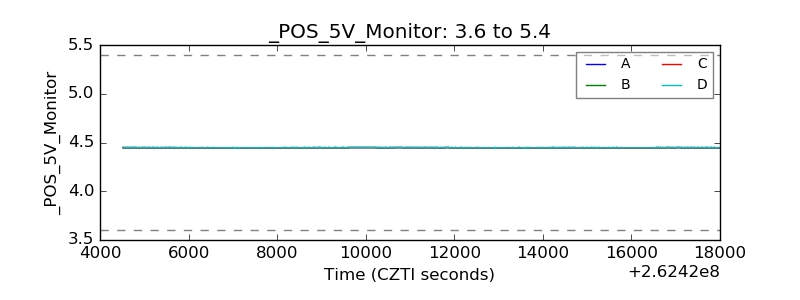 |
| _ROLL_ROT |  |
| _Roll_DEC |  |
| _Roll_RA |  |
| Veto Counter | 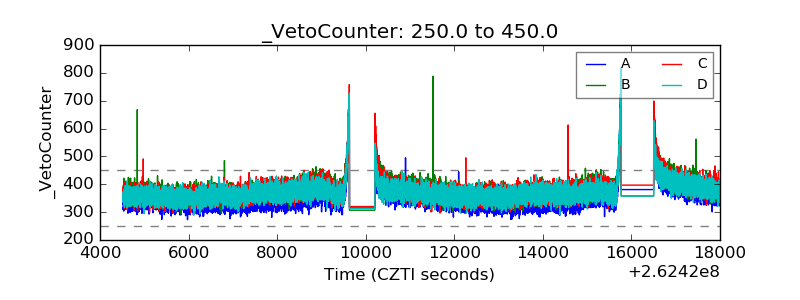 |