| Param | Original file | Final file |
|---|---|---|
| Filename | modeM0/AS1T02_041T01_9000002058_13934cztM0_level2.evt | modeM0/AS1T02_041T01_9000002058_13934cztM0_level2_quad_clean.evt |
| Size (bytes) | 578,995,200 | 94,216,320 |
| Size | 552.2 MB | 89.9 MB |
| Events in quadrant A | 3,131,206 | 605,320 |
| Events in quadrant B | 3,424,497 | 609,106 |
| Events in quadrant C | 3,928,355 | 608,244 |
| Events in quadrant D | 6,605,176 | 571,505 |
| Mode M0 | |||
|---|---|---|---|
| Quadrant | BADHDUFLAG | Total packets | Discarded packets |
| A | 0 | 13687 | 3 |
| B | 0 | 14439 | 2 |
| C | 0 | 15768 | 2 |
| D | 0 | 24171 | 2 |
| Mode M9 | |||
|---|---|---|---|
| Quadrant | BADHDUFLAG | Total packets | Discarded packets |
| A | 0 | 10 | 0 |
| B | 0 | 10 | 0 |
| C | 0 | 10 | 0 |
| D | 0 | 11 | 0 |
| Mode SS | |||
|---|---|---|---|
| Quadrant | BADHDUFLAG | Total packets | Discarded packets |
| A | 0 | 134 | 0 |
| B | 0 | 134 | 0 |
| C | 0 | 134 | 0 |
| D | 0 | 134 | 0 |
| Quadrant | Total seconds | Saturated seconds | Saturation percentage |
|---|---|---|---|
| A | 6579 | 72 | 1.094391% |
| B | 6579 | 101 | 1.535188% |
| C | 6579 | 255 | 3.875969% |
| D | 6579 | 621 | 9.439124% |
Noise dominated data is calculated using 1-second bins in cleaned event files. If a bin has >2000 counts, and if more than 50% of those come from <1% of pixels, then it is considered to be noise-dominated and hence unusable.
| Quadrant | # 1 sec bins | Bins with >0 counts | Bins with >2000 counts | High rate bins dominated by noise | Noise dominated (total time) | Noise dominated (detector-on time) | Marked lightcurve |
|---|---|---|---|---|---|---|---|
| A | 7625 | 6580 | 0 | 0 | 0.00% | 0.00% | 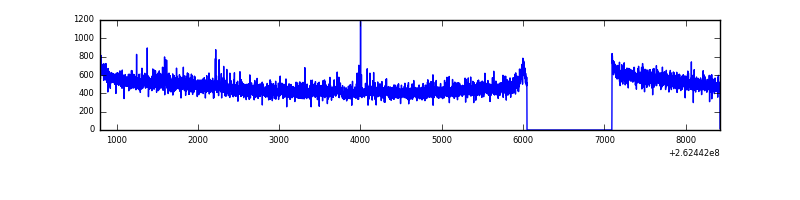 |
| B | 7625 | 6580 | 12 | 12 | 0.16% | 0.18% | 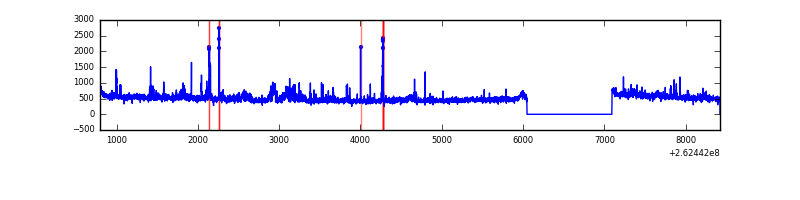 |
| C | 7625 | 6580 | 155 | 155 | 2.03% | 2.36% | 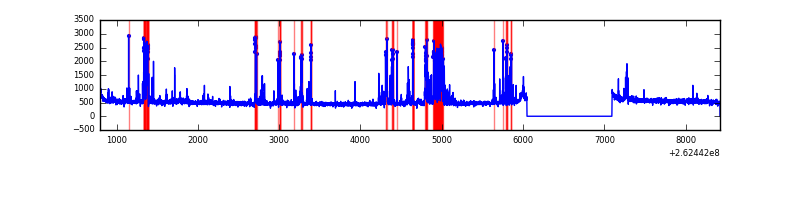 |
| D | 7625 | 6580 | 551 | 551 | 7.23% | 8.37% | 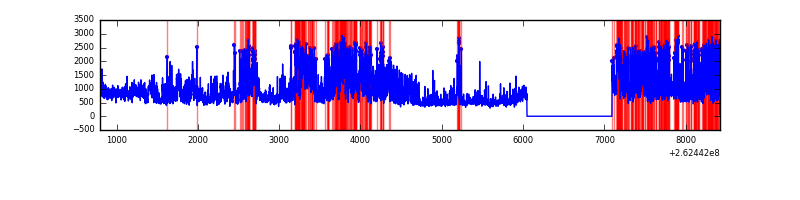 |
Top three noisy pixels from each quadrant. If the there are fewer than three noisy pixels in the level2.evt file, extra rows are filled as -1
| Pixel properties | Quadrant properties | ||||||
|---|---|---|---|---|---|---|---|
| Quadrant | DetID | PixID | Counts | Sigma | Mean | Median | Sigma |
| A | 1 | 162 | 27730 | 165.97 | 801 | 783 | 162.4 |
| A | 1 | 178 | 10230 | 58.18 | 801 | 783 | 162.4 |
| A | 1 | 161 | 8766 | 49.17 | 801 | 783 | 162.4 |
| B | 0 | 230 | 127349 | 840.67 | 798 | 778 | 150.6 |
| B | 3 | 64 | 56998 | 373.41 | 798 | 778 | 150.6 |
| B | 0 | 189 | 30141 | 195.03 | 798 | 778 | 150.6 |
| C | 4 | 254 | 710518 | 3993.74 | 774 | 778 | 177.7 |
| C | 3 | 233 | 186947 | 1047.58 | 774 | 778 | 177.7 |
| C | 12 | 4 | 6867 | 34.26 | 774 | 778 | 177.7 |
| D | 1 | 52 | 2662278 | 14785.77 | 761 | 741 | 180.0 |
| D | 15 | 0 | 348308 | 1930.86 | 761 | 741 | 180.0 |
| D | 12 | 110 | 334734 | 1855.45 | 761 | 741 | 180.0 |
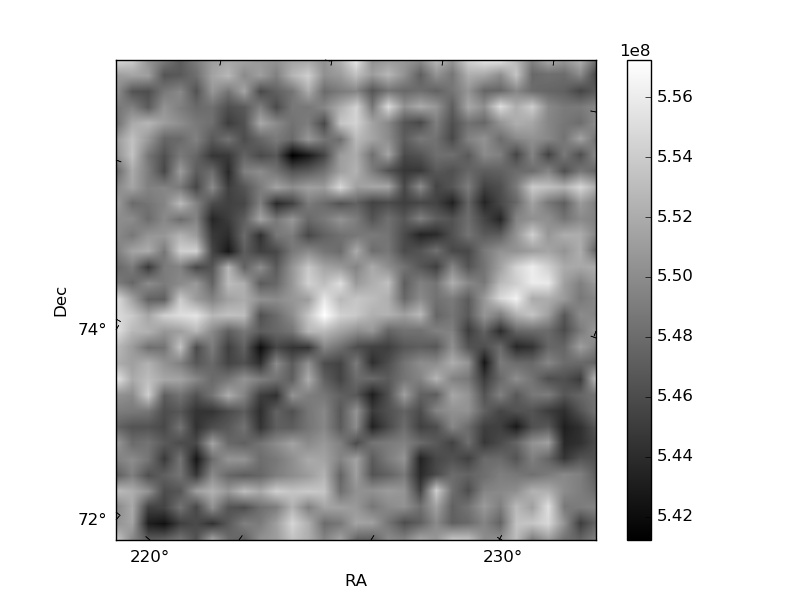
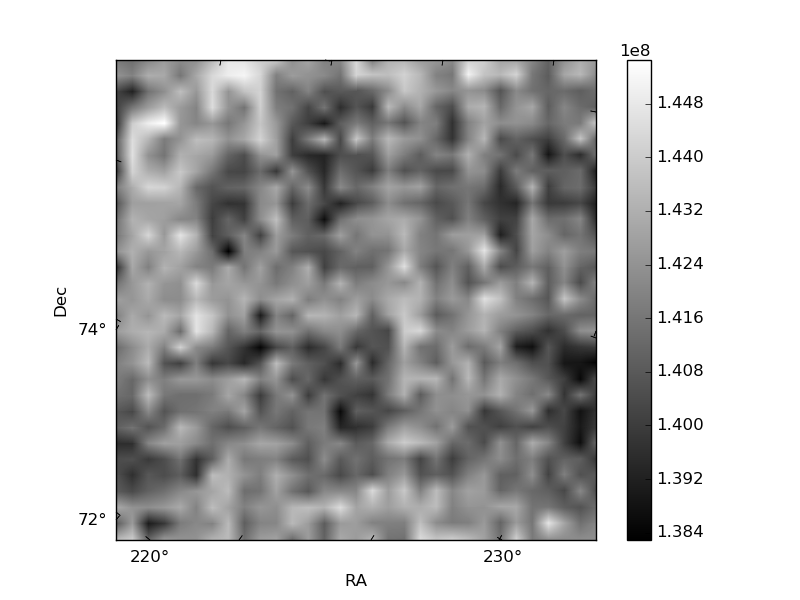
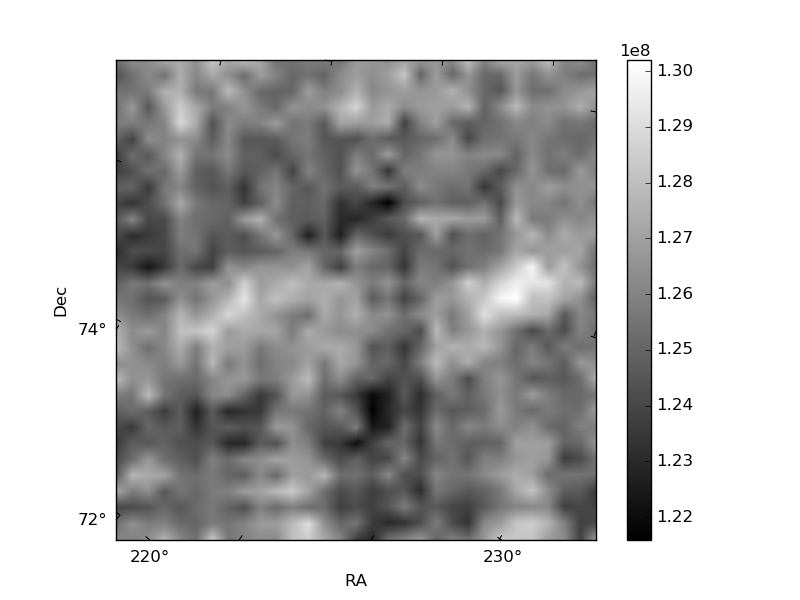
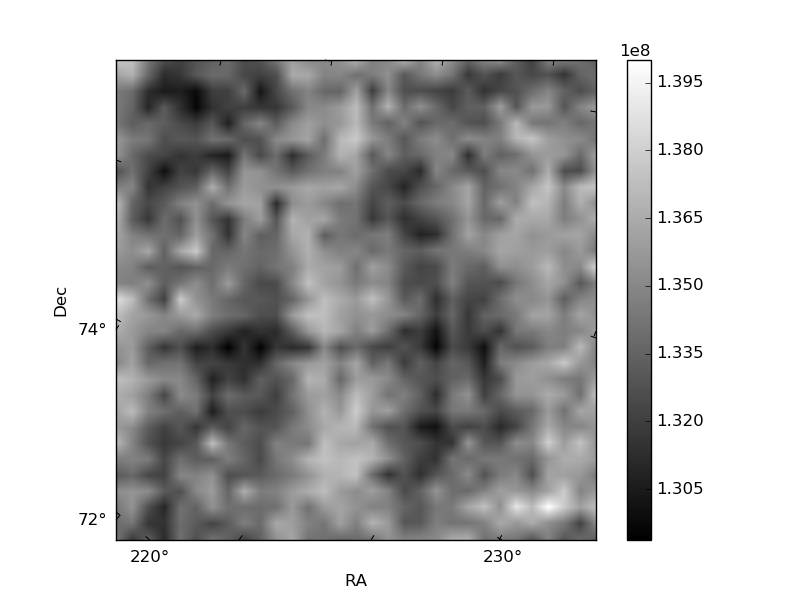
Histogram calculated using DETX and DETY for each event in the final _common_clean file
| Quadrant A | 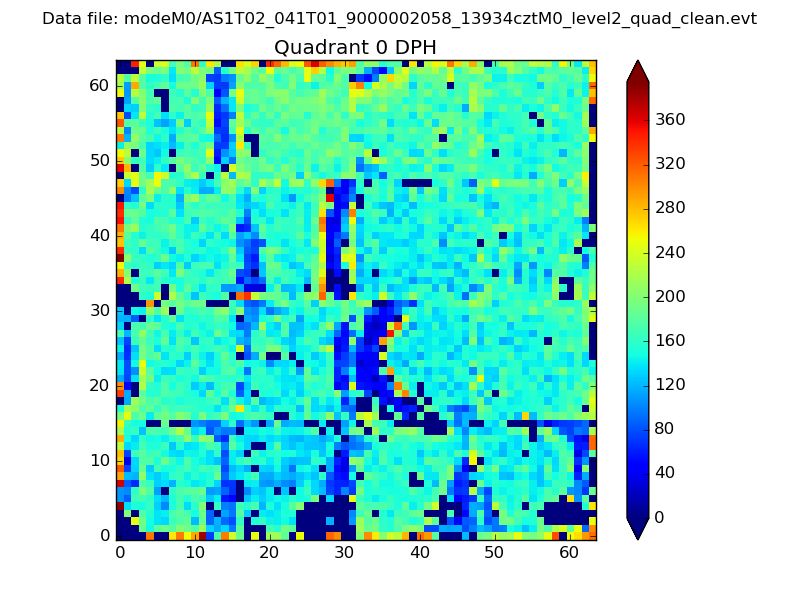 |
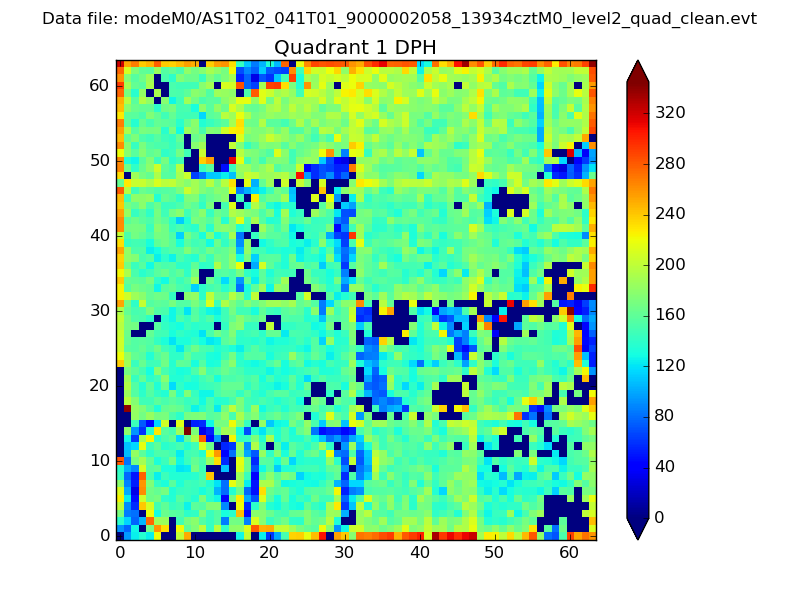 |
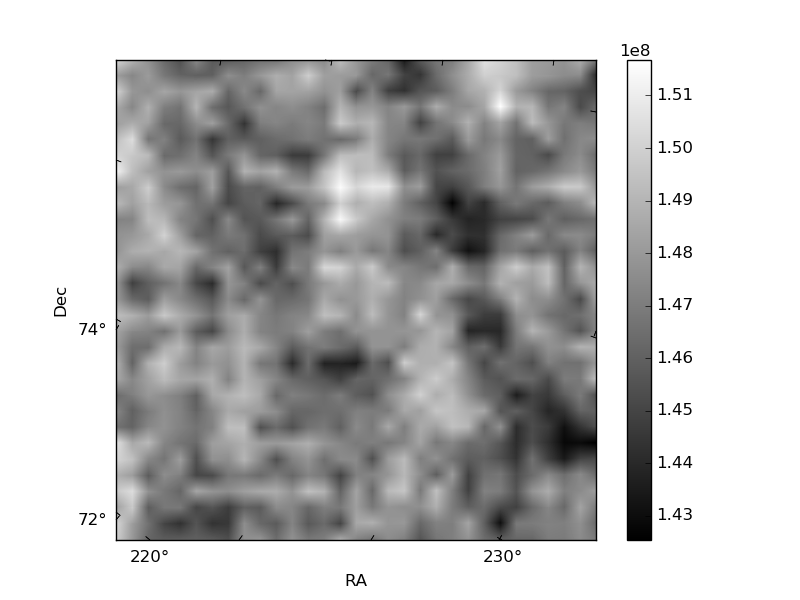
Quadrant B |
|---|---|---|---|
| Quadrant D | 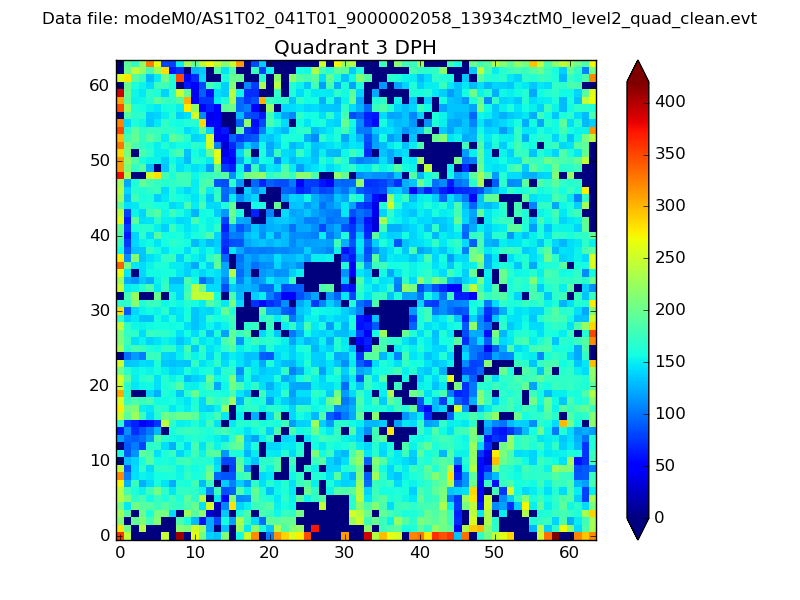 |
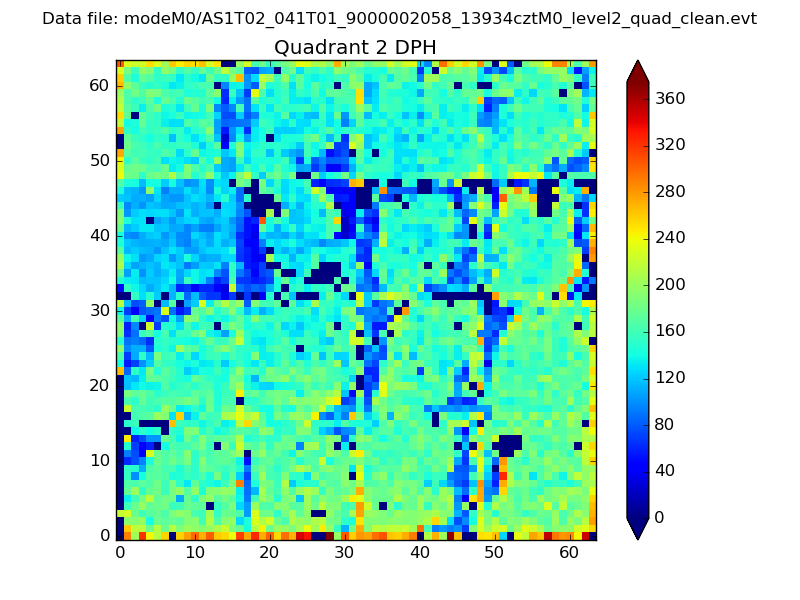 |
Quadrant C |
| Plot type | Count rate plots | Images |
|---|---|---|
| Comparison with Poisson distribution Blue bars denote a histogram of data divided into 1 sec bins. Red curve is a Poisson curve with rate = median count rate of data. |
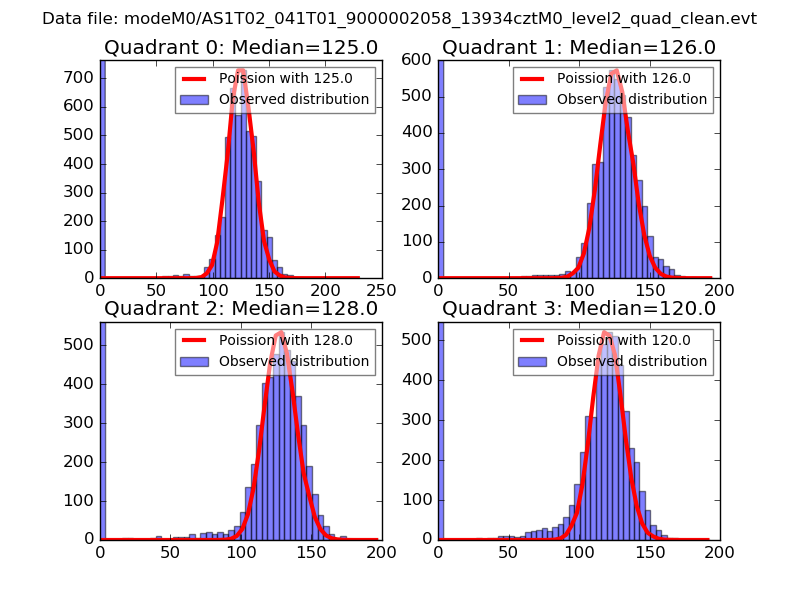 |
 |
| Quadrant-wise count rates Data is divided into 100 sec bins |
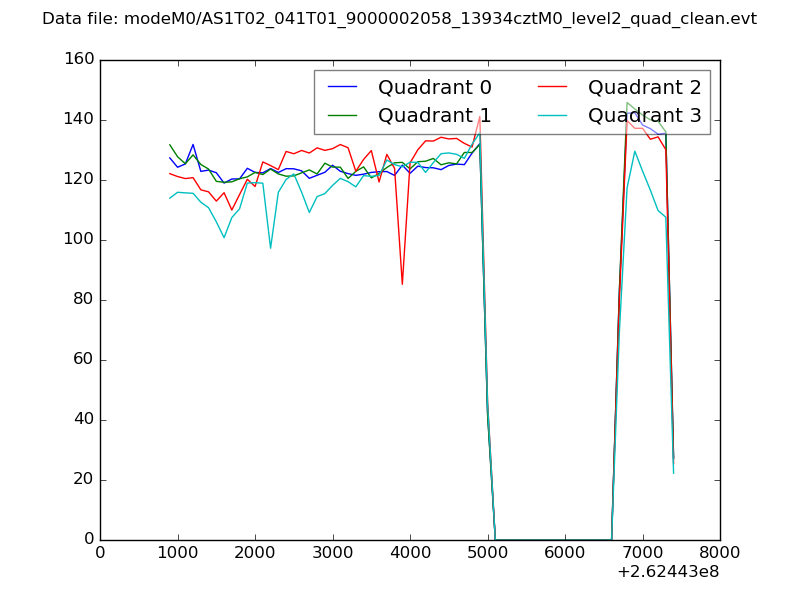 |
|
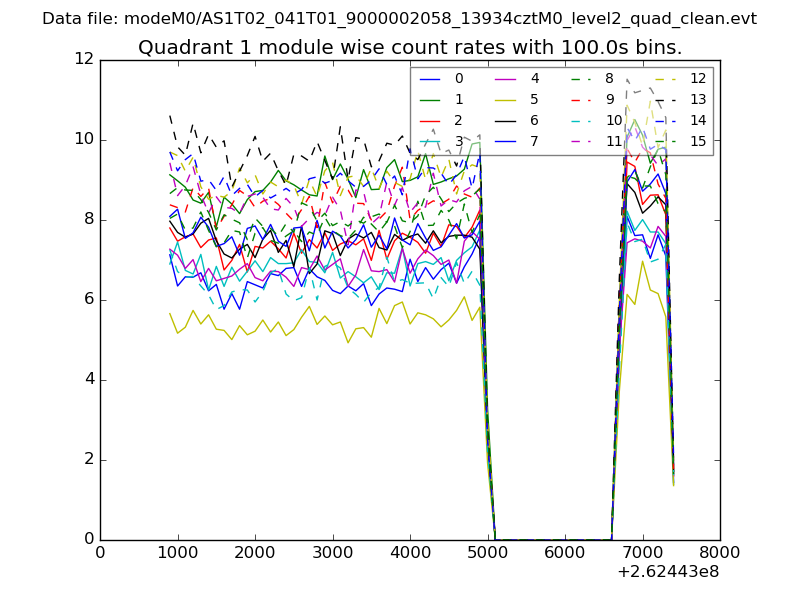
| Module-wise count rates for Quadrant A Data is divided into 100 sec bins |
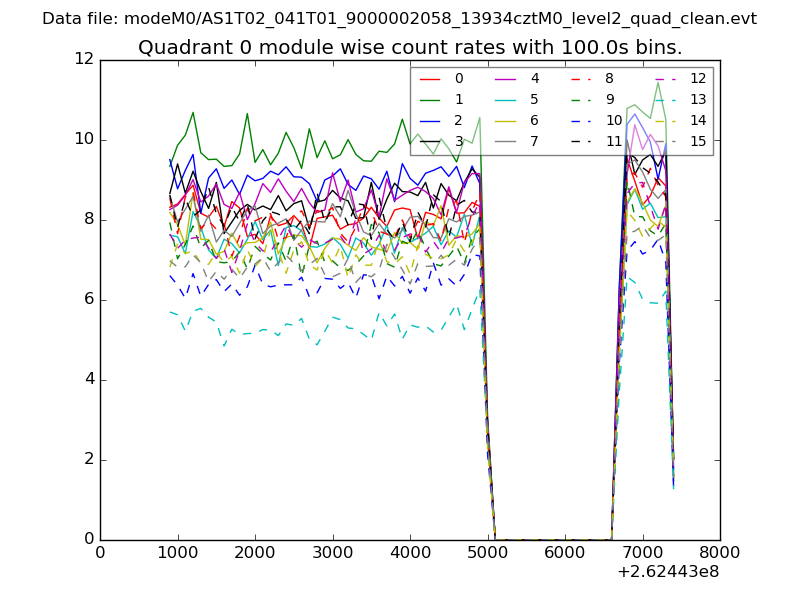 |
 |
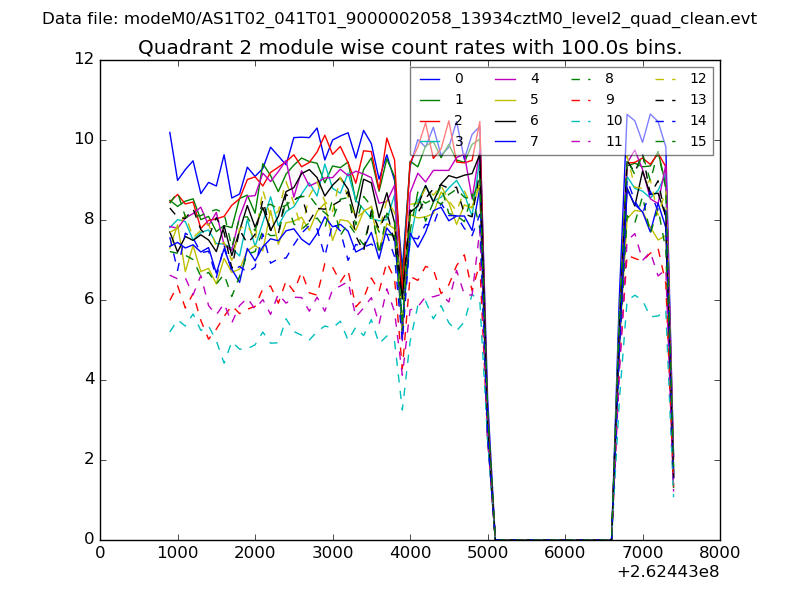
| Module-wise count rates for Quadrant B Data is divided into 100 sec bins |
 |
 |
| Module-wise count rates for Quadrant C Data is divided into 100 sec bins |
 |
 |
| Module-wise count rates for Quadrant D Data is divided into 100 sec bins |
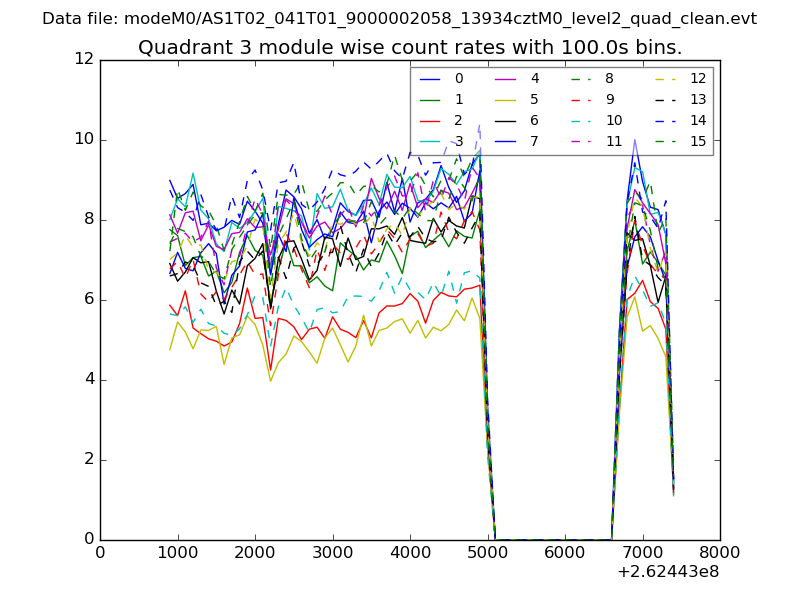 |
 |
| Parameter | Plot |
|---|---|
| CZT HV Monitor | 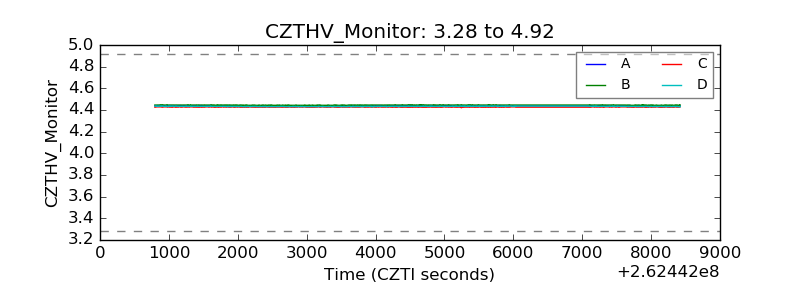 |
| D_VDD | 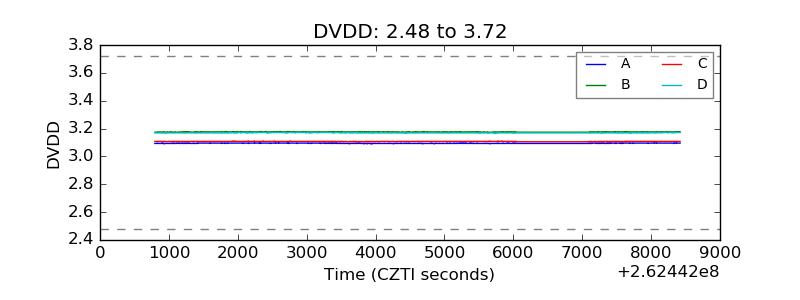 |
| Temperature 1 | 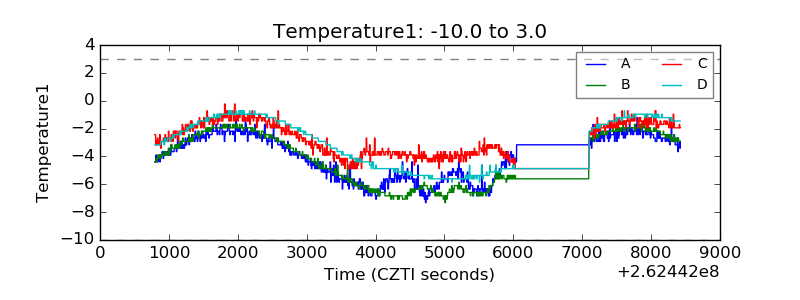 |
| Veto HV Monitor | 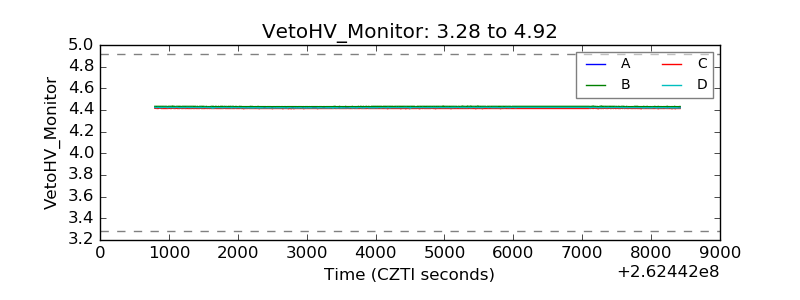 |
| Veto LLD | 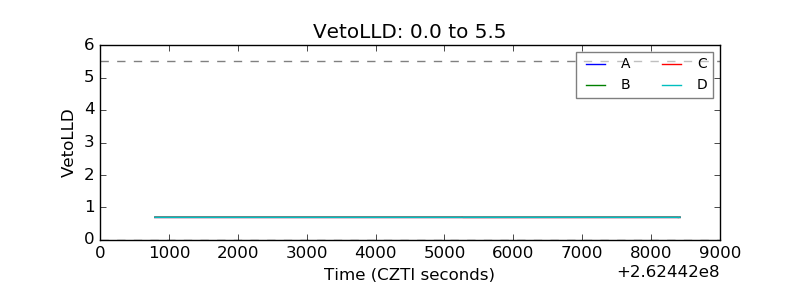 |
| Alpha Counter | 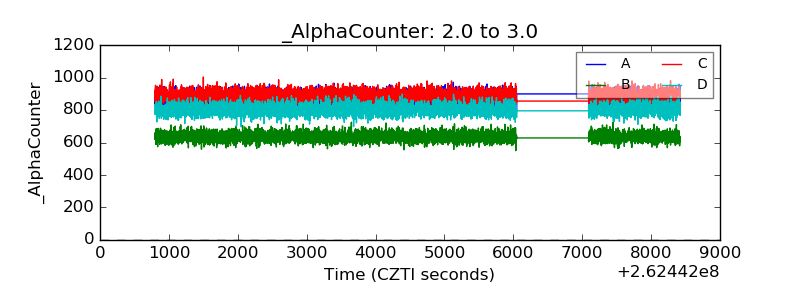 |
| _CPM_Rate | 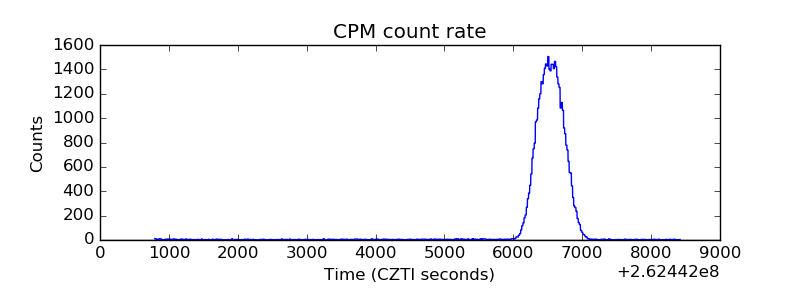 |
| CZT Counter | 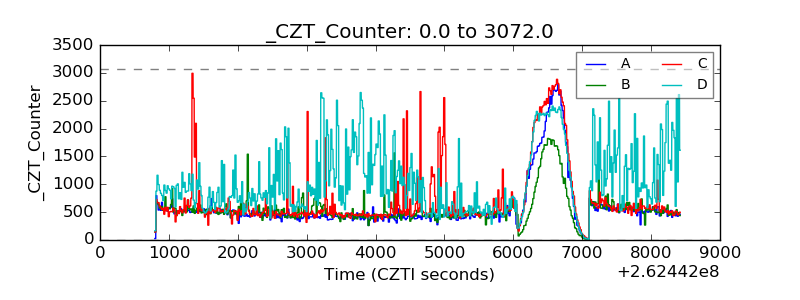 |
| +2.5 Volts monitor |  |
| +5 Volts monitor |  |
| _ROLL_ROT | 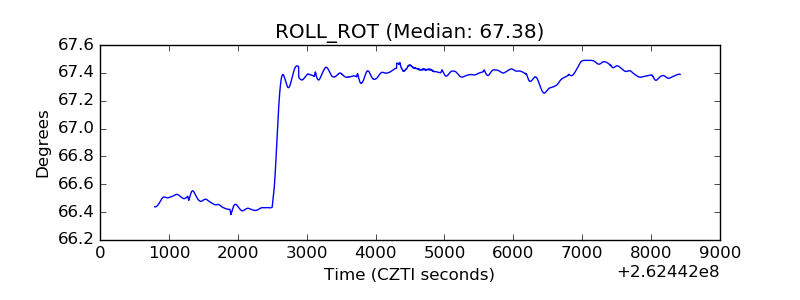 |
| _Roll_DEC | 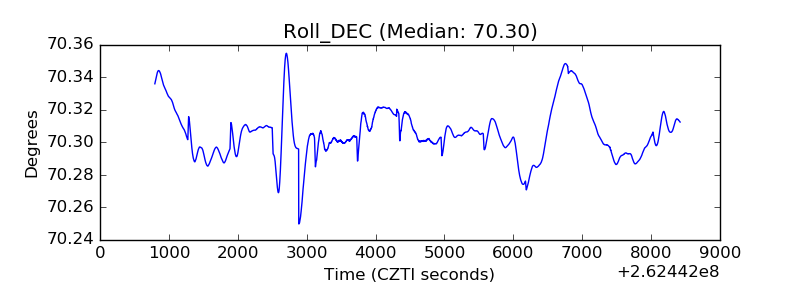 |
| _Roll_RA | 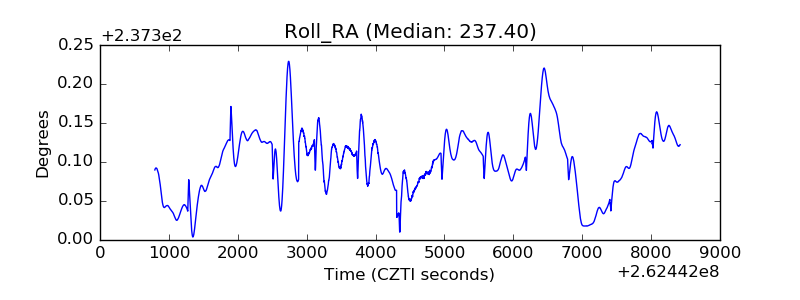 |
| Veto Counter | 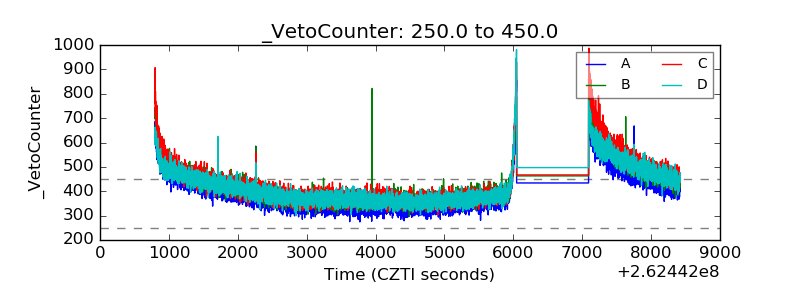 |