| Param | Original file | Final file |
|---|---|---|
| Filename | modeM0/AS1T02_041T01_9000002058_13936cztM0_level2.evt | modeM0/AS1T02_041T01_9000002058_13936cztM0_level2_quad_clean.evt |
| Size (bytes) | 656,375,040 | 109,258,560 |
| Size | 626.0 MB | 104.2 MB |
| Events in quadrant A | 3,073,811 | 732,591 |
| Events in quadrant B | 3,362,572 | 741,154 |
| Events in quadrant C | 4,130,589 | 743,741 |
| Events in quadrant D | 8,882,357 | 647,971 |
| Mode M0 | |||
|---|---|---|---|
| Quadrant | BADHDUFLAG | Total packets | Discarded packets |
| A | 0 | 13472 | 3 |
| B | 0 | 14216 | 2 |
| C | 0 | 16369 | 2 |
| D | 0 | 30811 | 2 |
| Mode M9 | |||
|---|---|---|---|
| Quadrant | BADHDUFLAG | Total packets | Discarded packets |
| A | 0 | 18 | 0 |
| B | 0 | 18 | 0 |
| C | 0 | 18 | 0 |
| D | 0 | 19 | 0 |
| Mode SS | |||
|---|---|---|---|
| Quadrant | BADHDUFLAG | Total packets | Discarded packets |
| A | 0 | 130 | 0 |
| B | 0 | 130 | 0 |
| C | 0 | 130 | 0 |
| D | 0 | 130 | 0 |
| Quadrant | Total seconds | Saturated seconds | Saturation percentage |
|---|---|---|---|
| A | 6343 | 62 | 0.977455% |
| B | 6343 | 83 | 1.308529% |
| C | 6343 | 212 | 3.342267% |
| D | 6343 | 1566 | 24.688633% |
Noise dominated data is calculated using 1-second bins in cleaned event files. If a bin has >2000 counts, and if more than 50% of those come from <1% of pixels, then it is considered to be noise-dominated and hence unusable.
| Quadrant | # 1 sec bins | Bins with >0 counts | Bins with >2000 counts | High rate bins dominated by noise | Noise dominated (total time) | Noise dominated (detector-on time) | Marked lightcurve |
|---|---|---|---|---|---|---|---|
| A | 7529 | 6344 | 0 | 0 | 0.00% | 0.00% | 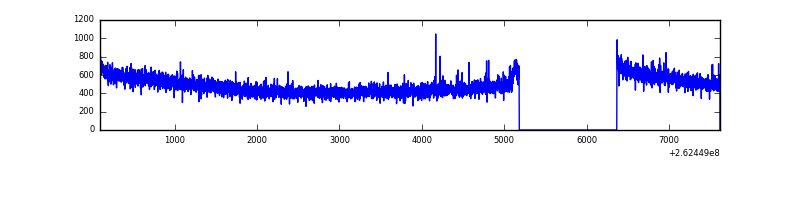 |
| B | 7529 | 6344 | 13 | 13 | 0.17% | 0.20% | 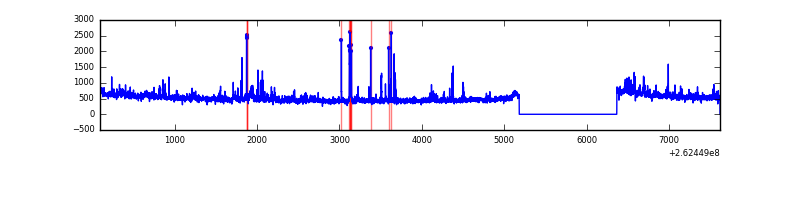 |
| C | 7529 | 6344 | 153 | 153 | 2.03% | 2.41% | 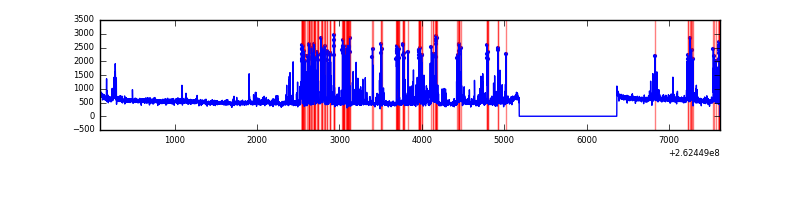 |
| D | 7528 | 6343 | 1490 | 1490 | 19.79% | 23.49% | 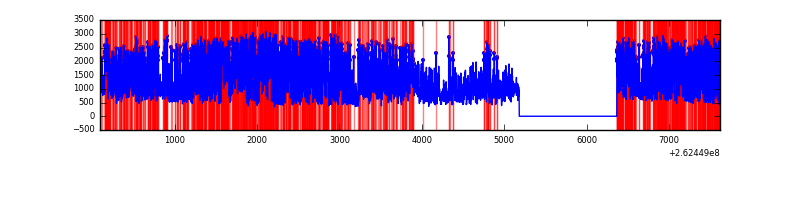 |
Top three noisy pixels from each quadrant. If the there are fewer than three noisy pixels in the level2.evt file, extra rows are filled as -1
| Pixel properties | Quadrant properties | ||||||
|---|---|---|---|---|---|---|---|
| Quadrant | DetID | PixID | Counts | Sigma | Mean | Median | Sigma |
| A | 1 | 162 | 21255 | 128.78 | 790 | 773 | 159.0 |
| A | 1 | 178 | 7595 | 42.89 | 790 | 773 | 159.0 |
| A | 0 | 226 | 6999 | 39.15 | 790 | 773 | 159.0 |
| B | 0 | 230 | 86919 | 587.75 | 792 | 774 | 146.6 |
| B | 0 | 189 | 37510 | 250.64 | 792 | 774 | 146.6 |
| B | 0 | 244 | 29257 | 194.33 | 792 | 774 | 146.6 |
| C | 4 | 254 | 898412 | 5054.26 | 778 | 784 | 177.6 |
| C | 3 | 233 | 189488 | 1062.53 | 778 | 784 | 177.6 |
| C | 14 | 234 | 6943 | 34.68 | 778 | 784 | 177.6 |
| D | 1 | 52 | 5486214 | 32594.33 | 716 | 700 | 168.3 |
| D | 12 | 110 | 409972 | 2431.85 | 716 | 700 | 168.3 |
| D | 10 | 157 | 91252 | 538.05 | 716 | 700 | 168.3 |
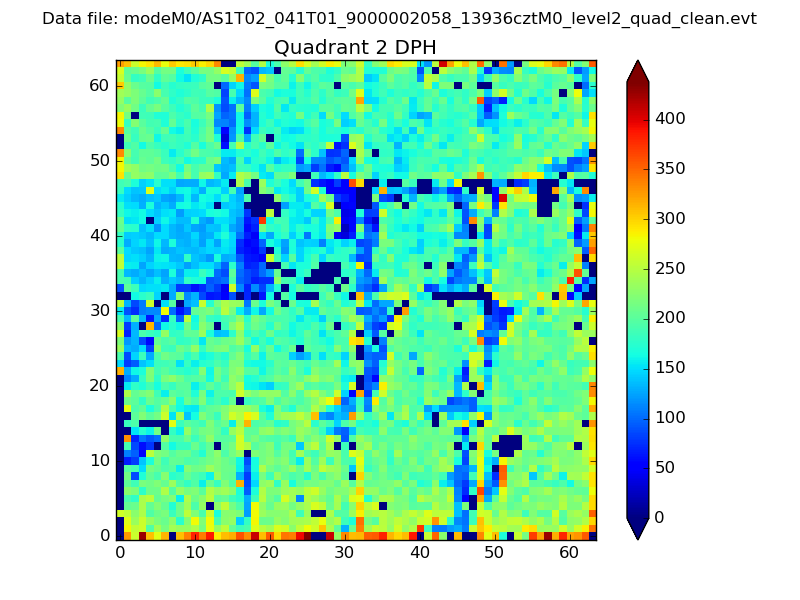
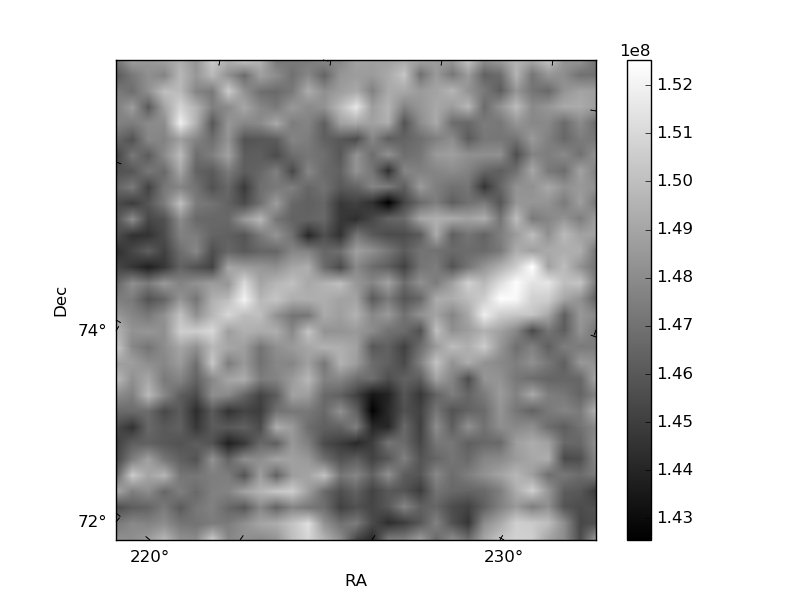
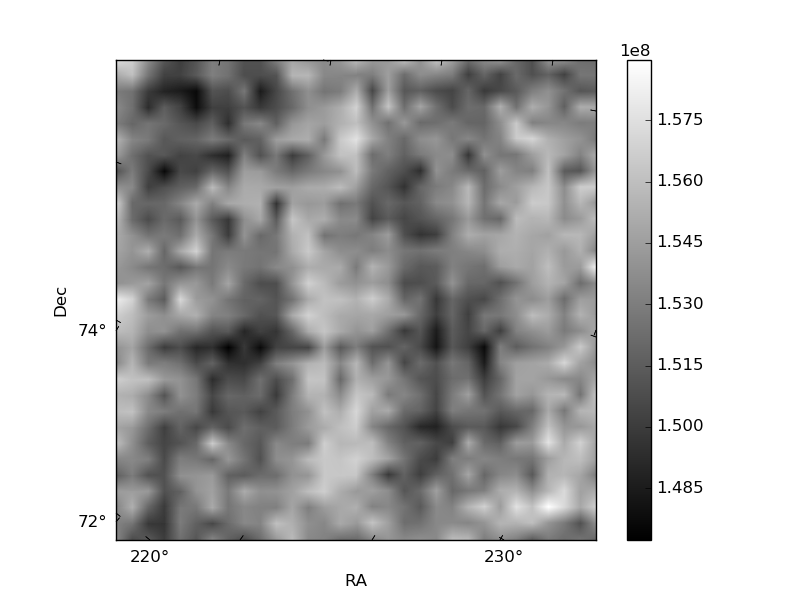
Histogram calculated using DETX and DETY for each event in the final _common_clean file
| Quadrant A | 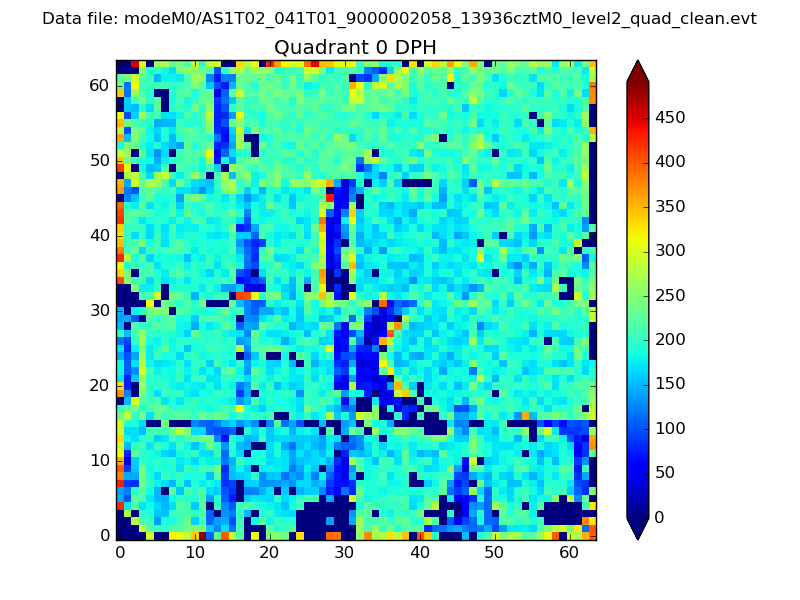 |
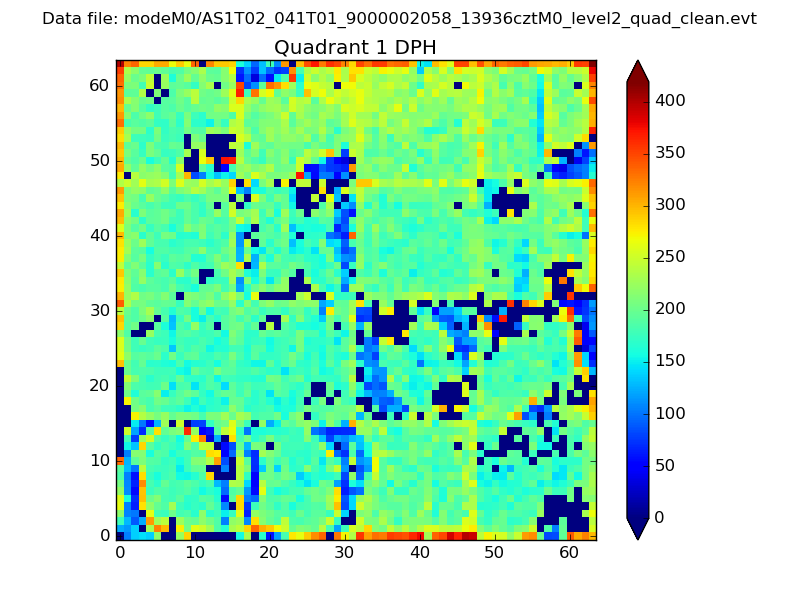 |
Quadrant B |
|---|---|---|---|
| Quadrant D | 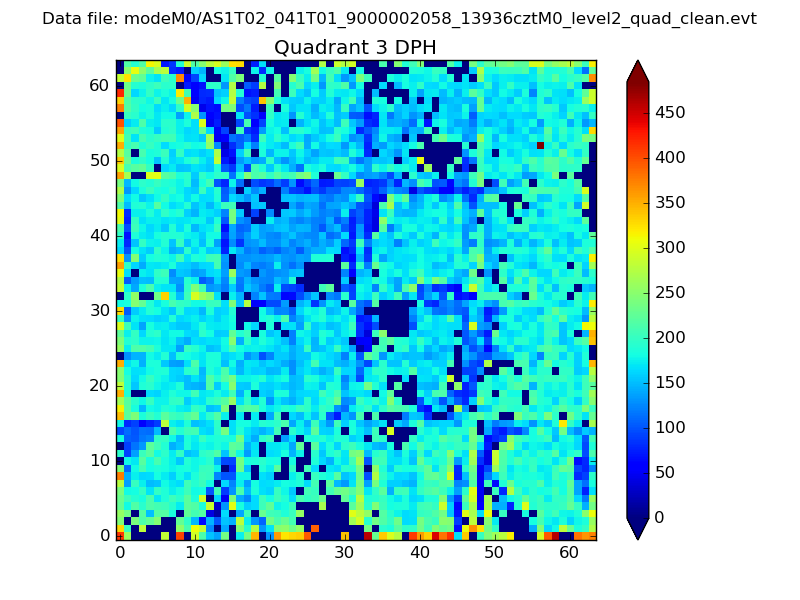 |
 |
Quadrant C |
| Plot type | Count rate plots | Images |
|---|---|---|
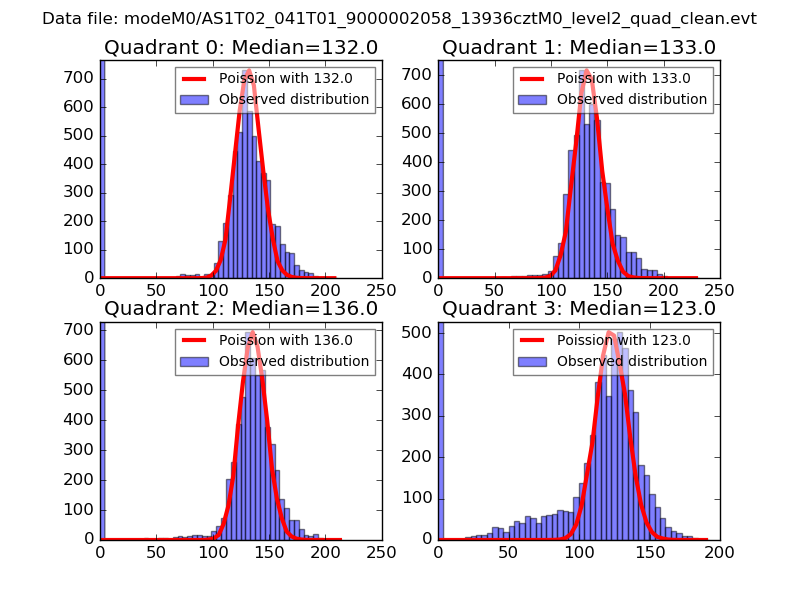
| Comparison with Poisson distribution Blue bars denote a histogram of data divided into 1 sec bins. Red curve is a Poisson curve with rate = median count rate of data. |
 |
 |
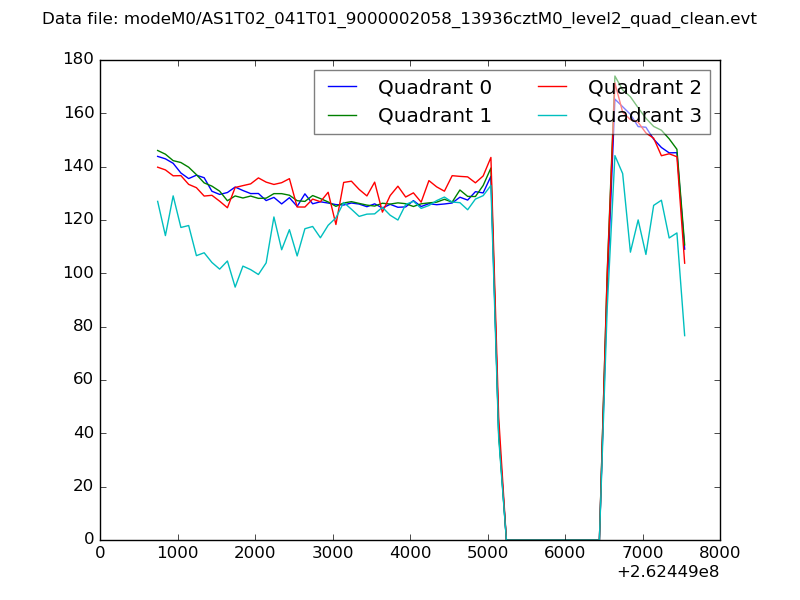
| Quadrant-wise count rates Data is divided into 100 sec bins |
 |
|
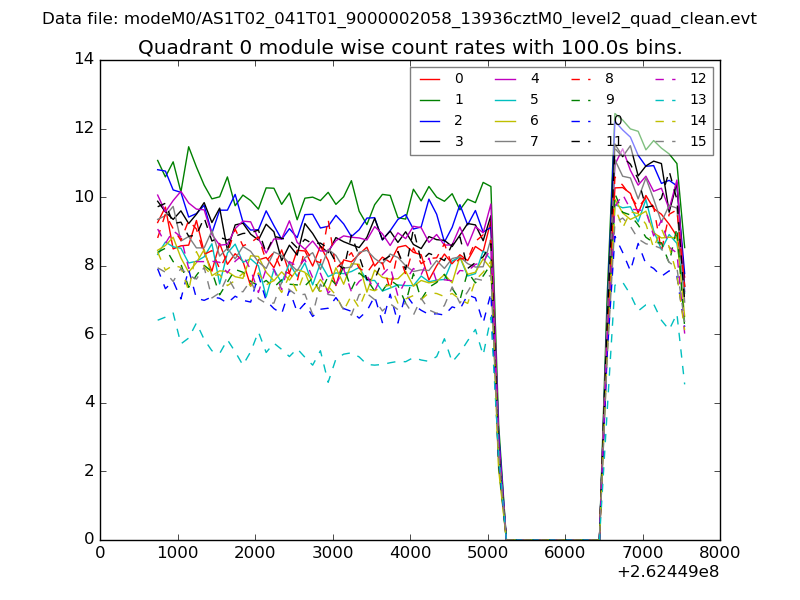
| Module-wise count rates for Quadrant A Data is divided into 100 sec bins |
 |
 |
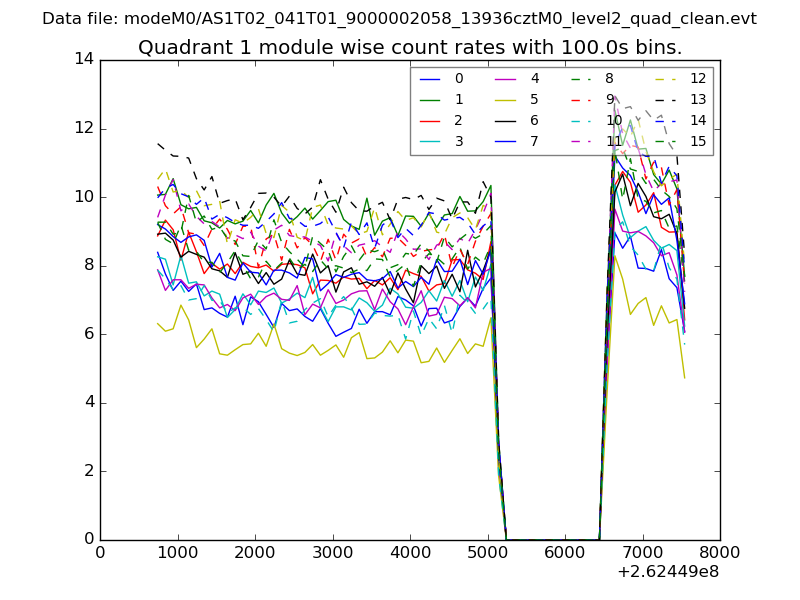
| Module-wise count rates for Quadrant B Data is divided into 100 sec bins |
 |
 |
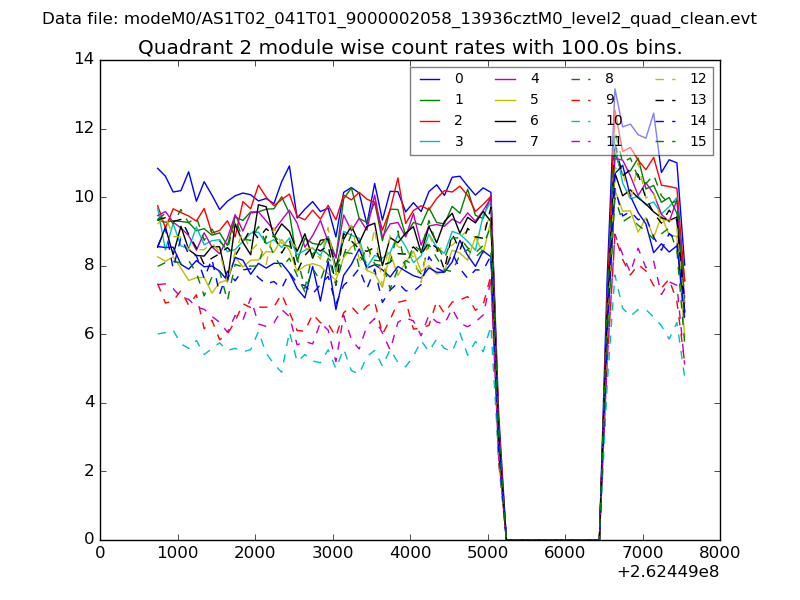
| Module-wise count rates for Quadrant C Data is divided into 100 sec bins |
 |
 |
| Module-wise count rates for Quadrant D Data is divided into 100 sec bins |
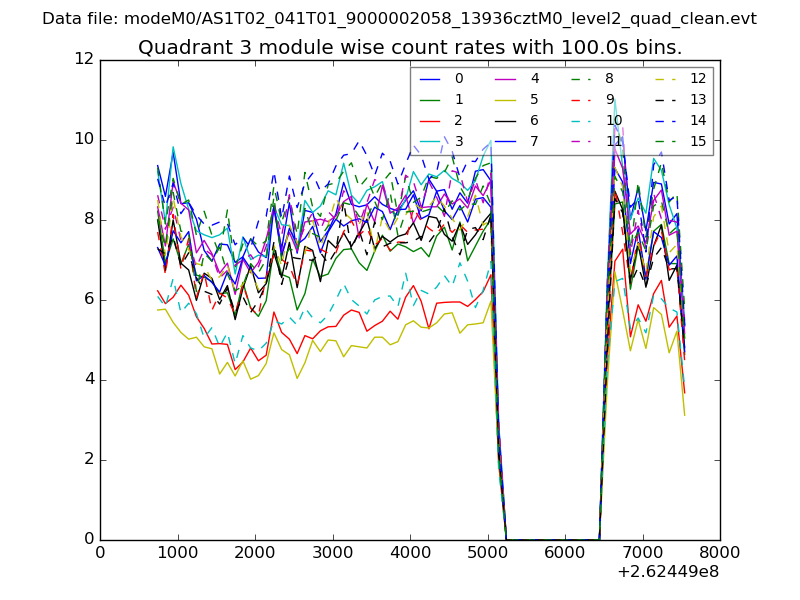 |
 |
| Parameter | Plot |
|---|---|
| CZT HV Monitor | 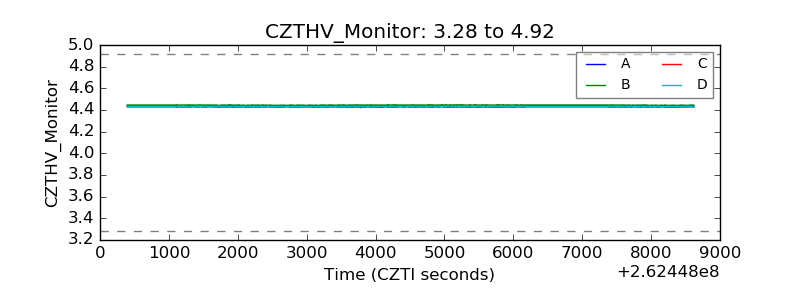 |
| D_VDD | 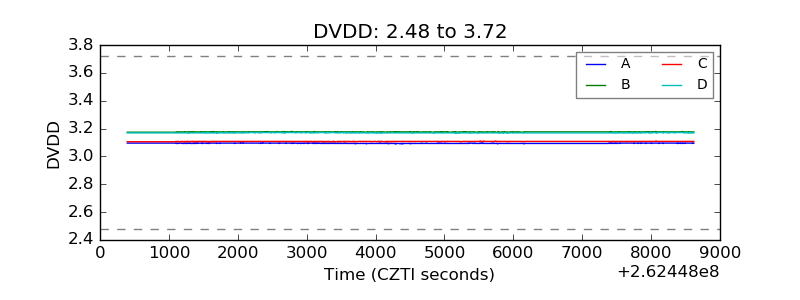 |
| Temperature 1 | 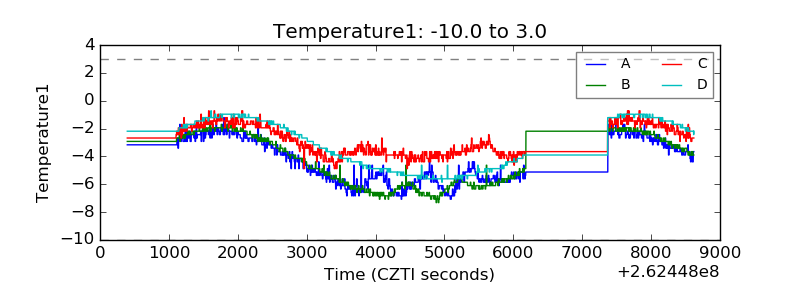 |
| Veto HV Monitor | 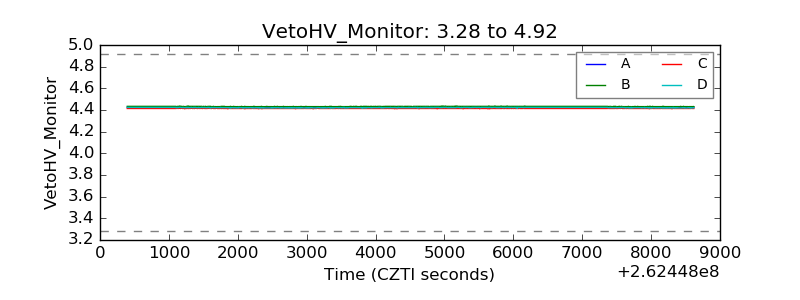 |
| Veto LLD | 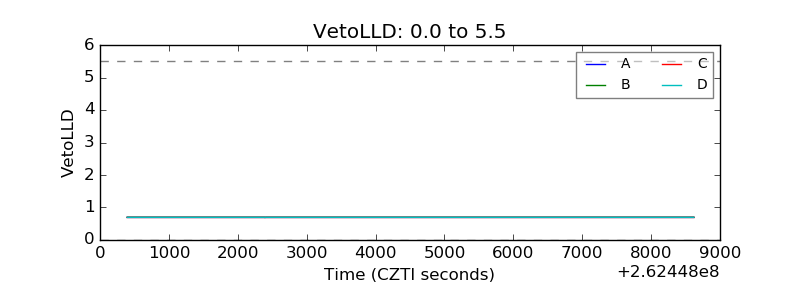 |
| Alpha Counter | 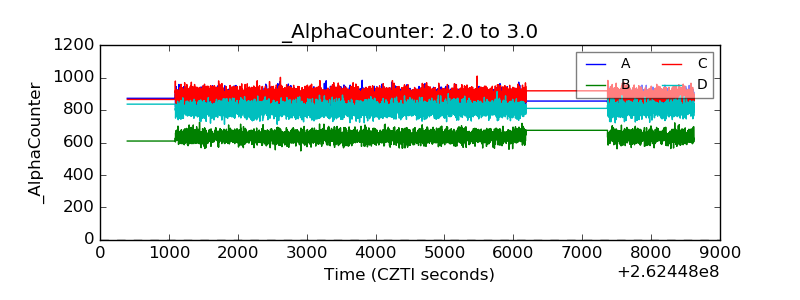 |
| _CPM_Rate | 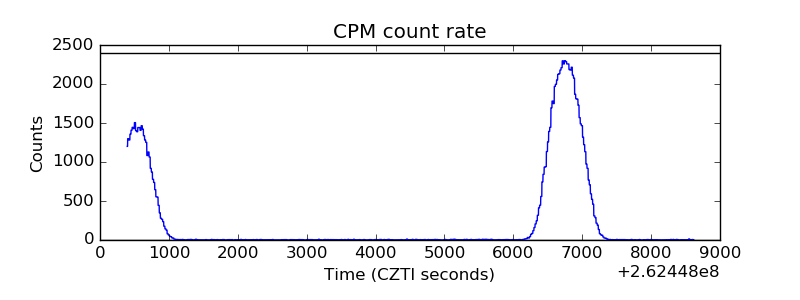 |
| CZT Counter | 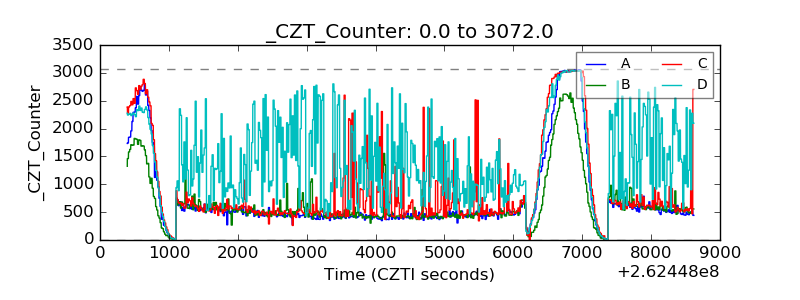 |
| +2.5 Volts monitor |  |
| +5 Volts monitor | 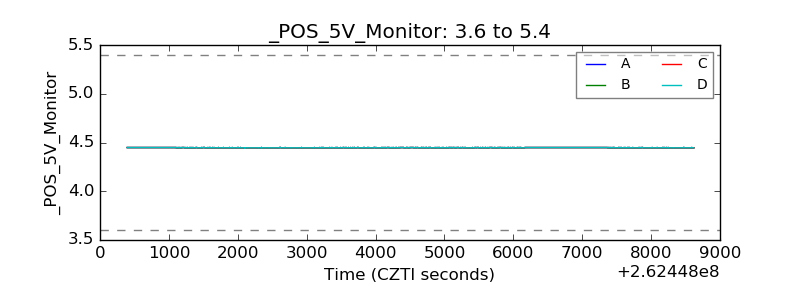 |
| _ROLL_ROT | 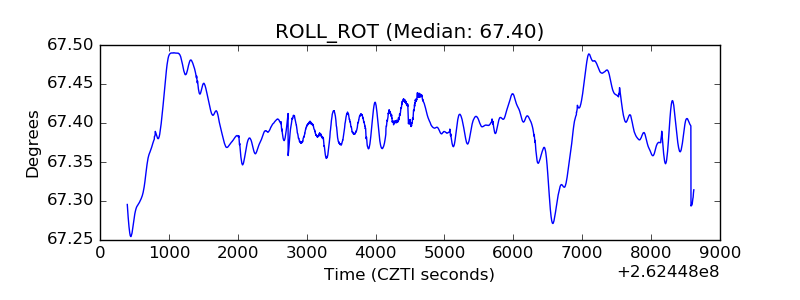 |
| _Roll_DEC | 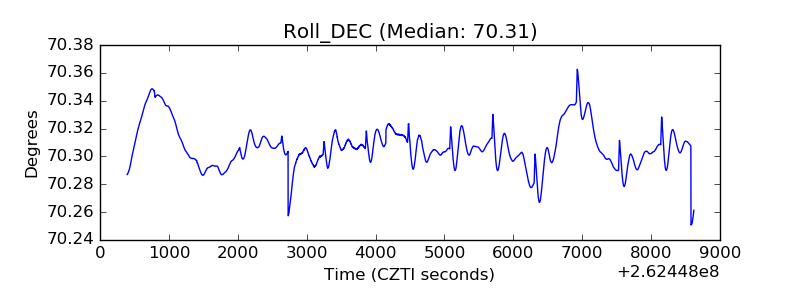 |
| _Roll_RA | 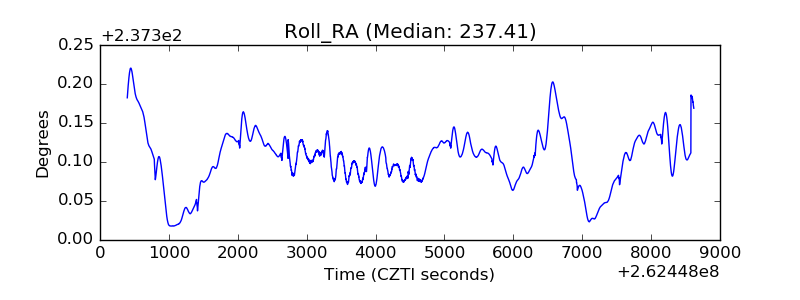 |
| Veto Counter | 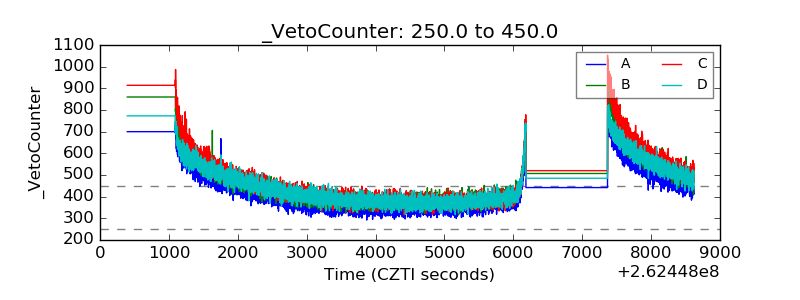 |