| Param | Original file | Final file |
|---|---|---|
| Filename | modeM0/AS1T02_041T01_9000002058_13937cztM0_level2.evt | modeM0/AS1T02_041T01_9000002058_13937cztM0_level2_quad_clean.evt |
| Size (bytes) | 592,205,760 | 122,702,400 |
| Size | 564.8 MB | 117.0 MB |
| Events in quadrant A | 3,024,115 | 825,233 |
| Events in quadrant B | 3,262,461 | 848,985 |
| Events in quadrant C | 3,544,272 | 865,605 |
| Events in quadrant D | 7,692,556 | 751,548 |
| Mode M0 | |||
|---|---|---|---|
| Quadrant | BADHDUFLAG | Total packets | Discarded packets |
| A | 0 | 13116 | 2 |
| B | 0 | 13760 | 1 |
| C | 0 | 14530 | 1 |
| D | 0 | 27155 | 1 |
| Mode M9 | |||
|---|---|---|---|
| Quadrant | BADHDUFLAG | Total packets | Discarded packets |
| A | 0 | 13 | 0 |
| B | 0 | 13 | 0 |
| C | 0 | 13 | 0 |
| D | 0 | 13 | 0 |
| Mode SS | |||
|---|---|---|---|
| Quadrant | BADHDUFLAG | Total packets | Discarded packets |
| A | 0 | 124 | 0 |
| B | 0 | 124 | 0 |
| C | 0 | 124 | 0 |
| D | 0 | 124 | 0 |
| Quadrant | Total seconds | Saturated seconds | Saturation percentage |
|---|---|---|---|
| A | 6080 | 51 | 0.838816% |
| B | 6080 | 60 | 0.986842% |
| C | 6080 | 78 | 1.282895% |
| D | 6080 | 1254 | 20.625000% |
Noise dominated data is calculated using 1-second bins in cleaned event files. If a bin has >2000 counts, and if more than 50% of those come from <1% of pixels, then it is considered to be noise-dominated and hence unusable.
| Quadrant | # 1 sec bins | Bins with >0 counts | Bins with >2000 counts | High rate bins dominated by noise | Noise dominated (total time) | Noise dominated (detector-on time) | Marked lightcurve |
|---|---|---|---|---|---|---|---|
| A | 7366 | 6081 | 10 | 10 | 0.14% | 0.16% | 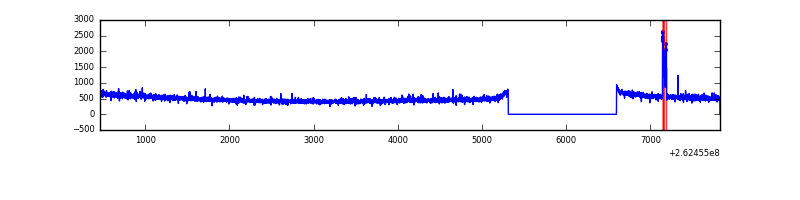 |
| B | 7366 | 6081 | 14 | 14 | 0.19% | 0.23% | 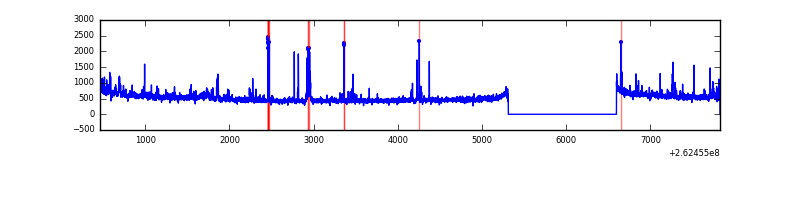 |
| C | 7366 | 6081 | 38 | 38 | 0.52% | 0.62% | 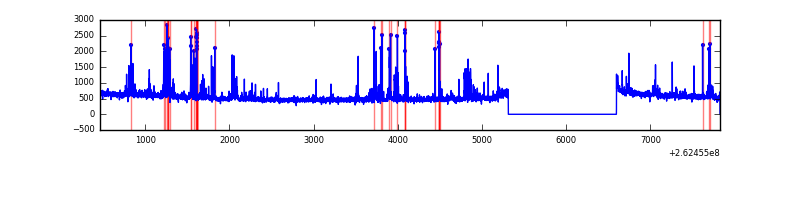 |
| D | 7366 | 6081 | 1183 | 1183 | 16.06% | 19.45% | 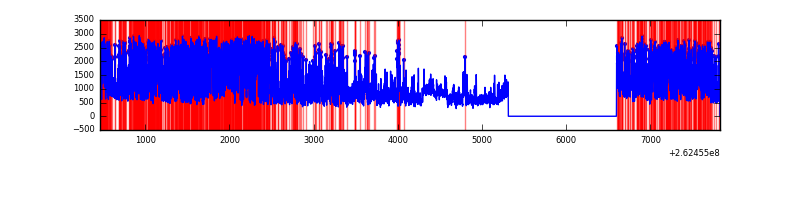 |
Top three noisy pixels from each quadrant. If the there are fewer than three noisy pixels in the level2.evt file, extra rows are filled as -1
| Pixel properties | Quadrant properties | ||||||
|---|---|---|---|---|---|---|---|
| Quadrant | DetID | PixID | Counts | Sigma | Mean | Median | Sigma |
| A | 14 | 111 | 55570 | 357.69 | 763 | 747 | 153.3 |
| A | 1 | 162 | 18991 | 119.03 | 763 | 747 | 153.3 |
| A | 1 | 178 | 6975 | 40.63 | 763 | 747 | 153.3 |
| B | 0 | 230 | 89825 | 624.93 | 770 | 750 | 142.5 |
| B | 0 | 189 | 51724 | 357.62 | 770 | 750 | 142.5 |
| B | 0 | 244 | 32556 | 223.14 | 770 | 750 | 142.5 |
| C | 4 | 254 | 377092 | 2159.91 | 769 | 774 | 174.2 |
| C | 3 | 233 | 163348 | 933.11 | 769 | 774 | 174.2 |
| C | 13 | 61 | 5577 | 27.57 | 769 | 774 | 174.2 |
| D | 1 | 52 | 4643029 | 28016.28 | 708 | 694 | 165.7 |
| D | 12 | 110 | 184015 | 1106.33 | 708 | 694 | 165.7 |
| D | 10 | 157 | 54516 | 324.81 | 708 | 694 | 165.7 |
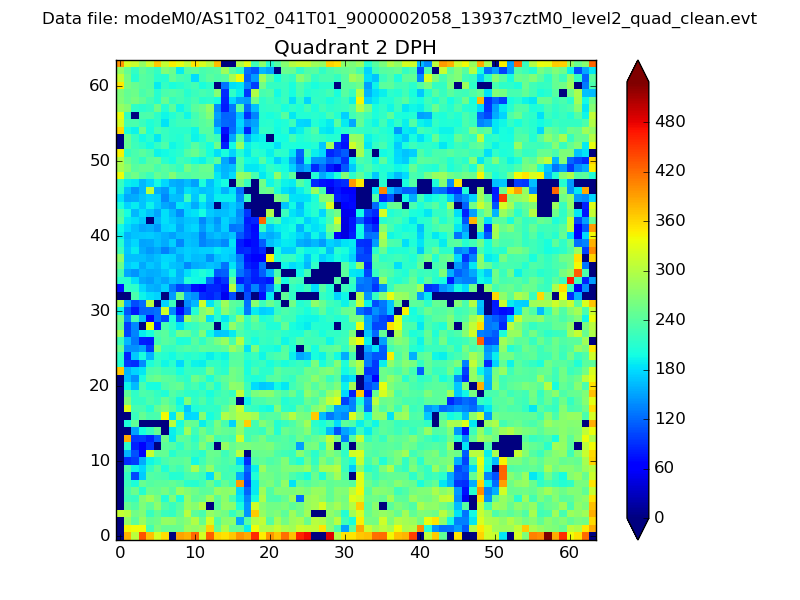
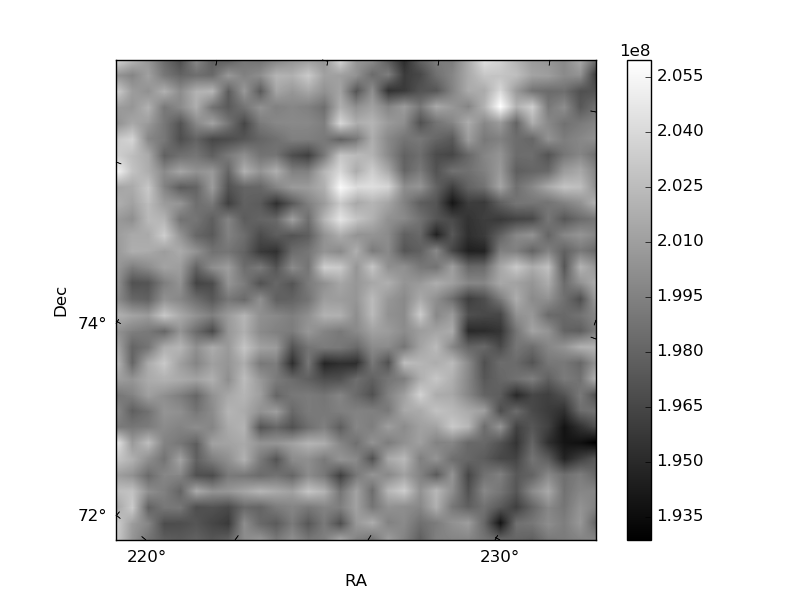
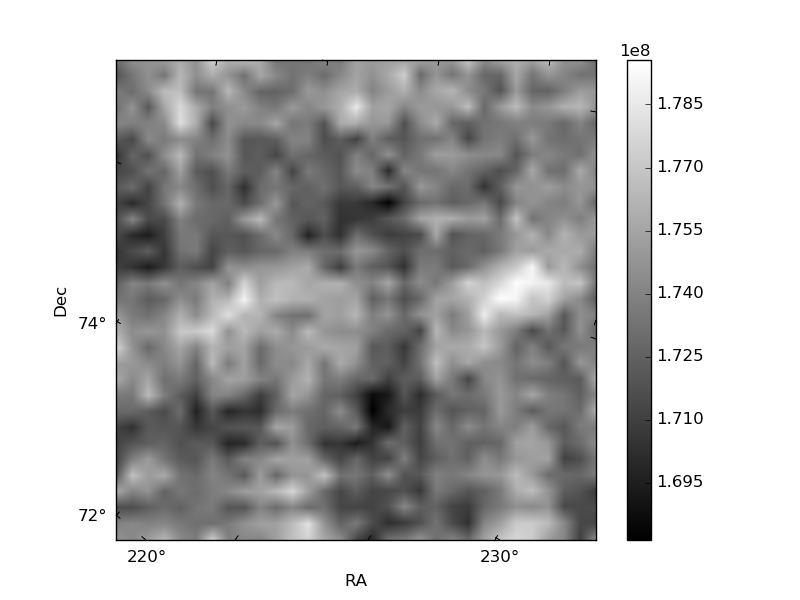
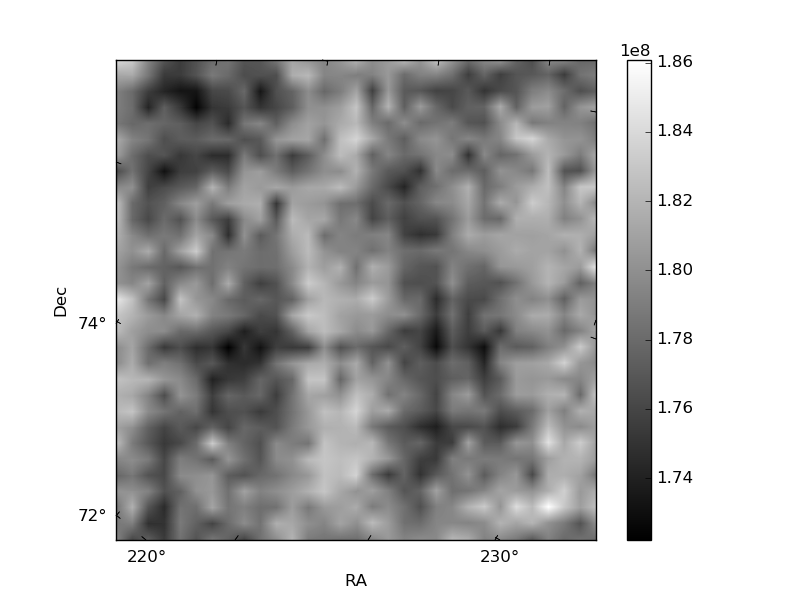
Histogram calculated using DETX and DETY for each event in the final _common_clean file
| Quadrant A | 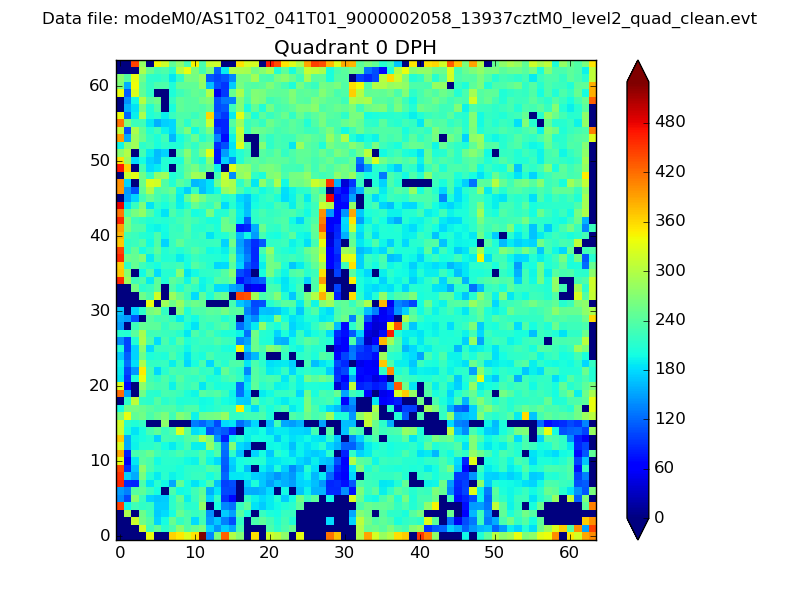 |
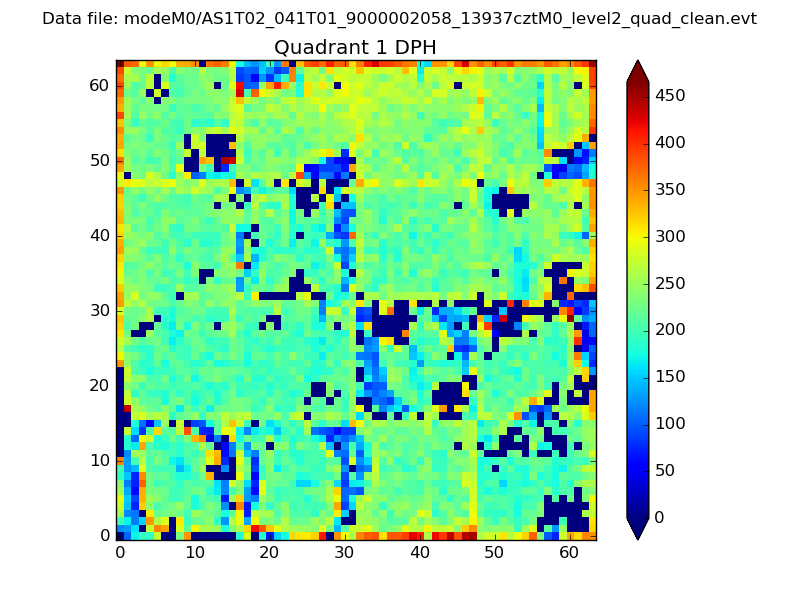 |
Quadrant B |
|---|---|---|---|
| Quadrant D | 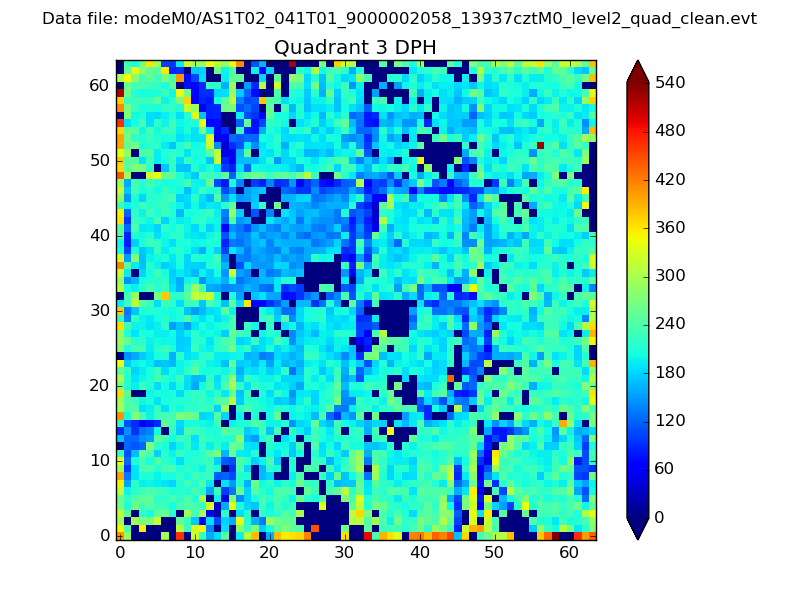 |
 |
Quadrant C |
| Plot type | Count rate plots | Images |
|---|---|---|
| Comparison with Poisson distribution Blue bars denote a histogram of data divided into 1 sec bins. Red curve is a Poisson curve with rate = median count rate of data. |
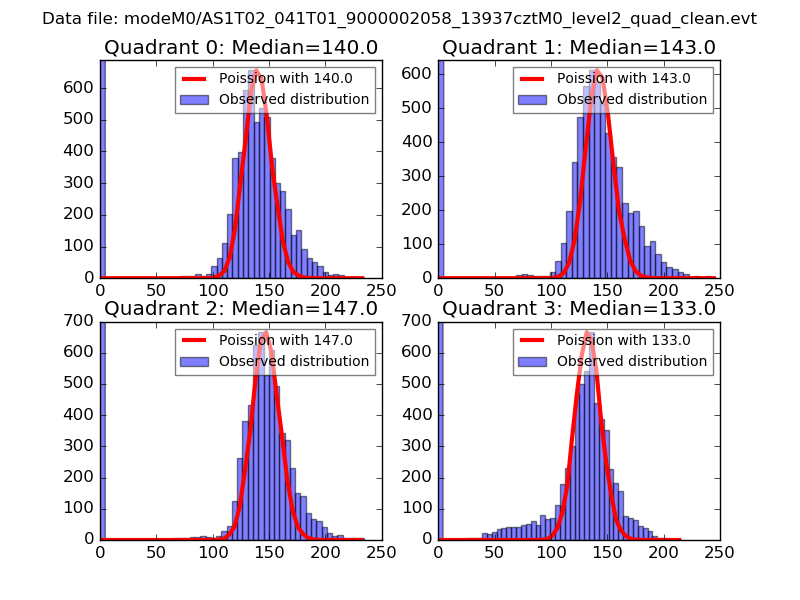 |
 |
| Quadrant-wise count rates Data is divided into 100 sec bins |
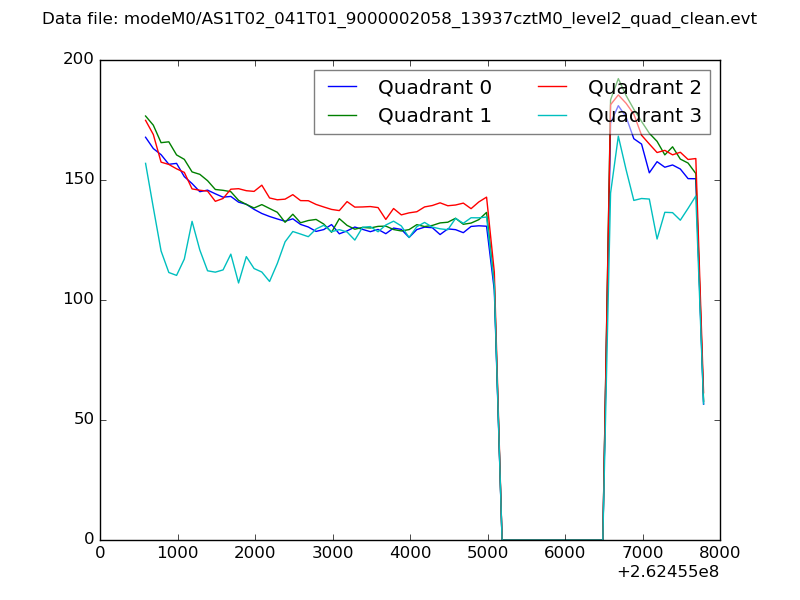 |
|
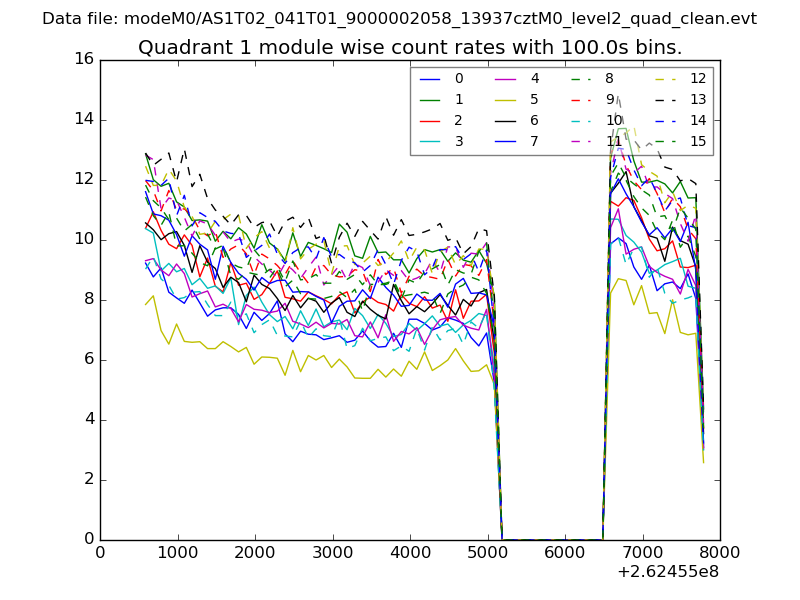
| Module-wise count rates for Quadrant A Data is divided into 100 sec bins |
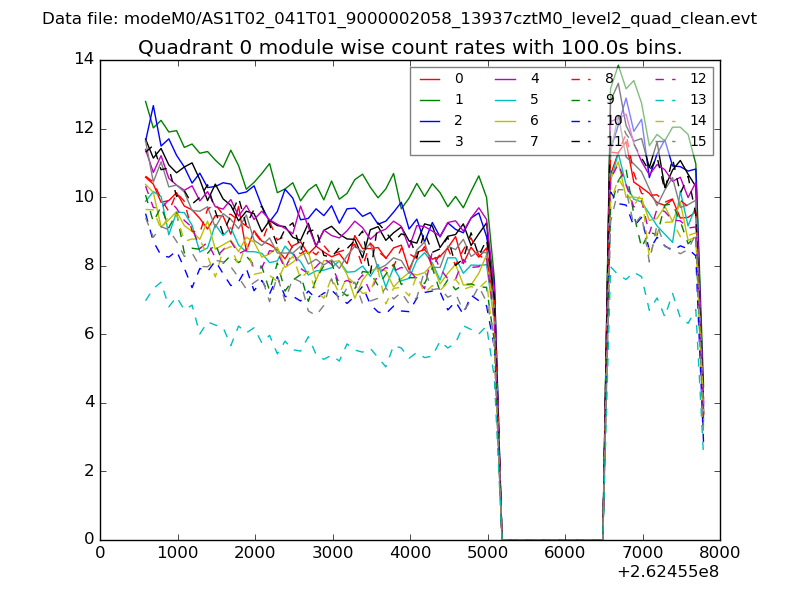 |
 |
| Module-wise count rates for Quadrant B Data is divided into 100 sec bins |
 |
 |
| Module-wise count rates for Quadrant C Data is divided into 100 sec bins |
 |
 |
| Module-wise count rates for Quadrant D Data is divided into 100 sec bins |
 |
 |
| Parameter | Plot |
|---|---|
| CZT HV Monitor | 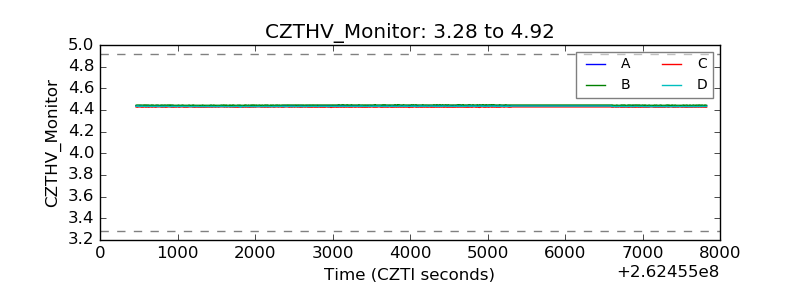 |
| D_VDD | 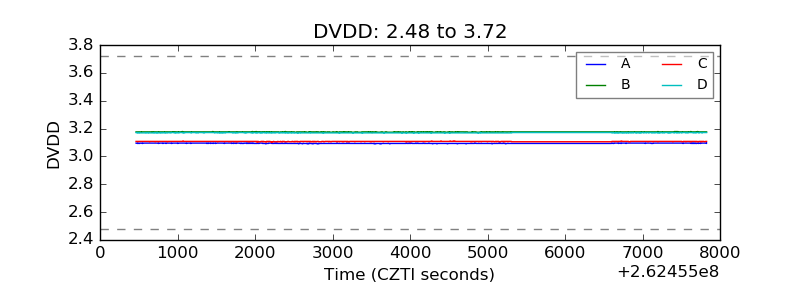 |
| Temperature 1 | 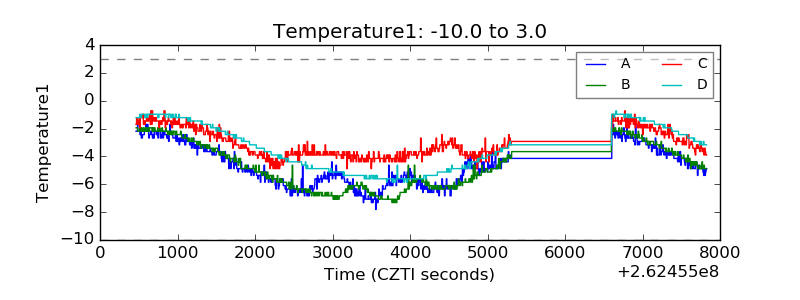 |
| Veto HV Monitor | 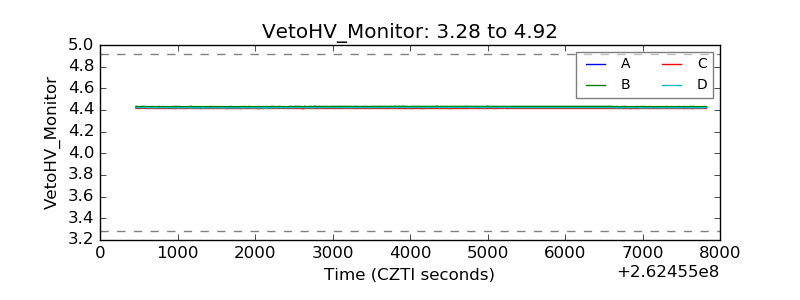 |
| Veto LLD | 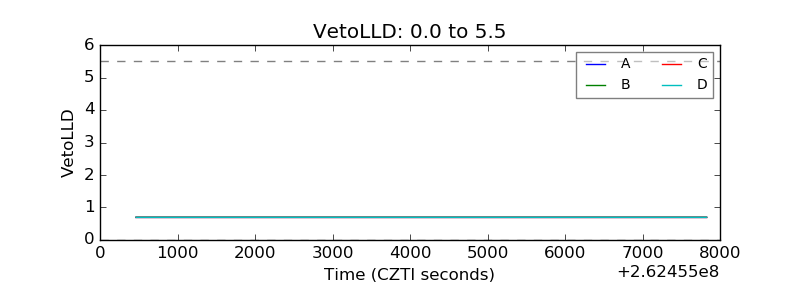 |
| Alpha Counter | 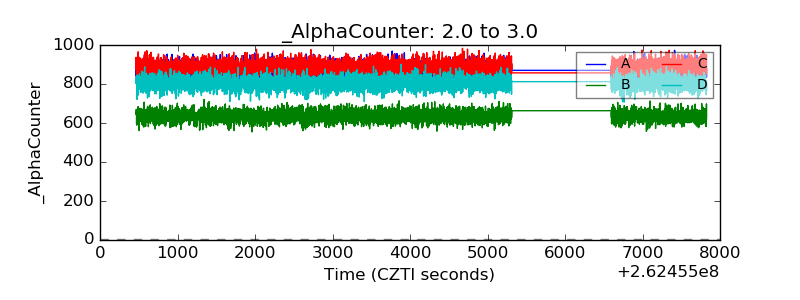 |
| _CPM_Rate | 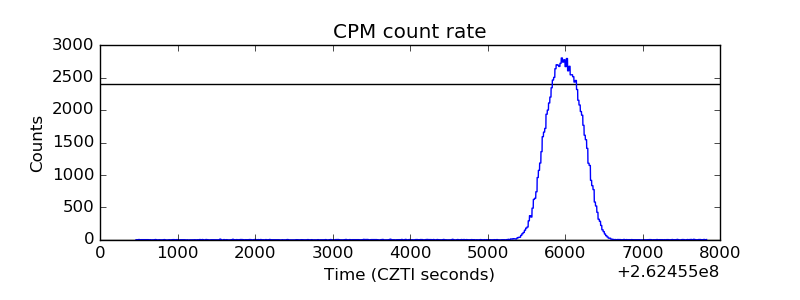 |
| CZT Counter |  |
| +2.5 Volts monitor |  |
| +5 Volts monitor |  |
| _ROLL_ROT |  |
| _Roll_DEC | 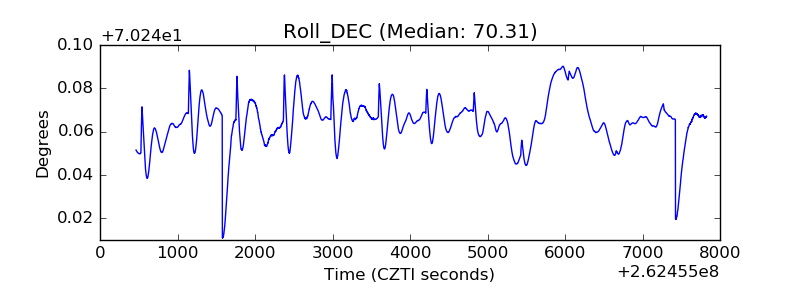 |
| _Roll_RA |  |
| Veto Counter |  |