| Param | Original file | Final file |
|---|---|---|
| Filename | modeM0/AS1T02_041T01_9000002058_13940cztM0_level2.evt | modeM0/AS1T02_041T01_9000002058_13940cztM0_level2_quad_clean.evt |
| Size (bytes) | 600,192,000 | 105,036,480 |
| Size | 572.4 MB | 100.2 MB |
| Events in quadrant A | 2,988,252 | 676,997 |
| Events in quadrant B | 3,981,315 | 687,743 |
| Events in quadrant C | 3,273,299 | 729,481 |
| Events in quadrant D | 7,504,027 | 643,074 |
| Mode M0 | |||
|---|---|---|---|
| Quadrant | BADHDUFLAG | Total packets | Discarded packets |
| A | 0 | 13280 | 3 |
| B | 0 | 16184 | 2 |
| C | 0 | 13767 | 2 |
| D | 0 | 26821 | 2 |
| Mode M9 | |||
|---|---|---|---|
| Quadrant | BADHDUFLAG | Total packets | Discarded packets |
| A | 0 | 21 | 0 |
| B | 0 | 21 | 0 |
| C | 0 | 21 | 0 |
| D | 0 | 22 | 0 |
| Mode SS | |||
|---|---|---|---|
| Quadrant | BADHDUFLAG | Total packets | Discarded packets |
| A | 0 | 130 | 0 |
| B | 0 | 130 | 0 |
| C | 0 | 130 | 0 |
| D | 0 | 130 | 0 |
| Quadrant | Total seconds | Saturated seconds | Saturation percentage |
|---|---|---|---|
| A | 6353 | 20 | 0.314812% |
| B | 6353 | 279 | 4.391626% |
| C | 6353 | 33 | 0.519440% |
| D | 6353 | 701 | 11.034157% |
Noise dominated data is calculated using 1-second bins in cleaned event files. If a bin has >2000 counts, and if more than 50% of those come from <1% of pixels, then it is considered to be noise-dominated and hence unusable.
| Quadrant | # 1 sec bins | Bins with >0 counts | Bins with >2000 counts | High rate bins dominated by noise | Noise dominated (total time) | Noise dominated (detector-on time) | Marked lightcurve |
|---|---|---|---|---|---|---|---|
| A | 7528 | 6354 | 0 | 0 | 0.00% | 0.00% |  |
| B | 7529 | 6355 | 178 | 178 | 2.36% | 2.80% |  |
| C | 7529 | 6355 | 7 | 7 | 0.09% | 0.11% |  |
| D | 7529 | 6354 | 665 | 665 | 8.83% | 10.47% |  |
Top three noisy pixels from each quadrant. If the there are fewer than three noisy pixels in the level2.evt file, extra rows are filled as -1
| Pixel properties | Quadrant properties | ||||||
|---|---|---|---|---|---|---|---|
| Quadrant | DetID | PixID | Counts | Sigma | Mean | Median | Sigma |
| A | 15 | 222 | 69775 | 454.69 | 749 | 733 | 151.8 |
| A | 1 | 162 | 15689 | 98.5 | 749 | 733 | 151.8 |
| A | 15 | 69 | 8390 | 50.43 | 749 | 733 | 151.8 |
| B | 10 | 245 | 635150 | 4549.04 | 751 | 731 | 139.5 |
| B | 3 | 64 | 212712 | 1519.99 | 751 | 731 | 139.5 |
| B | 4 | 142 | 78657 | 558.76 | 751 | 731 | 139.5 |
| C | 3 | 233 | 214983 | 1241.6 | 757 | 760 | 172.5 |
| C | 4 | 254 | 96115 | 552.66 | 757 | 760 | 172.5 |
| C | 14 | 234 | 12458 | 67.8 | 757 | 760 | 172.5 |
| D | 1 | 52 | 3358376 | 19413.83 | 716 | 699 | 173.0 |
| D | 12 | 110 | 1151459 | 6653.6 | 716 | 699 | 173.0 |
| D | 13 | 122 | 79704 | 456.8 | 716 | 699 | 173.0 |
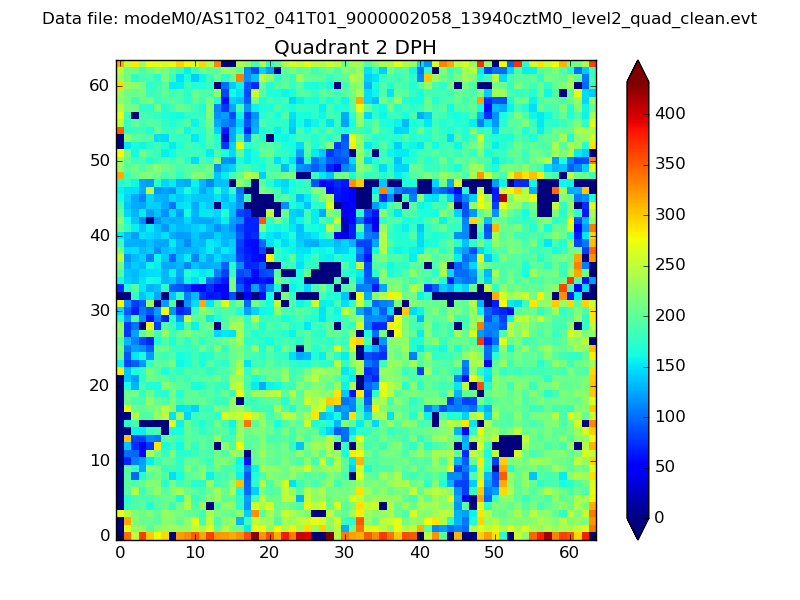
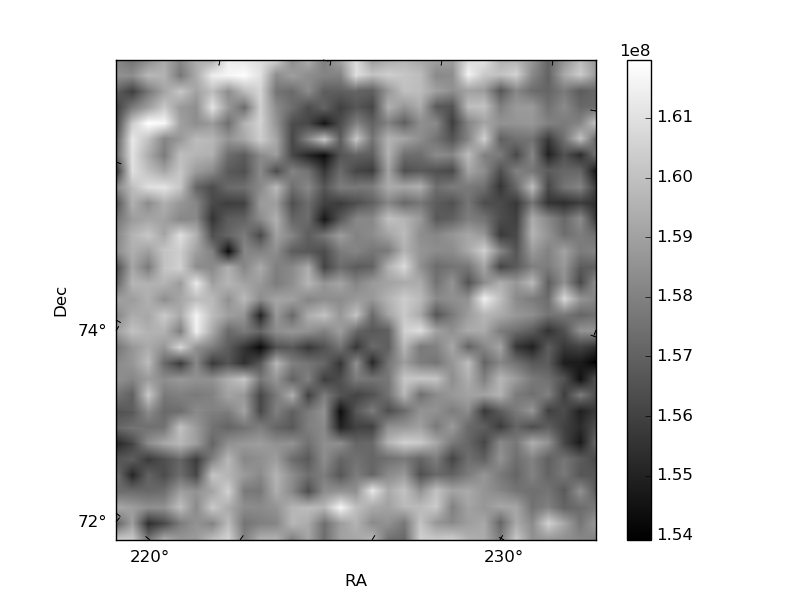
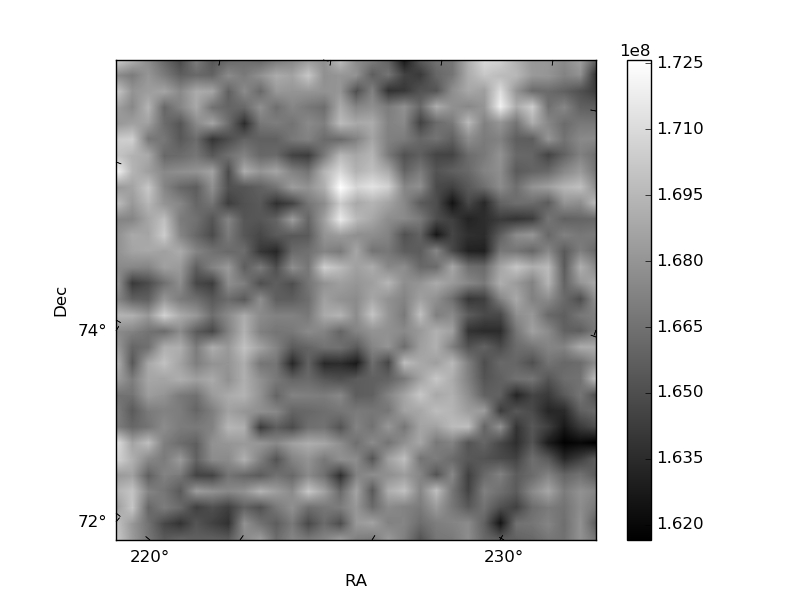
Histogram calculated using DETX and DETY for each event in the final _common_clean file
| Quadrant A | 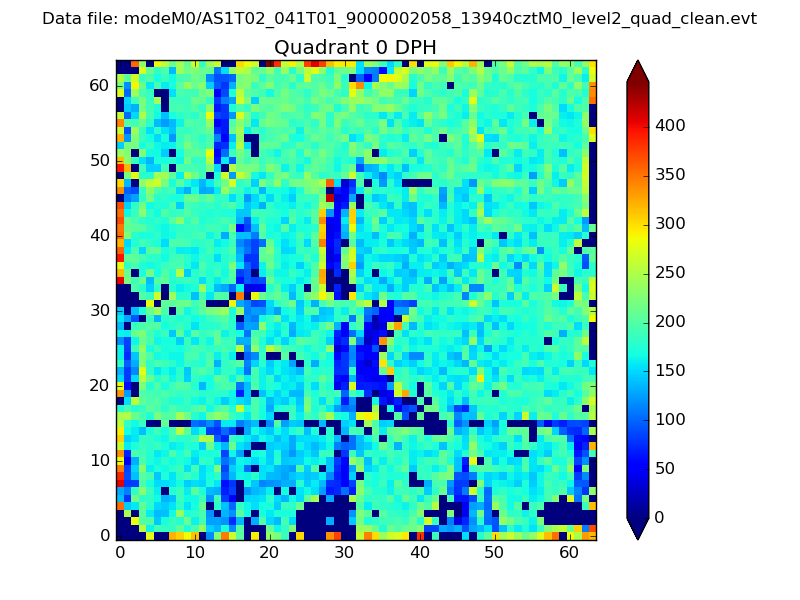 |
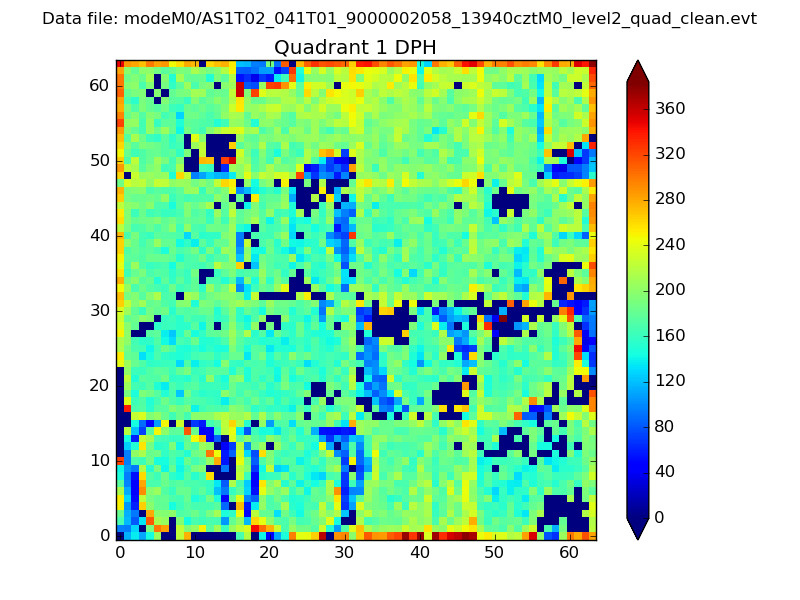 |
Quadrant B |
|---|---|---|---|
| Quadrant D | 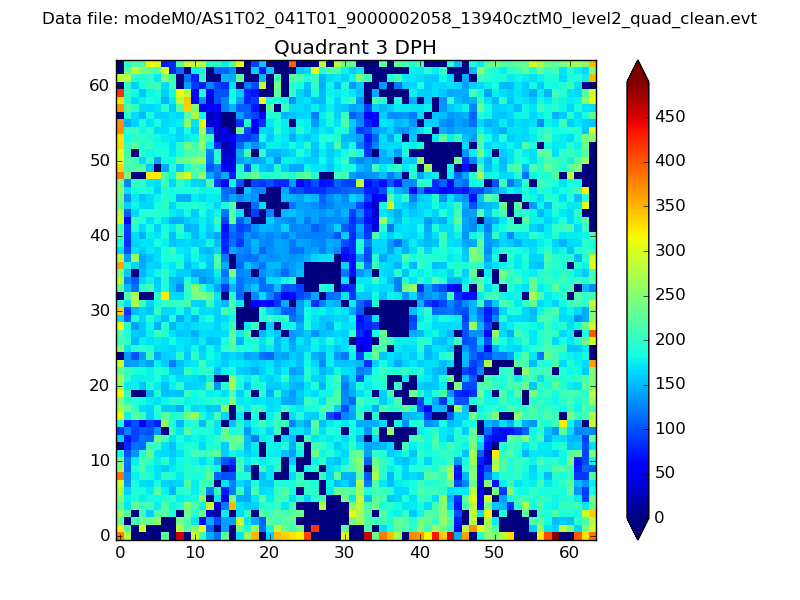 |
 |
Quadrant C |
| Plot type | Count rate plots | Images |
|---|---|---|
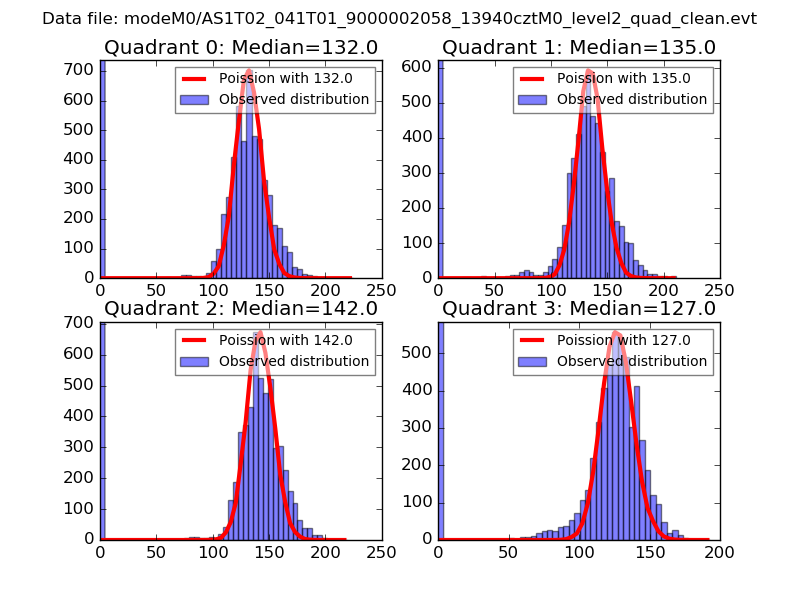
| Comparison with Poisson distribution Blue bars denote a histogram of data divided into 1 sec bins. Red curve is a Poisson curve with rate = median count rate of data. |
 |
 |
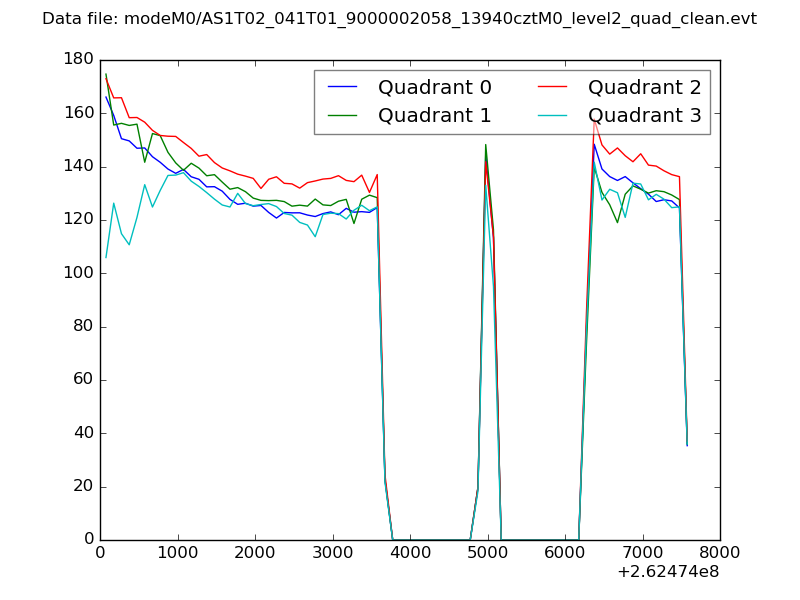
| Quadrant-wise count rates Data is divided into 100 sec bins |
 |
|
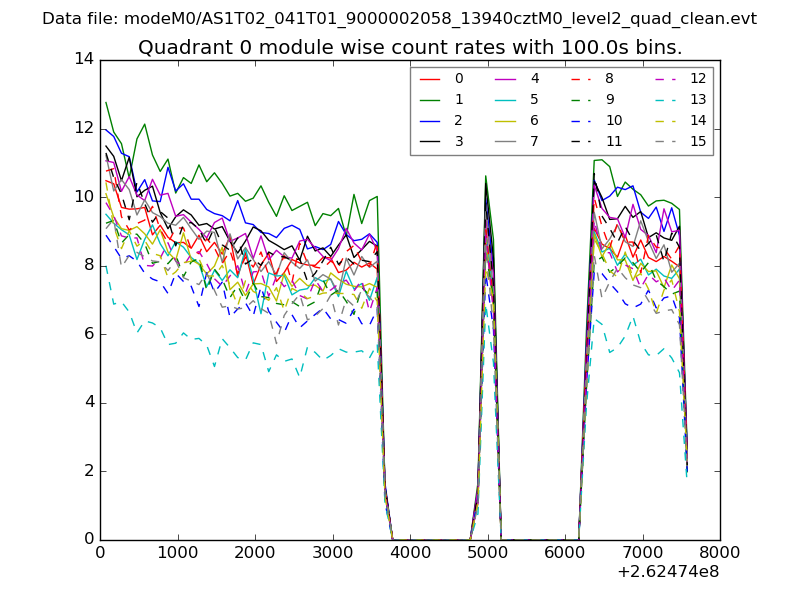
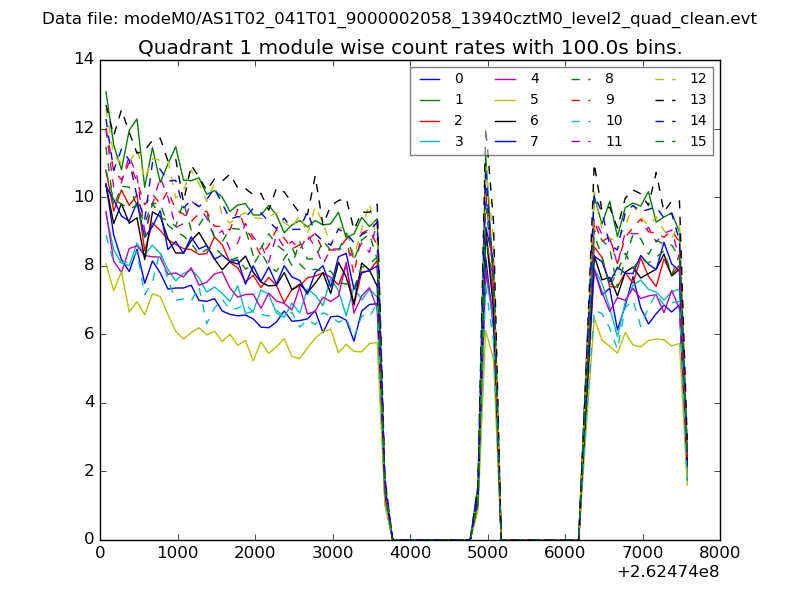
| Module-wise count rates for Quadrant A Data is divided into 100 sec bins |
 |
 |
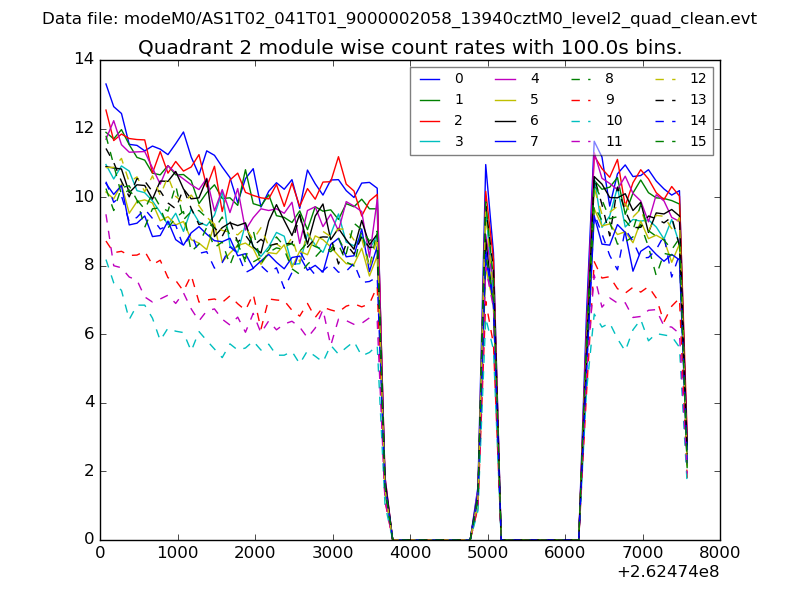
| Module-wise count rates for Quadrant B Data is divided into 100 sec bins |
 |
 |
| Module-wise count rates for Quadrant C Data is divided into 100 sec bins |
 |
 |
| Module-wise count rates for Quadrant D Data is divided into 100 sec bins |
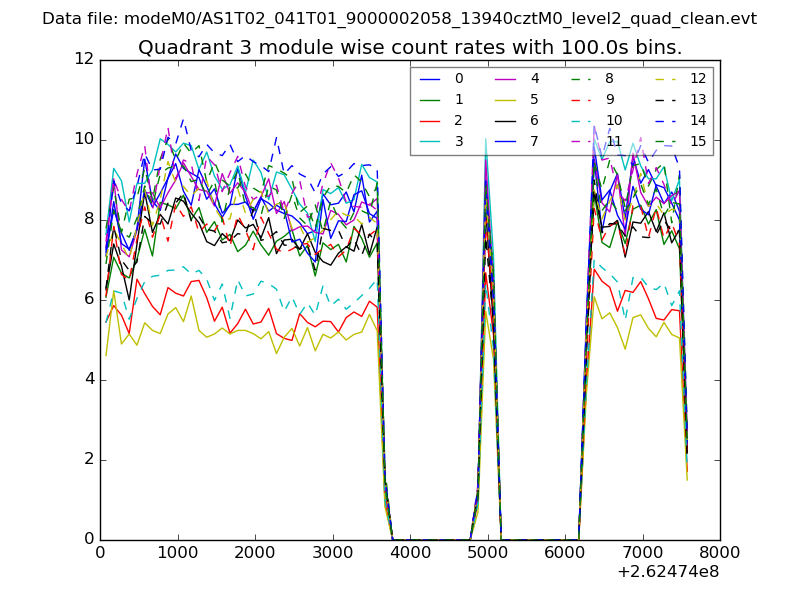 |
 |
| Parameter | Plot |
|---|---|
| CZT HV Monitor | 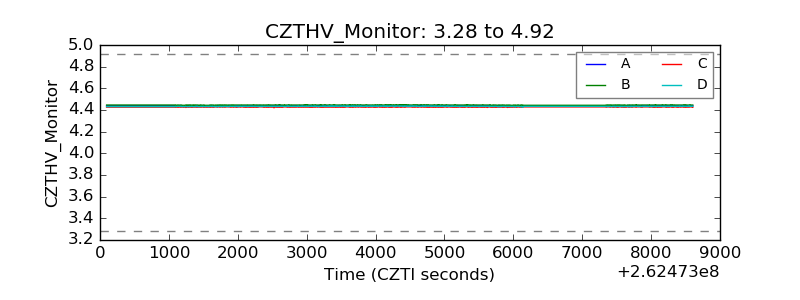 |
| D_VDD | 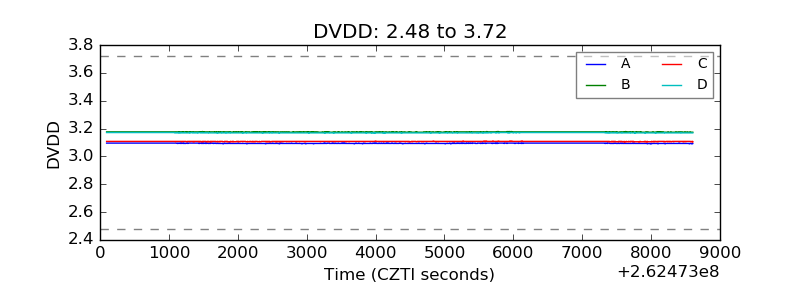 |
| Temperature 1 | 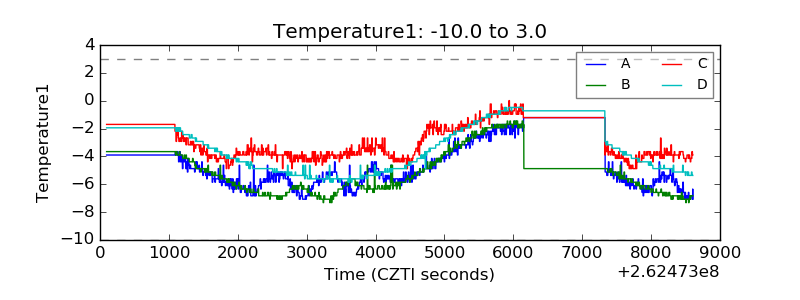 |
| Veto HV Monitor | 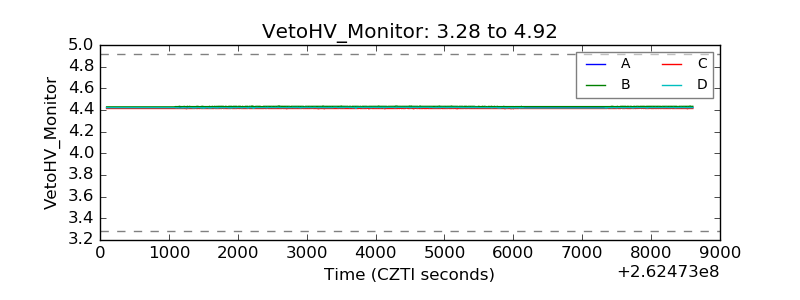 |
| Veto LLD | 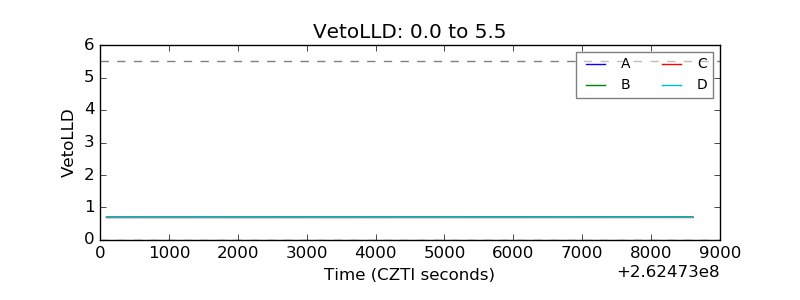 |
| Alpha Counter | 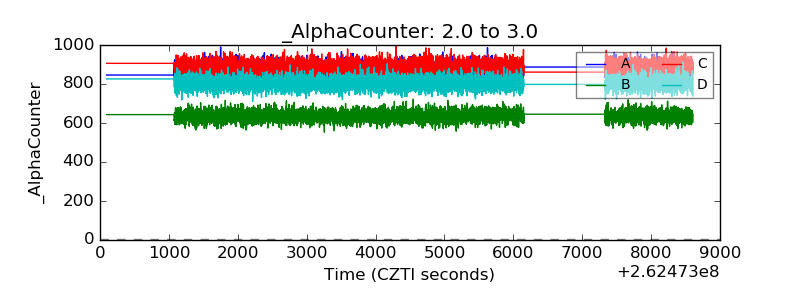 |
| _CPM_Rate | 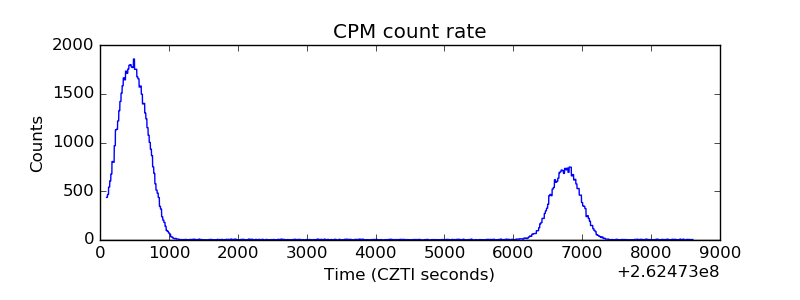 |
| CZT Counter | 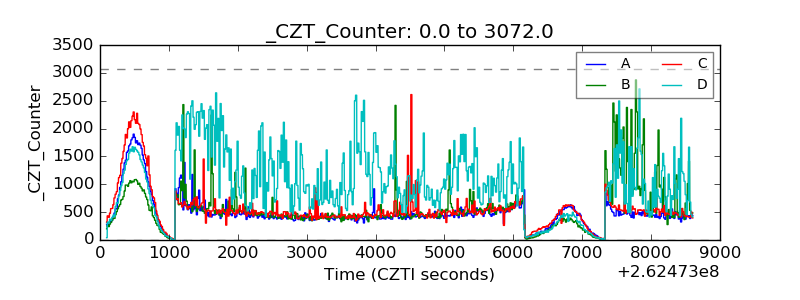 |
| +2.5 Volts monitor | 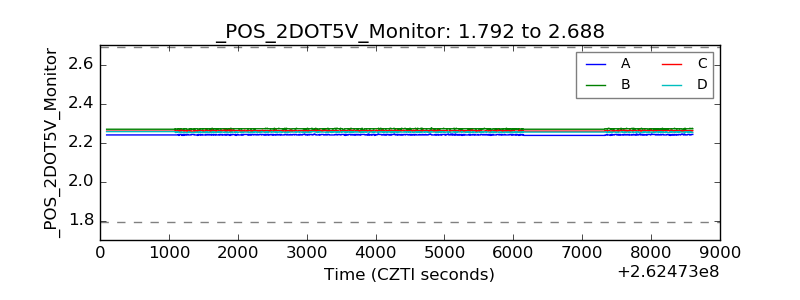 |
| +5 Volts monitor | 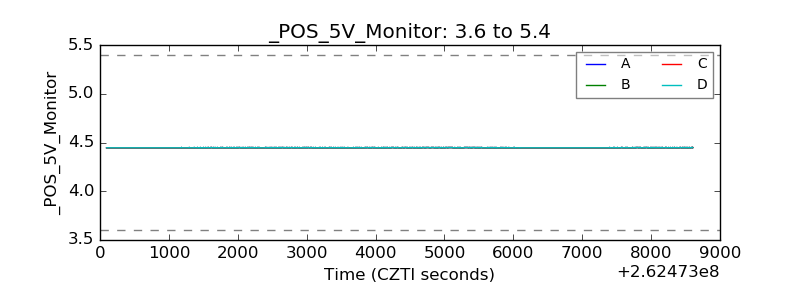 |
| _ROLL_ROT | 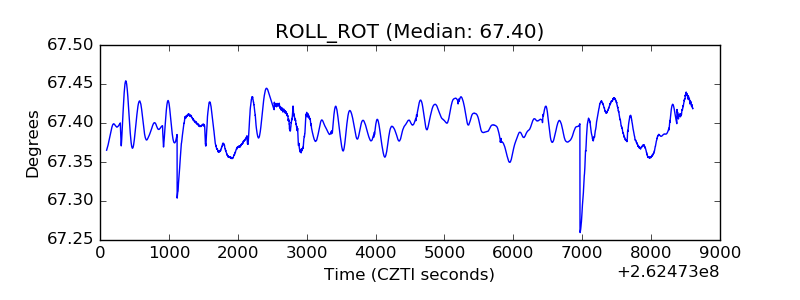 |
| _Roll_DEC | 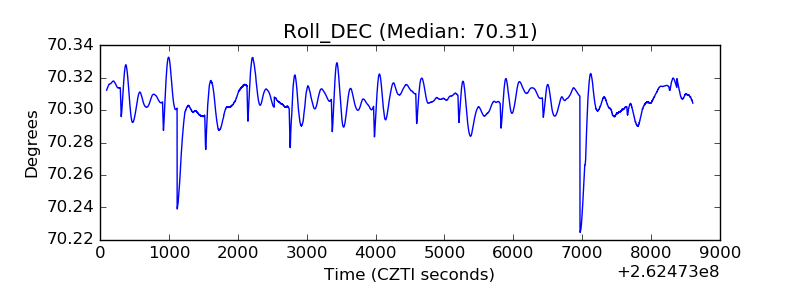 |
| _Roll_RA | 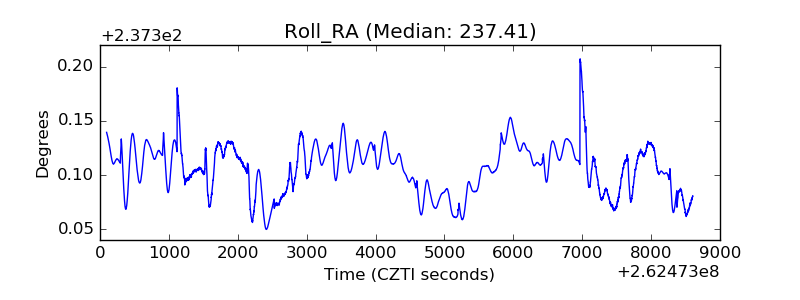 |
| Veto Counter | 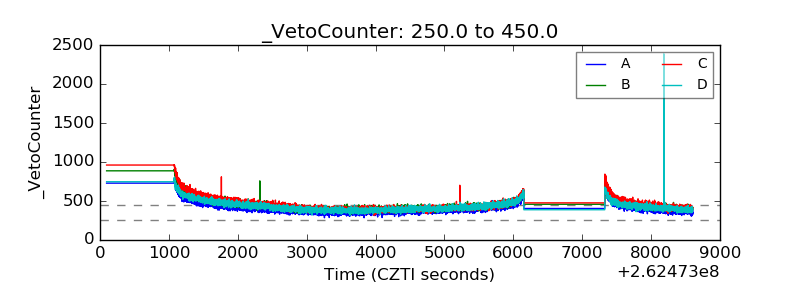 |