| Param | Original file | Final file |
|---|---|---|
| Filename | modeM0/AS1T02_041T01_9000002058_13941cztM0_level2.evt | modeM0/AS1T02_041T01_9000002058_13941cztM0_level2_quad_clean.evt |
| Size (bytes) | 606,591,360 | 107,781,120 |
| Size | 578.5 MB | 102.8 MB |
| Events in quadrant A | 3,032,286 | 695,053 |
| Events in quadrant B | 4,843,498 | 696,903 |
| Events in quadrant C | 3,416,609 | 741,037 |
| Events in quadrant D | 6,621,505 | 660,352 |
| Mode M0 | |||
|---|---|---|---|
| Quadrant | BADHDUFLAG | Total packets | Discarded packets |
| A | 0 | 13822 | 3 |
| B | 0 | 19052 | 2 |
| C | 0 | 14657 | 2 |
| D | 0 | 24366 | 2 |
| Mode M9 | |||
|---|---|---|---|
| Quadrant | BADHDUFLAG | Total packets | Discarded packets |
| A | 0 | 14 | 0 |
| B | 0 | 14 | 0 |
| C | 0 | 14 | 0 |
| D | 0 | 15 | 0 |
| Mode SS | |||
|---|---|---|---|
| Quadrant | BADHDUFLAG | Total packets | Discarded packets |
| A | 0 | 138 | 0 |
| B | 0 | 138 | 0 |
| C | 0 | 138 | 0 |
| D | 0 | 138 | 0 |
| Quadrant | Total seconds | Saturated seconds | Saturation percentage |
|---|---|---|---|
| A | 6745 | 16 | 0.237213% |
| B | 6745 | 356 | 5.277984% |
| C | 6745 | 46 | 0.681987% |
| D | 6745 | 735 | 10.896961% |
Noise dominated data is calculated using 1-second bins in cleaned event files. If a bin has >2000 counts, and if more than 50% of those come from <1% of pixels, then it is considered to be noise-dominated and hence unusable.
| Quadrant | # 1 sec bins | Bins with >0 counts | Bins with >2000 counts | High rate bins dominated by noise | Noise dominated (total time) | Noise dominated (detector-on time) | Marked lightcurve |
|---|---|---|---|---|---|---|---|
| A | 7586 | 6747 | 0 | 0 | 0.00% | 0.00% | 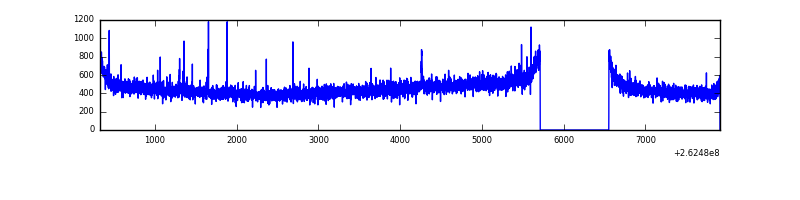 |
| B | 7585 | 6746 | 180 | 180 | 2.37% | 2.67% | 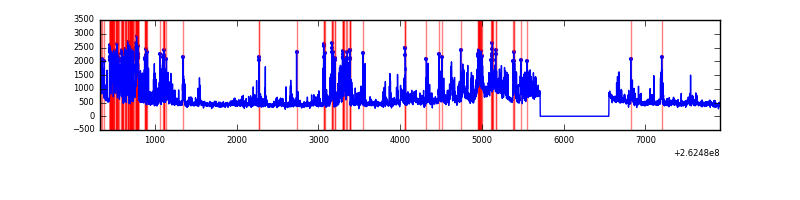 |
| C | 7586 | 6746 | 8 | 8 | 0.11% | 0.12% | 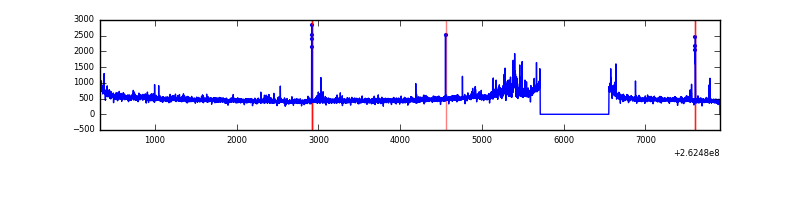 |
| D | 7586 | 6746 | 586 | 586 | 7.72% | 8.69% | 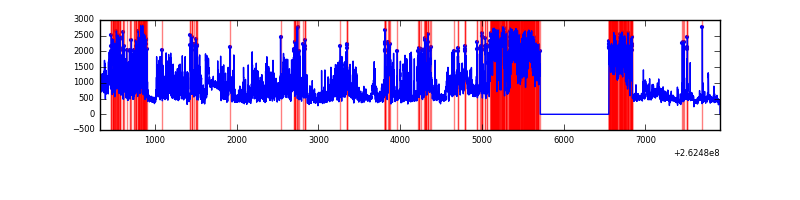 |
Top three noisy pixels from each quadrant. If the there are fewer than three noisy pixels in the level2.evt file, extra rows are filled as -1
| Pixel properties | Quadrant properties | ||||||
|---|---|---|---|---|---|---|---|
| Quadrant | DetID | PixID | Counts | Sigma | Mean | Median | Sigma |
| A | 1 | 162 | 16631 | 100.92 | 776 | 762 | 157.2 |
| A | 0 | 226 | 6754 | 38.11 | 776 | 762 | 157.2 |
| A | 15 | 69 | 6204 | 34.61 | 776 | 762 | 157.2 |
| B | 10 | 245 | 1433757 | 9793.84 | 774 | 753 | 146.3 |
| B | 0 | 189 | 218682 | 1489.43 | 774 | 753 | 146.3 |
| B | 0 | 230 | 39451 | 264.48 | 774 | 753 | 146.3 |
| C | 3 | 233 | 250378 | 1397.29 | 778 | 782 | 178.6 |
| C | 4 | 254 | 130184 | 724.42 | 778 | 782 | 178.6 |
| C | 13 | 61 | 5652 | 27.26 | 778 | 782 | 178.6 |
| D | 1 | 52 | 3089510 | 17525.32 | 730 | 714 | 176.2 |
| D | 12 | 110 | 198260 | 1120.84 | 730 | 714 | 176.2 |
| D | 13 | 104 | 182904 | 1033.72 | 730 | 714 | 176.2 |
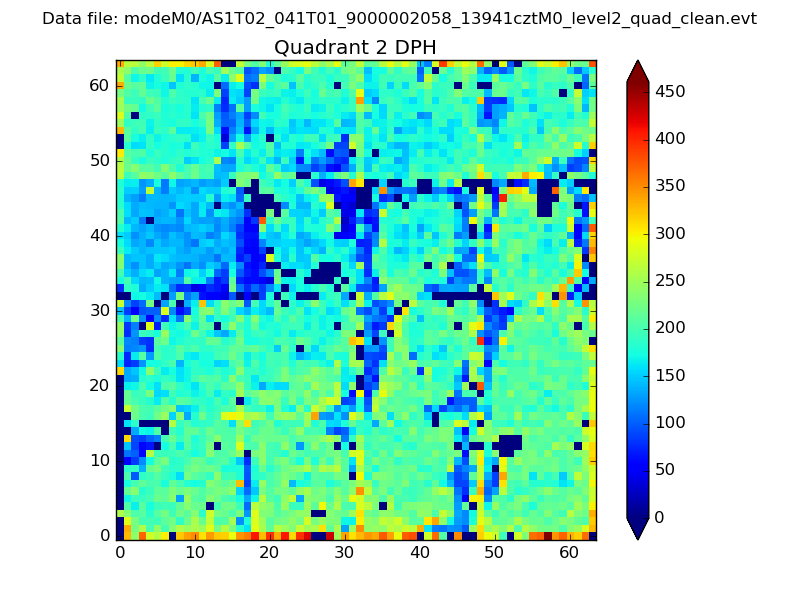
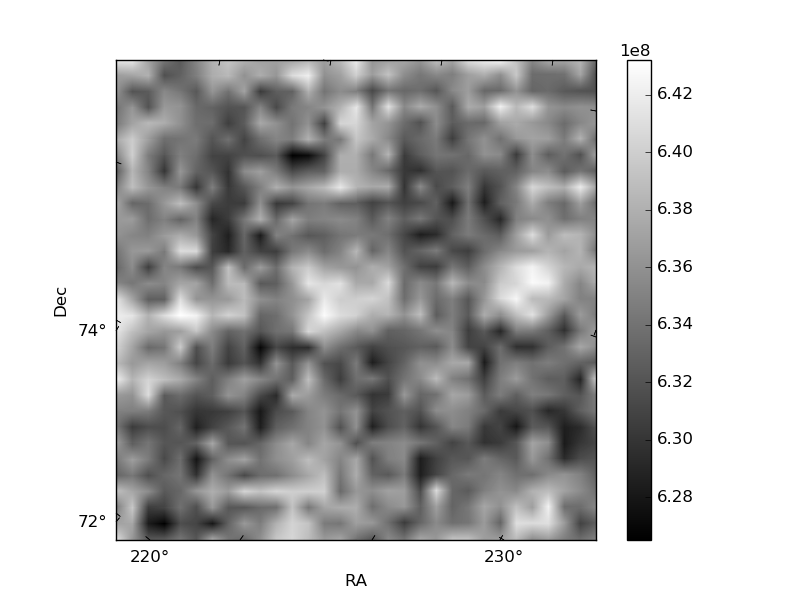
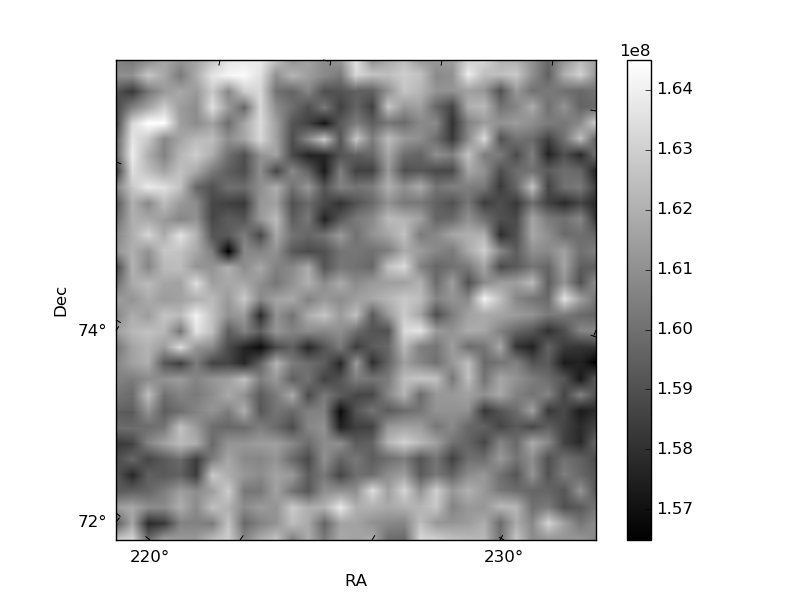
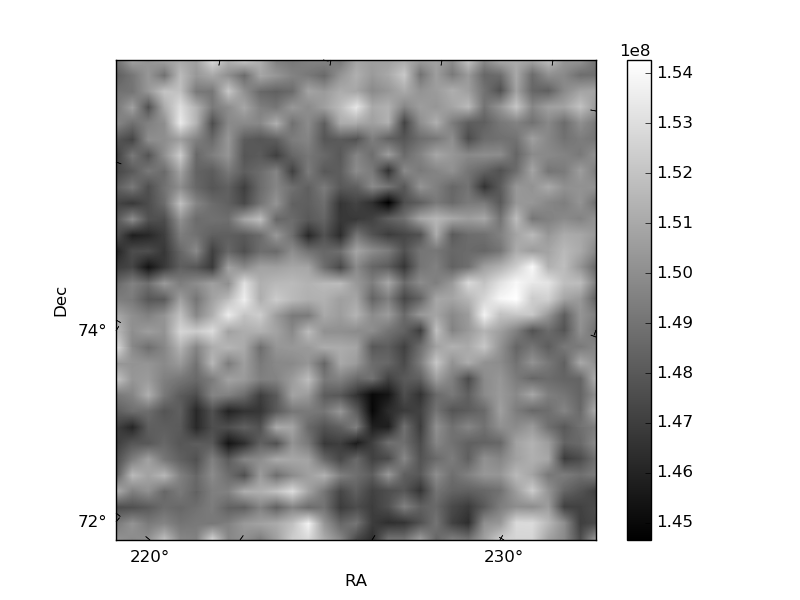
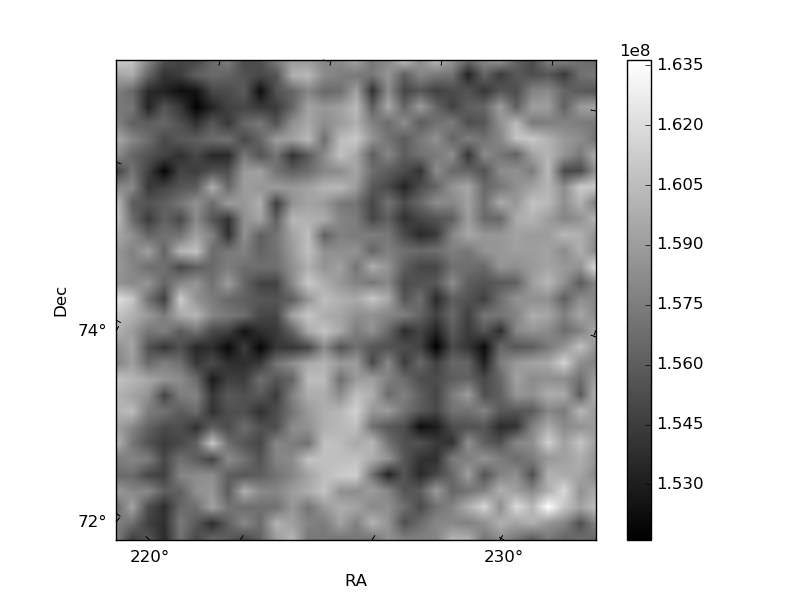
Histogram calculated using DETX and DETY for each event in the final _common_clean file
| Quadrant A | 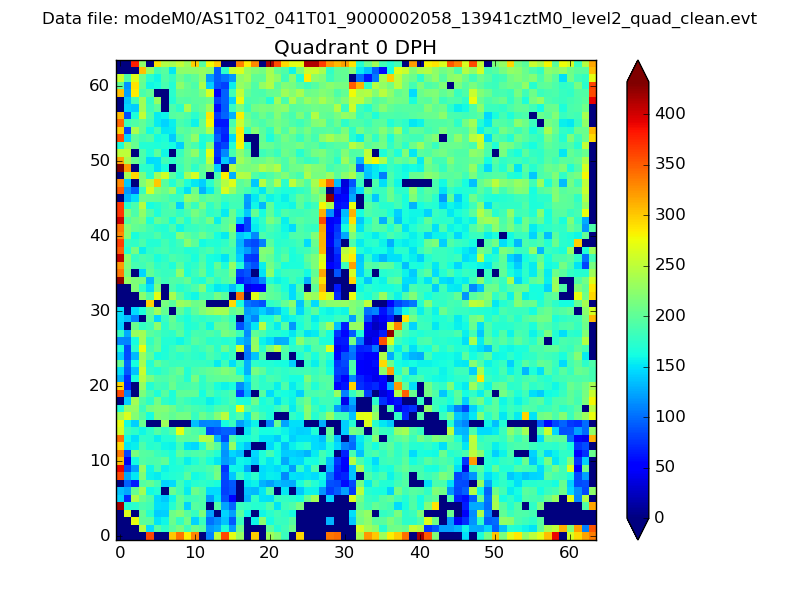 |
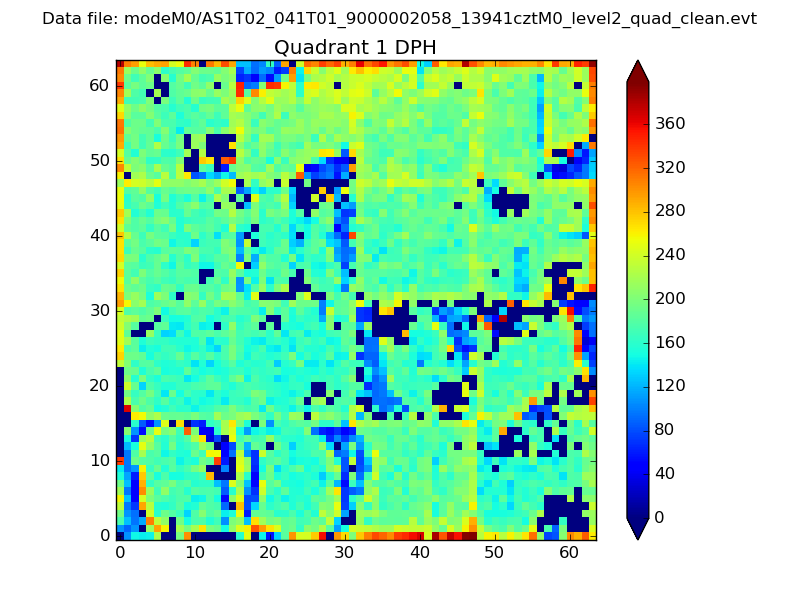 |
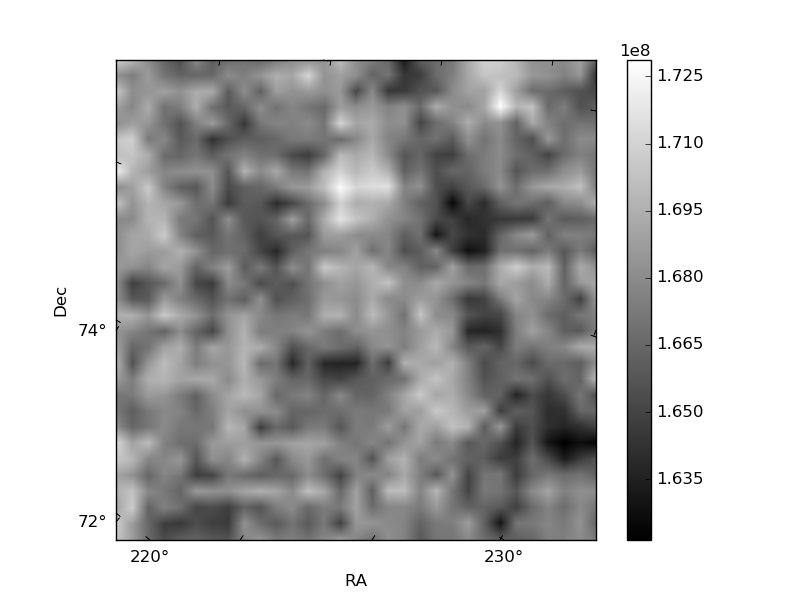
Quadrant B |
|---|---|---|---|
| Quadrant D | 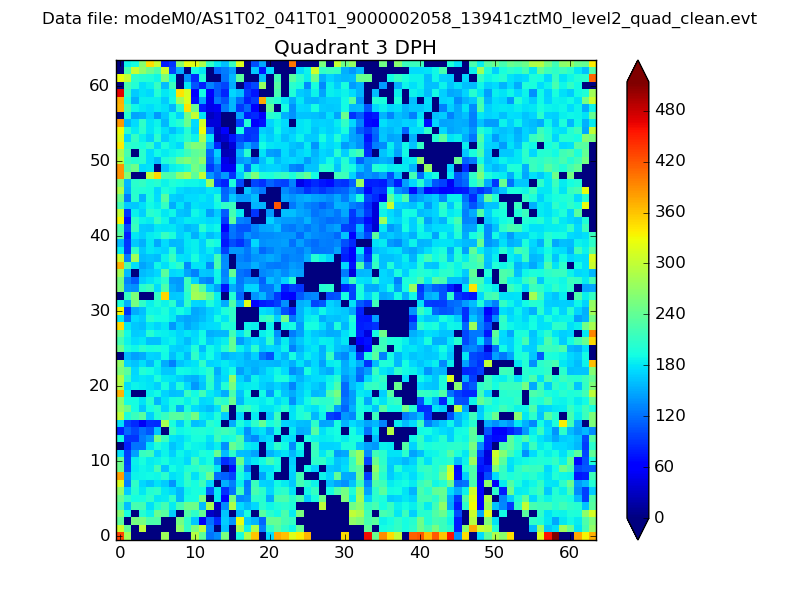 |
 |
Quadrant C |
| Plot type | Count rate plots | Images |
|---|---|---|
| Comparison with Poisson distribution Blue bars denote a histogram of data divided into 1 sec bins. Red curve is a Poisson curve with rate = median count rate of data. |
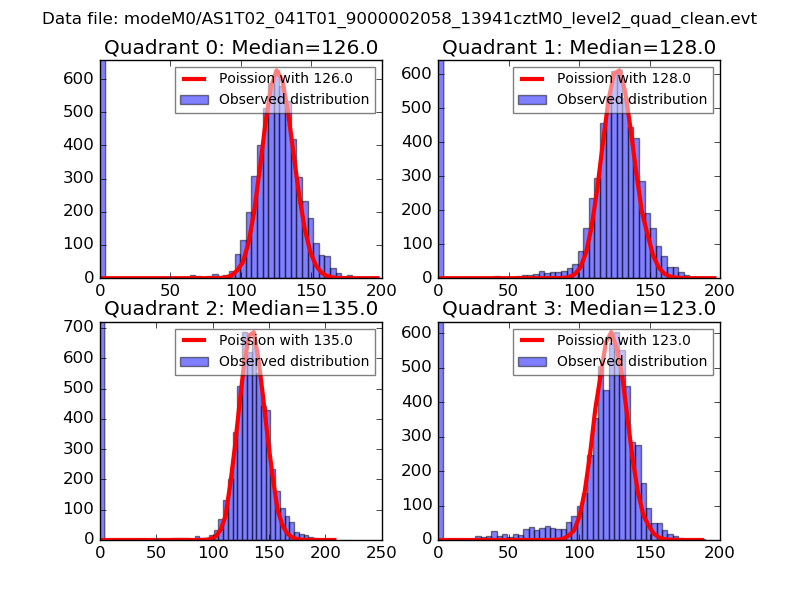 |
 |
| Quadrant-wise count rates Data is divided into 100 sec bins |
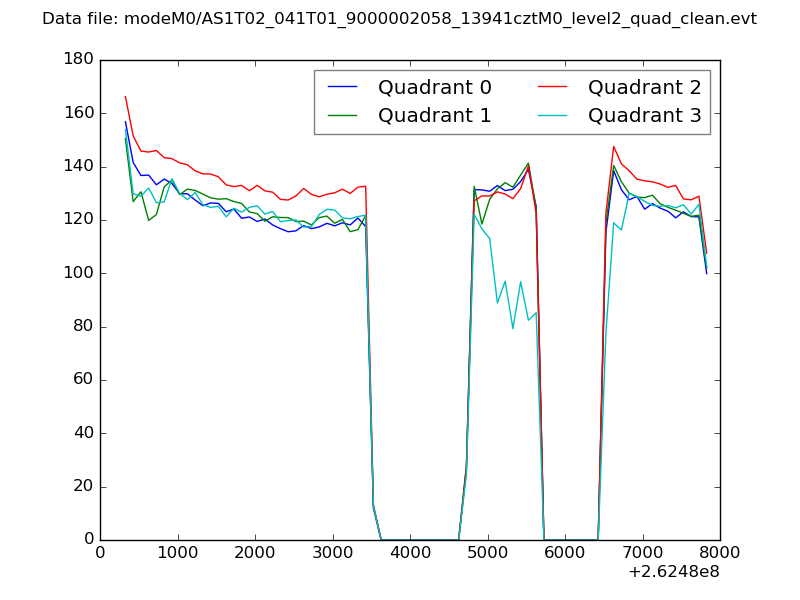 |
|
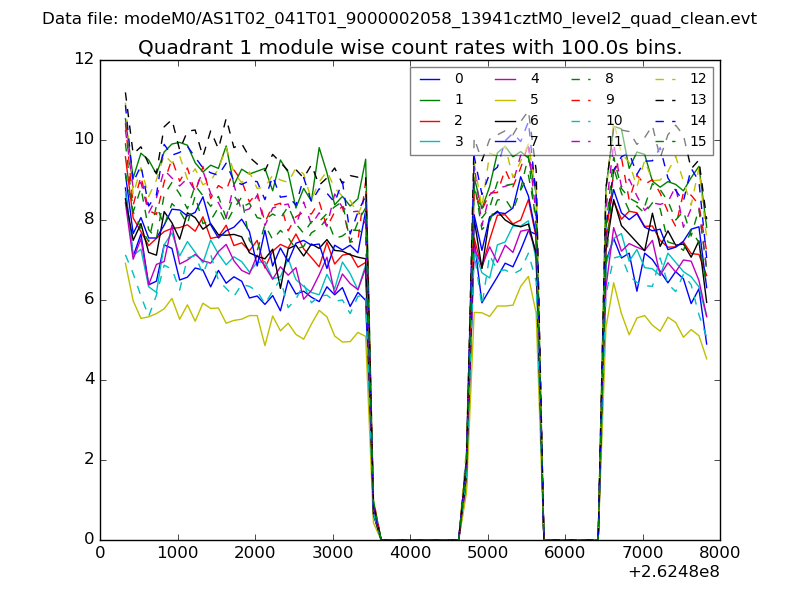
| Module-wise count rates for Quadrant A Data is divided into 100 sec bins |
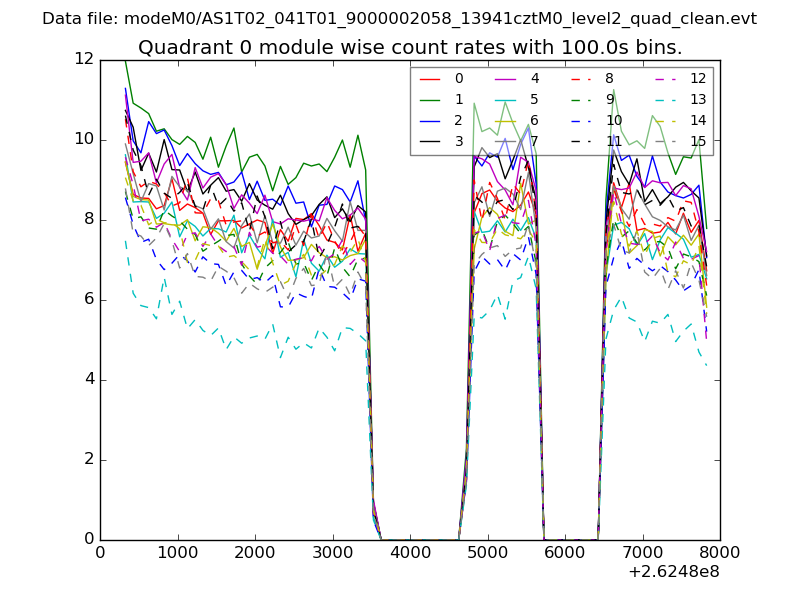 |
 |
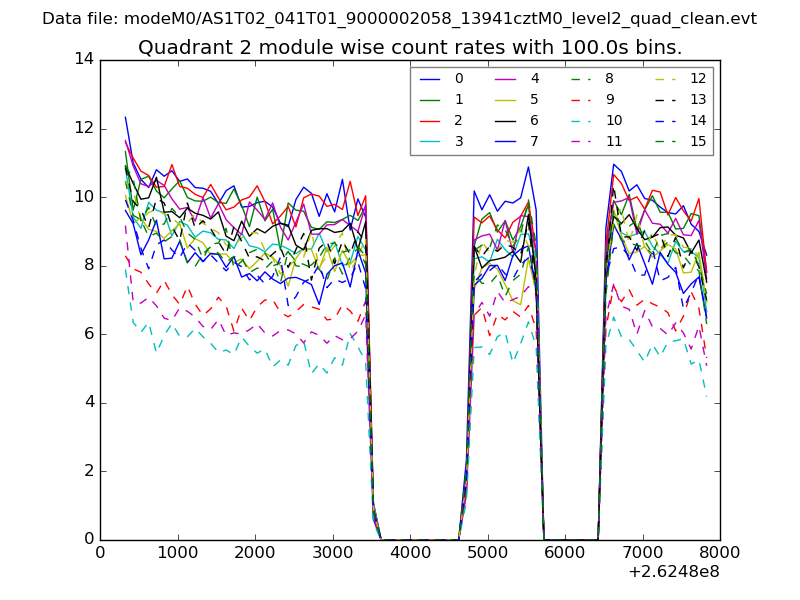
| Module-wise count rates for Quadrant B Data is divided into 100 sec bins |
 |
 |
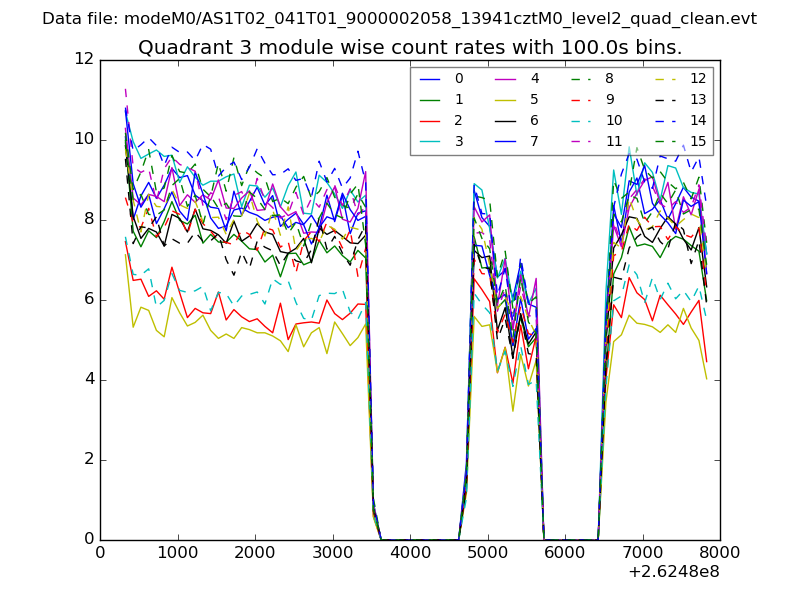
| Module-wise count rates for Quadrant C Data is divided into 100 sec bins |
 |
 |
| Module-wise count rates for Quadrant D Data is divided into 100 sec bins |
 |
 |
| Parameter | Plot |
|---|---|
| CZT HV Monitor | 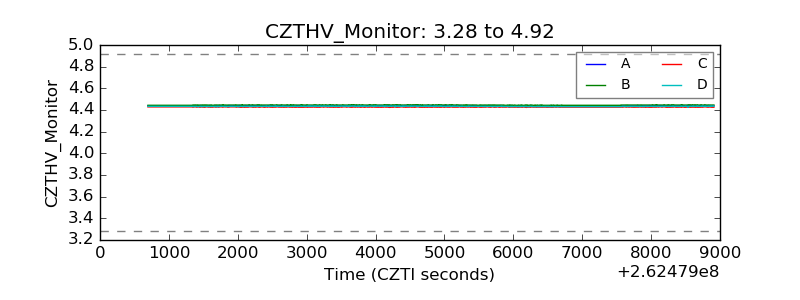 |
| D_VDD | 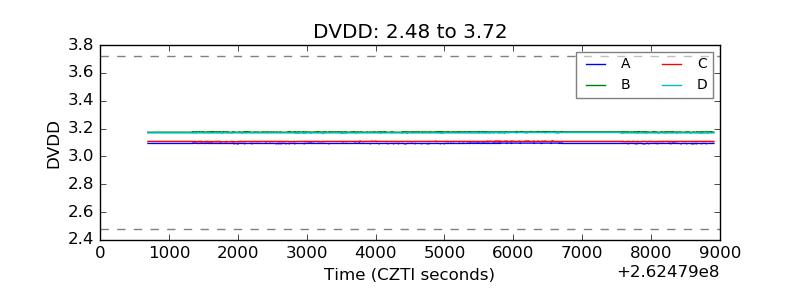 |
| Temperature 1 | 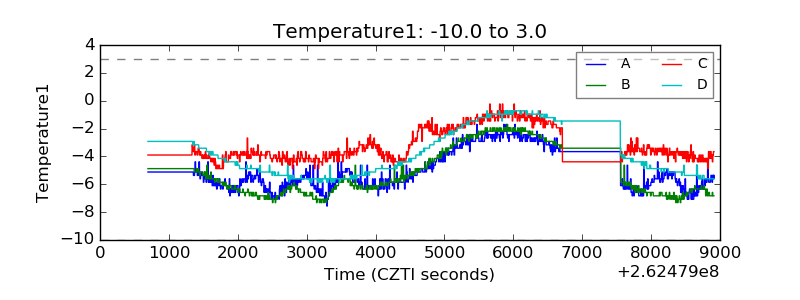 |
| Veto HV Monitor | 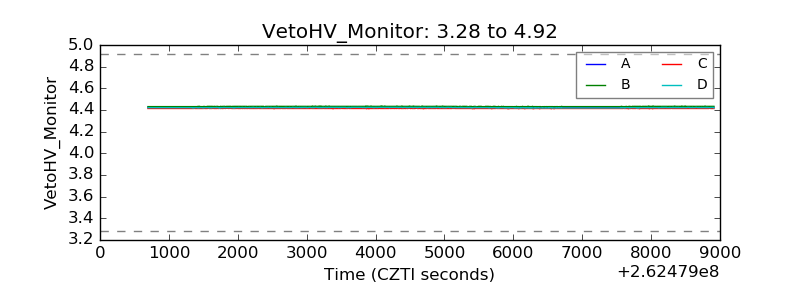 |
| Veto LLD | 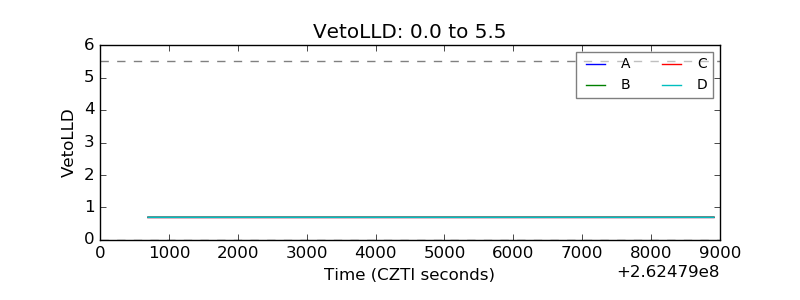 |
| Alpha Counter | 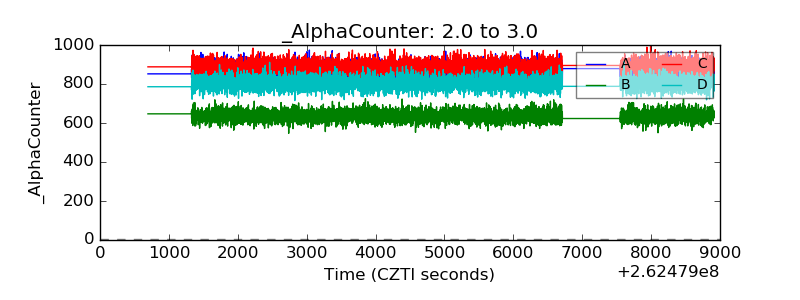 |
| _CPM_Rate | 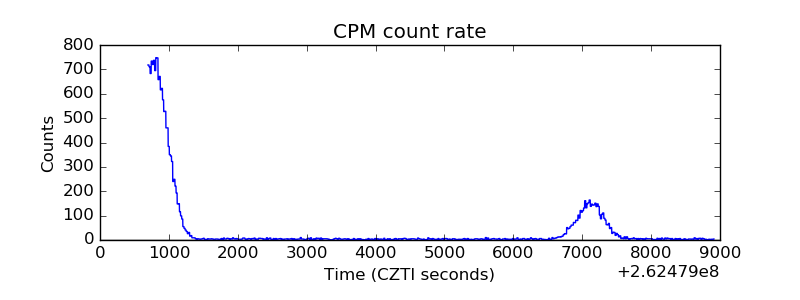 |
| CZT Counter | 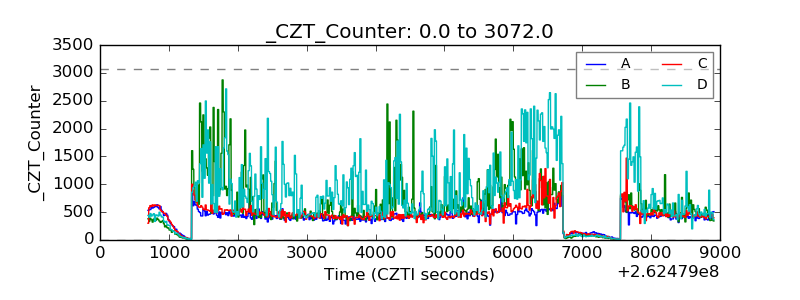 |
| +2.5 Volts monitor | 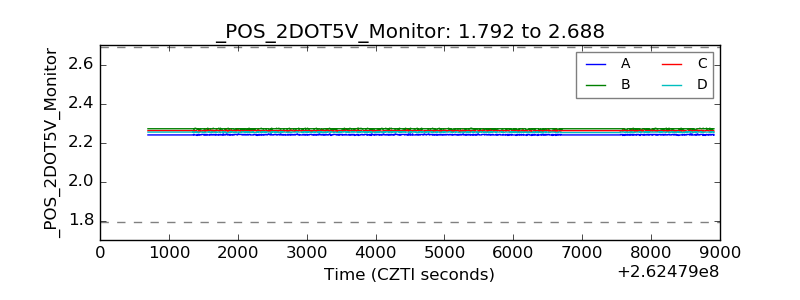 |
| +5 Volts monitor | 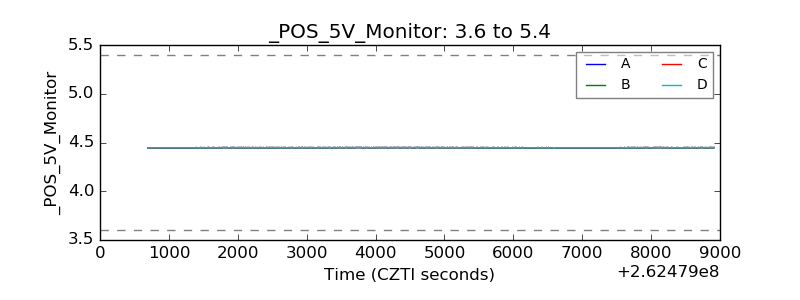 |
| _ROLL_ROT | 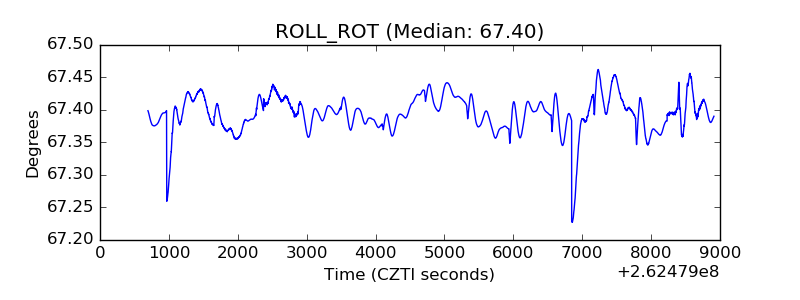 |
| _Roll_DEC | 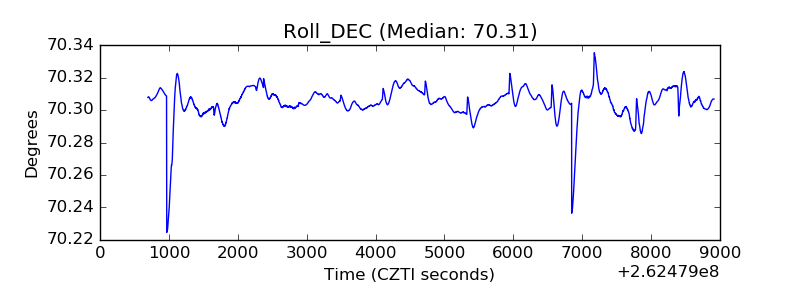 |
| _Roll_RA | 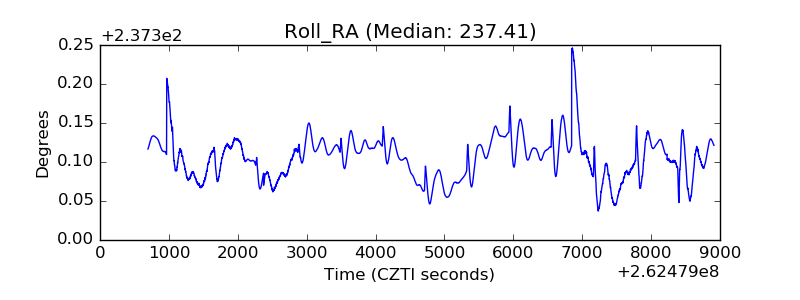 |
| Veto Counter | 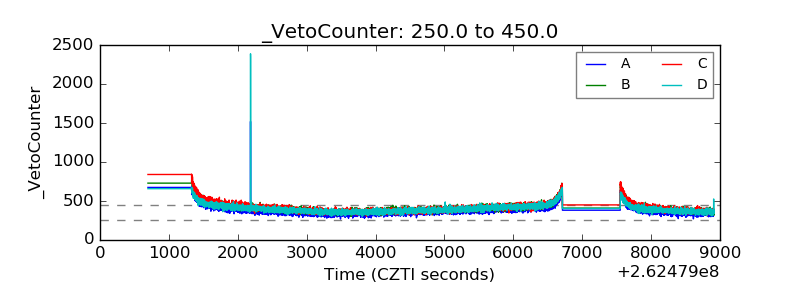 |