| Param | Original file | Final file |
|---|---|---|
| Filename | modeM0/AS1T02_041T01_9000002058_13942cztM0_level2.evt | modeM0/AS1T02_041T01_9000002058_13942cztM0_level2_quad_clean.evt |
| Size (bytes) | 612,339,840 | 125,530,560 |
| Size | 584.0 MB | 119.7 MB |
| Events in quadrant A | 3,526,690 | 812,767 |
| Events in quadrant B | 4,762,702 | 809,443 |
| Events in quadrant C | 3,939,989 | 857,835 |
| Events in quadrant D | 5,788,606 | 781,210 |
| Mode M0 | |||
|---|---|---|---|
| Quadrant | BADHDUFLAG | Total packets | Discarded packets |
| A | 0 | 16014 | 3 |
| B | 0 | 19360 | 2 |
| C | 0 | 16985 | 2 |
| D | 0 | 22650 | 2 |
| Mode M9 | |||
|---|---|---|---|
| Quadrant | BADHDUFLAG | Total packets | Discarded packets |
| A | 0 | 12 | 0 |
| B | 0 | 12 | 0 |
| C | 0 | 12 | 0 |
| D | 0 | 12 | 0 |
| Mode SS | |||
|---|---|---|---|
| Quadrant | BADHDUFLAG | Total packets | Discarded packets |
| A | 0 | 160 | 0 |
| B | 0 | 160 | 0 |
| C | 0 | 160 | 0 |
| D | 0 | 160 | 0 |
| Quadrant | Total seconds | Saturated seconds | Saturation percentage |
|---|---|---|---|
| A | 7768 | 49 | 0.630793% |
| B | 7768 | 354 | 4.557158% |
| C | 7768 | 62 | 0.798146% |
| D | 7768 | 708 | 9.114315% |
Noise dominated data is calculated using 1-second bins in cleaned event files. If a bin has >2000 counts, and if more than 50% of those come from <1% of pixels, then it is considered to be noise-dominated and hence unusable.
| Quadrant | # 1 sec bins | Bins with >0 counts | Bins with >2000 counts | High rate bins dominated by noise | Noise dominated (total time) | Noise dominated (detector-on time) | Marked lightcurve |
|---|---|---|---|---|---|---|---|
| A | 8998 | 7769 | 0 | 0 | 0.00% | 0.00% | 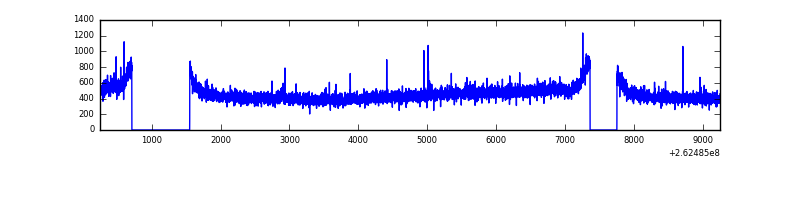 |
| B | 8998 | 7769 | 212 | 212 | 2.36% | 2.73% | 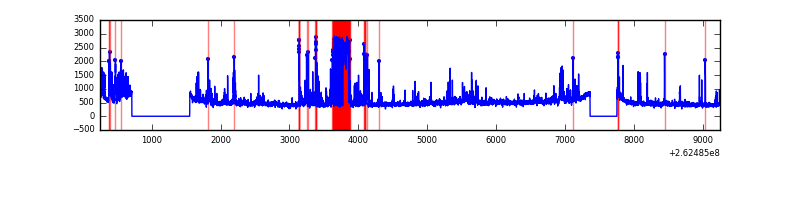 |
| C | 8999 | 7770 | 7 | 7 | 0.08% | 0.09% | 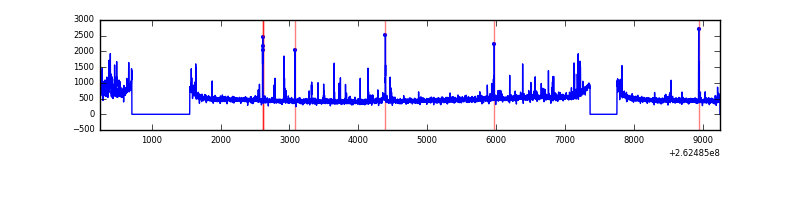 |
| D | 8999 | 7770 | 472 | 472 | 5.25% | 6.07% | 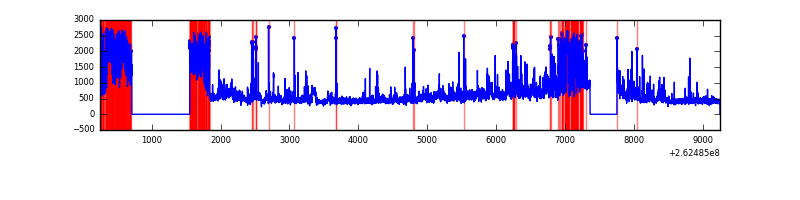 |
Top three noisy pixels from each quadrant. If the there are fewer than three noisy pixels in the level2.evt file, extra rows are filled as -1
| Pixel properties | Quadrant properties | ||||||
|---|---|---|---|---|---|---|---|
| Quadrant | DetID | PixID | Counts | Sigma | Mean | Median | Sigma |
| A | 1 | 162 | 15513 | 79.6 | 906 | 885 | 183.8 |
| A | 15 | 223 | 8454 | 41.19 | 906 | 885 | 183.8 |
| A | 0 | 226 | 7857 | 37.94 | 906 | 885 | 183.8 |
| B | 3 | 64 | 522526 | 3028.31 | 903 | 878 | 172.3 |
| B | 10 | 245 | 384141 | 2224.95 | 903 | 878 | 172.3 |
| B | 0 | 230 | 78859 | 452.7 | 903 | 878 | 172.3 |
| C | 4 | 254 | 227468 | 1082.92 | 905 | 908 | 209.2 |
| C | 3 | 233 | 187451 | 891.64 | 905 | 908 | 209.2 |
| C | 13 | 61 | 6504 | 26.75 | 905 | 908 | 209.2 |
| D | 1 | 52 | 1425322 | 6957.96 | 858 | 838 | 204.7 |
| D | 13 | 122 | 690291 | 3367.66 | 858 | 838 | 204.7 |
| D | 10 | 157 | 128066 | 621.45 | 858 | 838 | 204.7 |
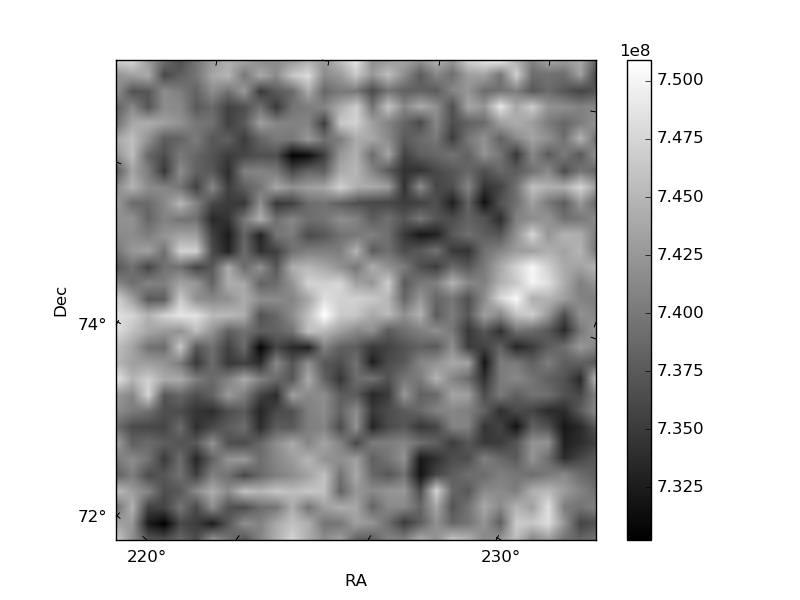
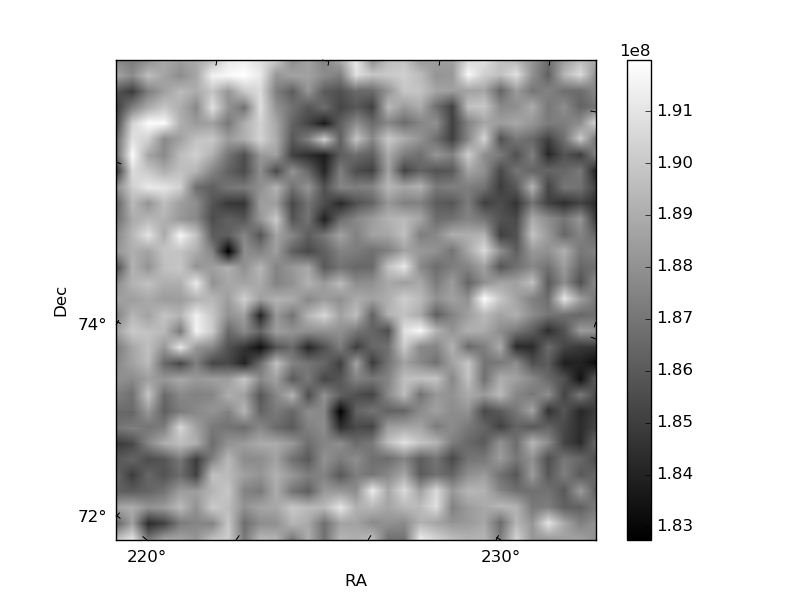
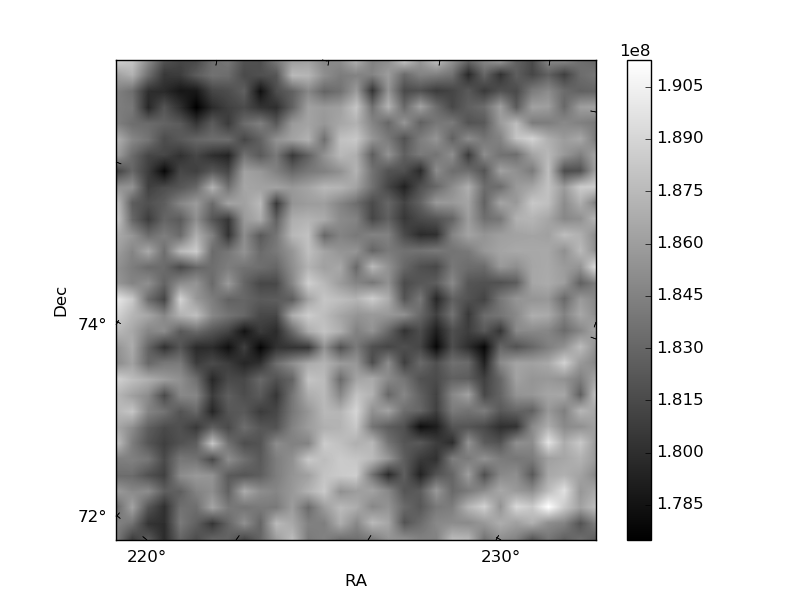
Histogram calculated using DETX and DETY for each event in the final _common_clean file
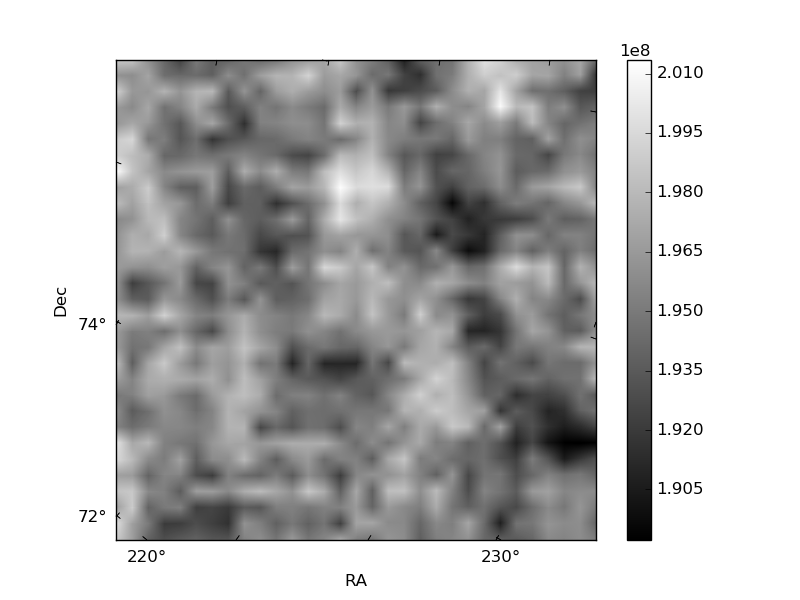
| Quadrant A | 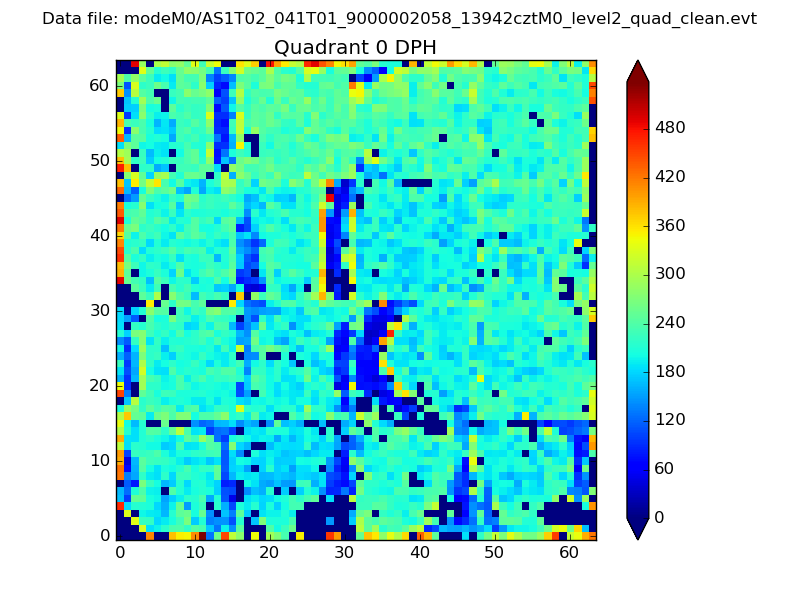 |
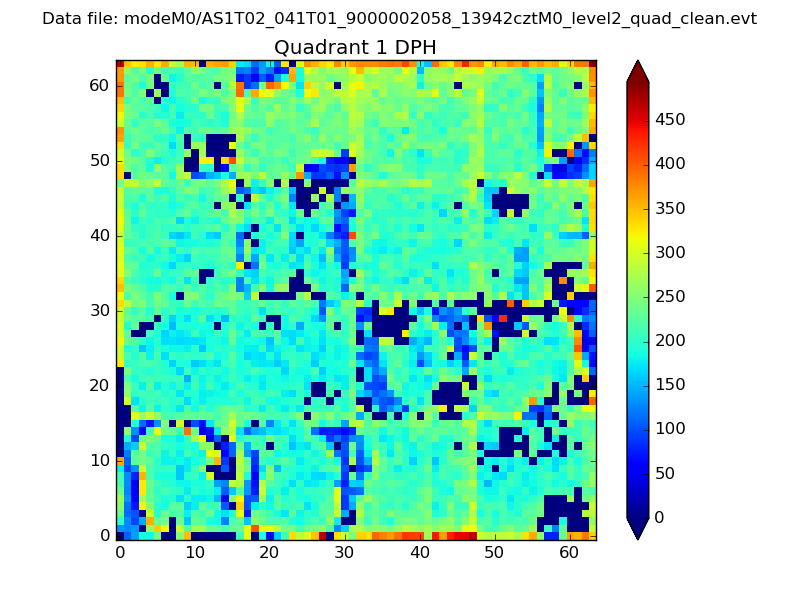 |
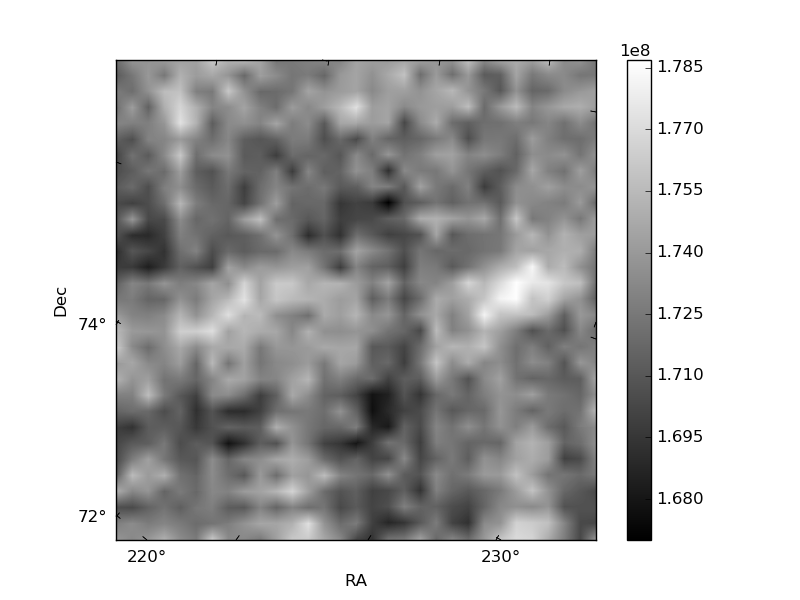
Quadrant B |
|---|---|---|---|
| Quadrant D | 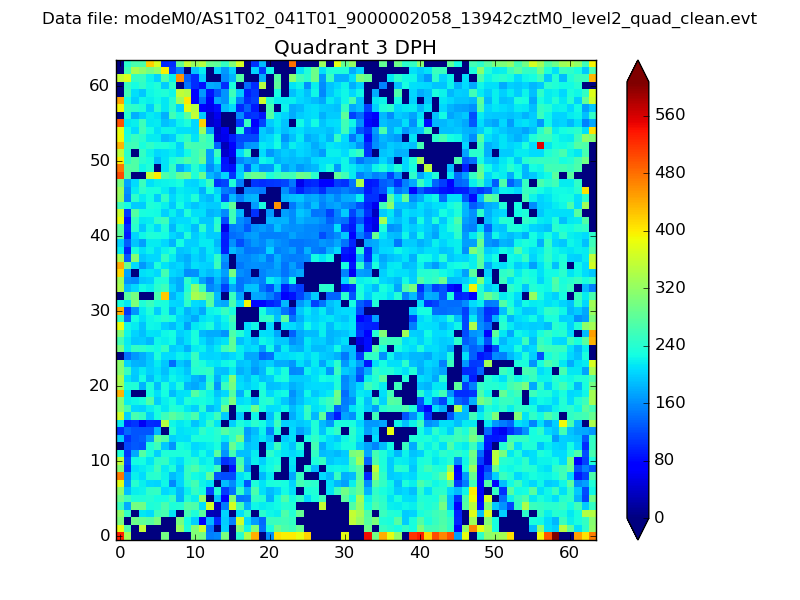 |
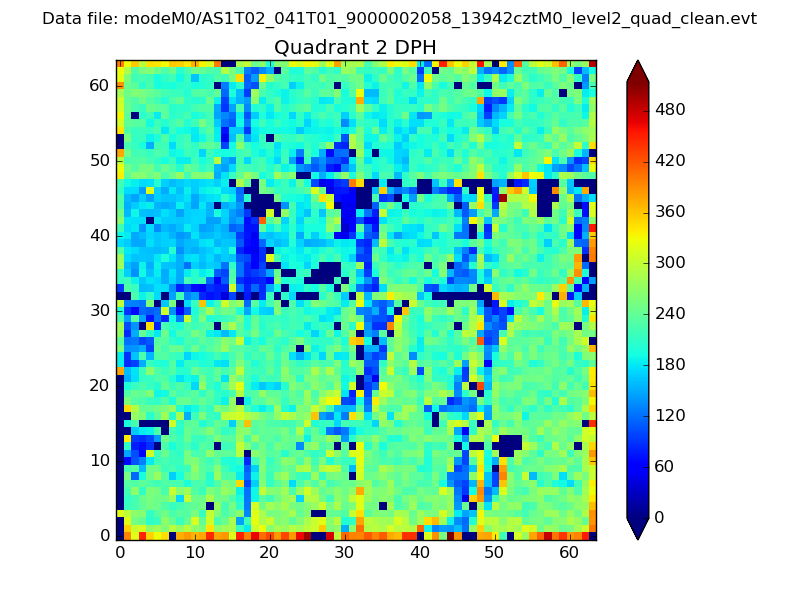 |
Quadrant C |
| Plot type | Count rate plots | Images |
|---|---|---|
| Comparison with Poisson distribution Blue bars denote a histogram of data divided into 1 sec bins. Red curve is a Poisson curve with rate = median count rate of data. |
 |
 |
| Quadrant-wise count rates Data is divided into 100 sec bins |
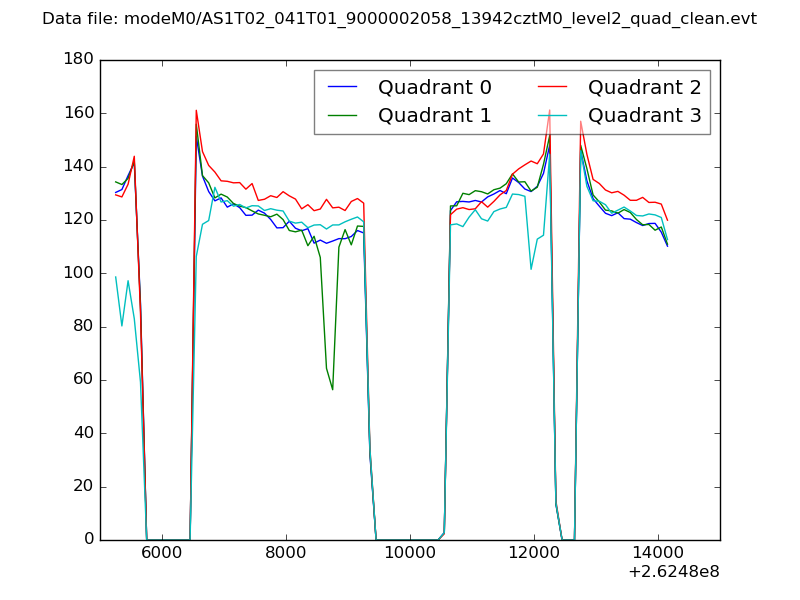 |
|
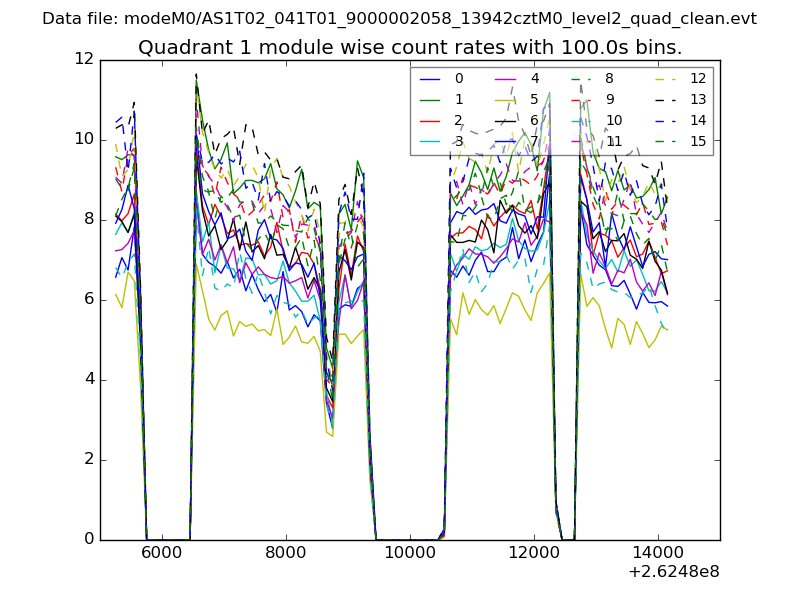
| Module-wise count rates for Quadrant A Data is divided into 100 sec bins |
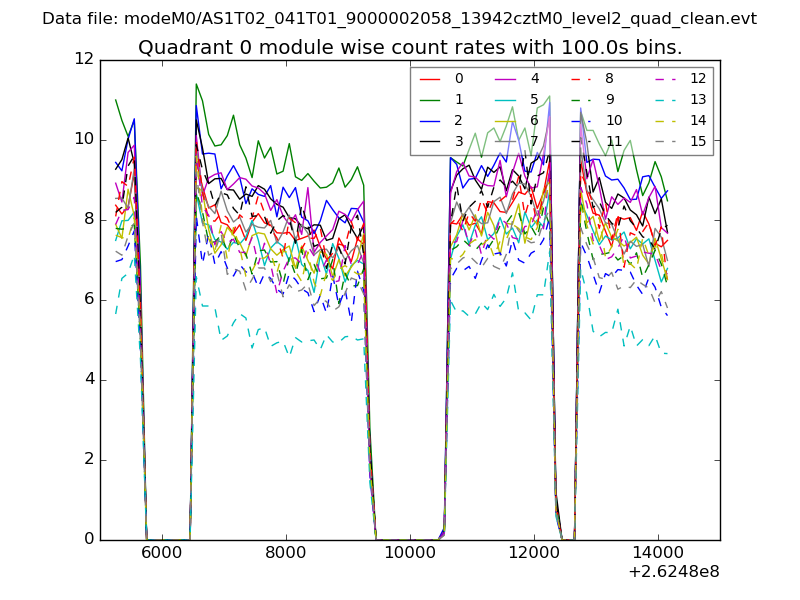 |
 |
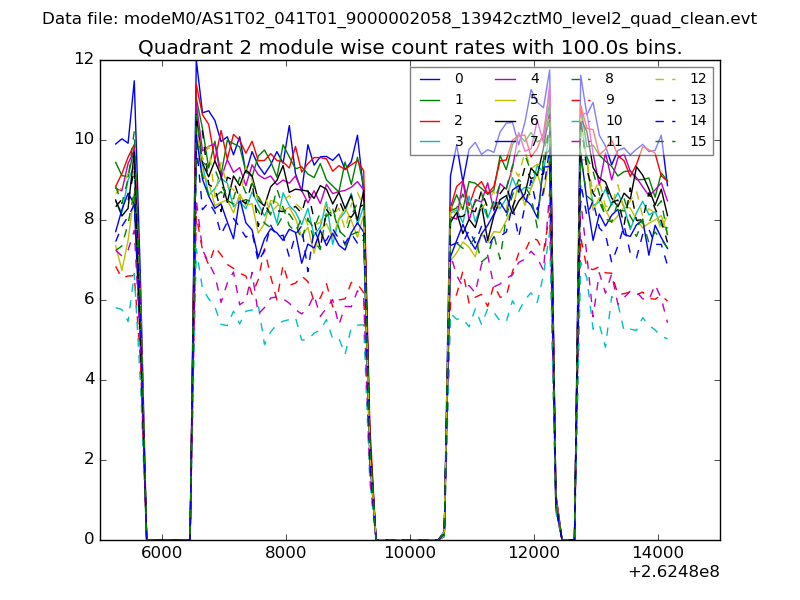
| Module-wise count rates for Quadrant B Data is divided into 100 sec bins |
 |
 |
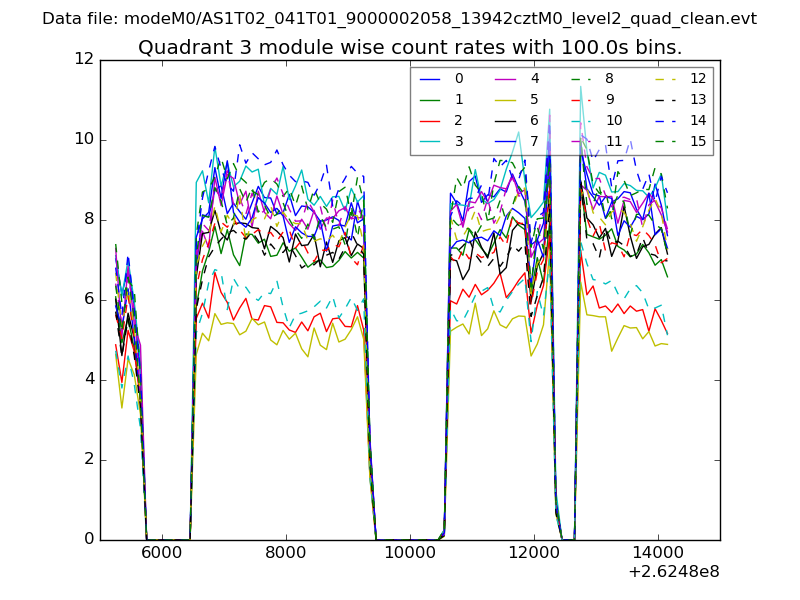
| Module-wise count rates for Quadrant C Data is divided into 100 sec bins |
 |
 |
| Module-wise count rates for Quadrant D Data is divided into 100 sec bins |
 |
 |
| Parameter | Plot |
|---|---|
| CZT HV Monitor | 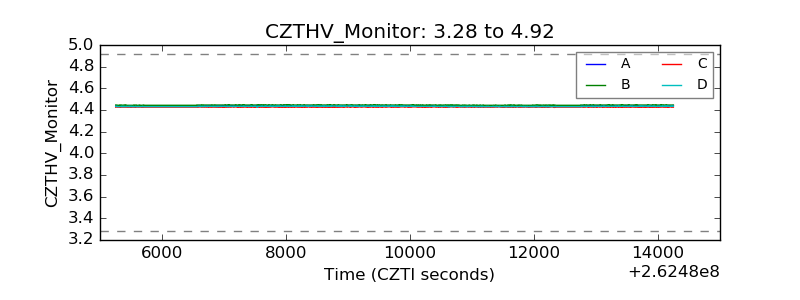 |
| D_VDD | 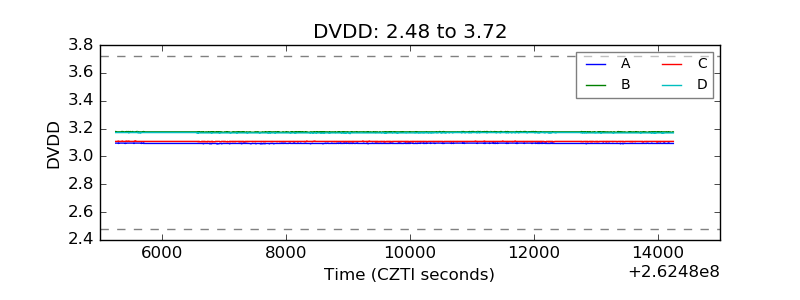 |
| Temperature 1 | 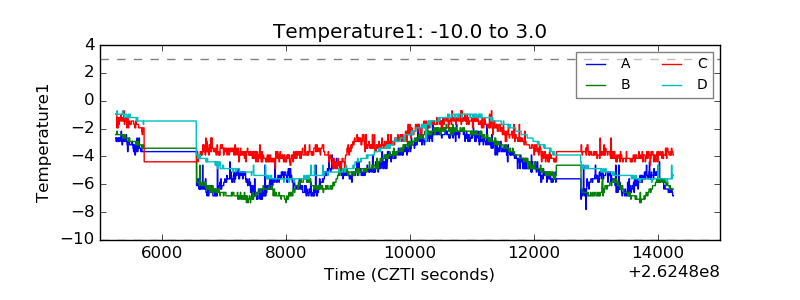 |
| Veto HV Monitor | 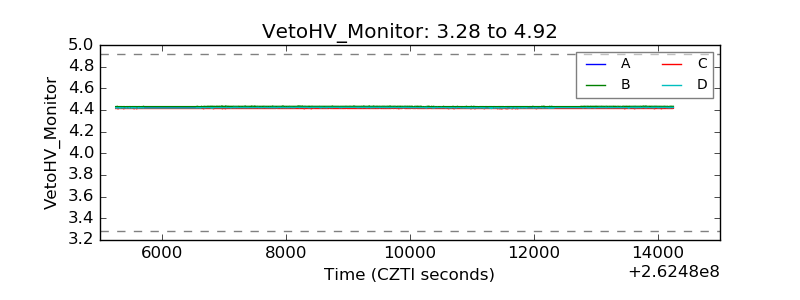 |
| Veto LLD | 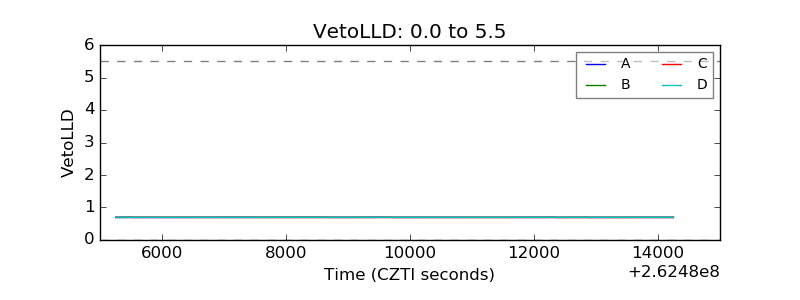 |
| Alpha Counter | 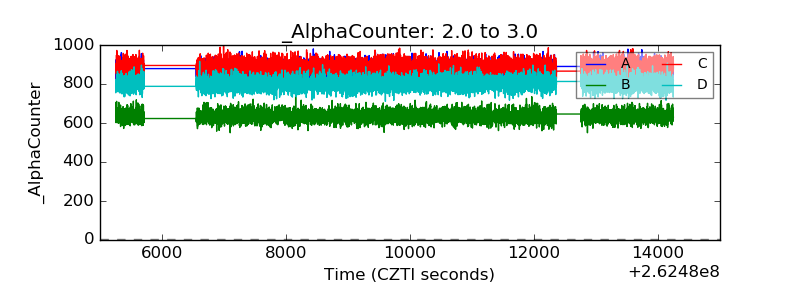 |
| _CPM_Rate | 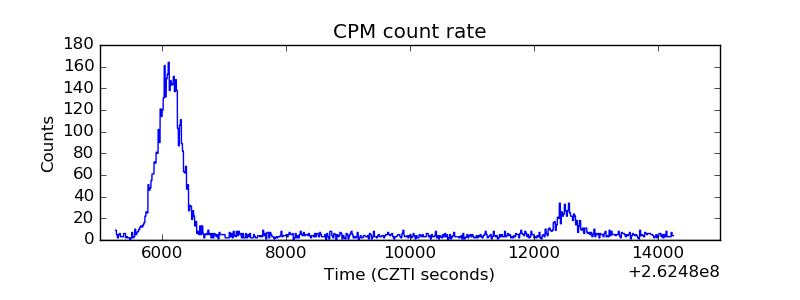 |
| CZT Counter | 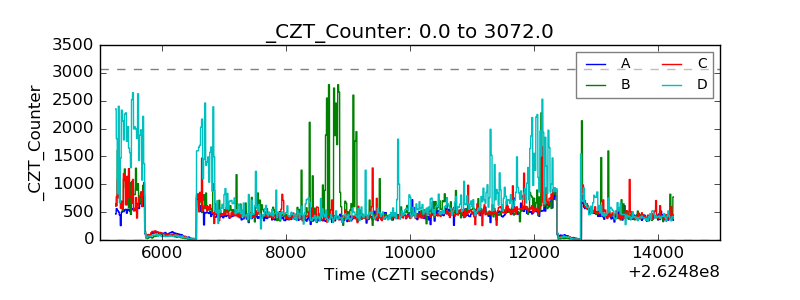 |
| +2.5 Volts monitor |  |
| +5 Volts monitor |  |
| _ROLL_ROT | 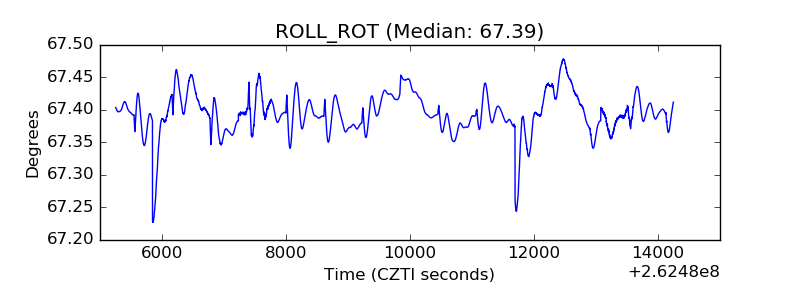 |
| _Roll_DEC | 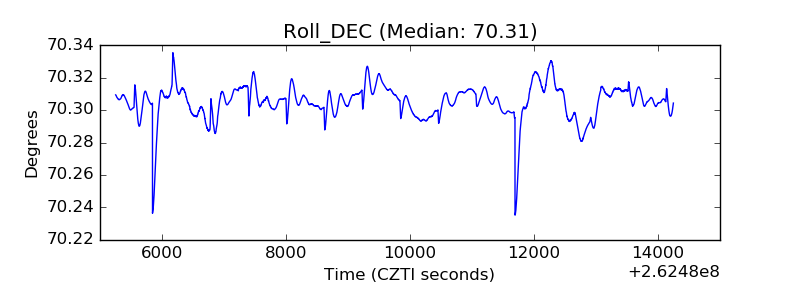 |
| _Roll_RA | 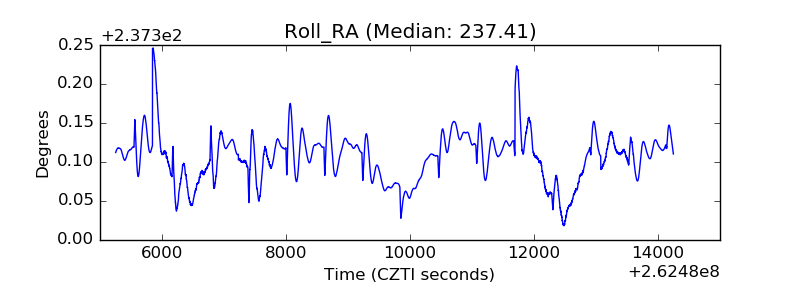 |
| Veto Counter | 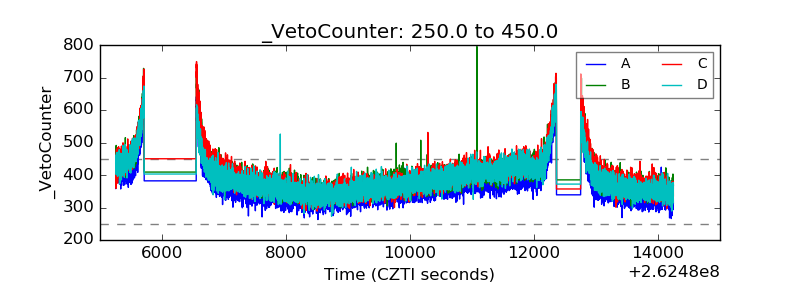 |