| Param | Original file | Final file |
|---|---|---|
| Filename | modeM0/AS1T02_041T01_9000002058_13943cztM0_level2.evt | modeM0/AS1T02_041T01_9000002058_13943cztM0_level2_quad_clean.evt |
| Size (bytes) | 554,483,520 | 130,489,920 |
| Size | 528.8 MB | 124.4 MB |
| Events in quadrant A | 3,610,282 | 830,971 |
| Events in quadrant B | 4,299,178 | 843,438 |
| Events in quadrant C | 3,946,557 | 879,976 |
| Events in quadrant D | 4,391,230 | 839,271 |
| Mode M0 | |||
|---|---|---|---|
| Quadrant | BADHDUFLAG | Total packets | Discarded packets |
| A | 0 | 16553 | 3 |
| B | 0 | 18262 | 2 |
| C | 0 | 17154 | 2 |
| D | 0 | 18801 | 2 |
| Mode M9 | |||
|---|---|---|---|
| Quadrant | BADHDUFLAG | Total packets | Discarded packets |
| A | 0 | 5 | 0 |
| B | 0 | 5 | 0 |
| C | 0 | 5 | 0 |
| D | 0 | 5 | 0 |
| Mode SS | |||
|---|---|---|---|
| Quadrant | BADHDUFLAG | Total packets | Discarded packets |
| A | 0 | 164 | 0 |
| B | 0 | 164 | 0 |
| C | 0 | 164 | 0 |
| D | 0 | 164 | 0 |
| Quadrant | Total seconds | Saturated seconds | Saturation percentage |
|---|---|---|---|
| A | 8036 | 125 | 1.555500% |
| B | 8036 | 232 | 2.887008% |
| C | 8036 | 72 | 0.895968% |
| D | 8036 | 130 | 1.617720% |
Noise dominated data is calculated using 1-second bins in cleaned event files. If a bin has >2000 counts, and if more than 50% of those come from <1% of pixels, then it is considered to be noise-dominated and hence unusable.
| Quadrant | # 1 sec bins | Bins with >0 counts | Bins with >2000 counts | High rate bins dominated by noise | Noise dominated (total time) | Noise dominated (detector-on time) | Marked lightcurve |
|---|---|---|---|---|---|---|---|
| A | 8511 | 8036 | 0 | 0 | 0.00% | 0.00% | 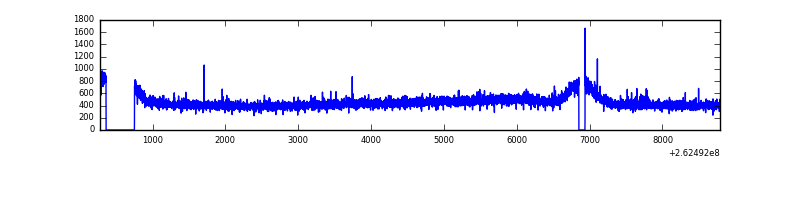 |
| B | 8511 | 8036 | 39 | 39 | 0.46% | 0.49% | 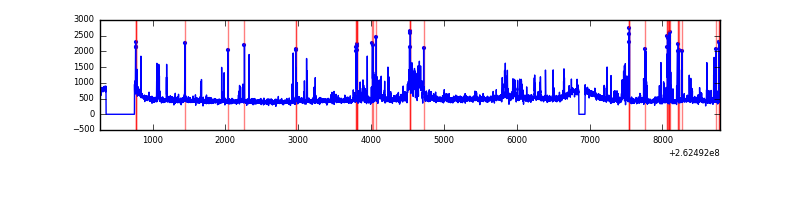 |
| C | 8511 | 8037 | 19 | 19 | 0.22% | 0.24% | 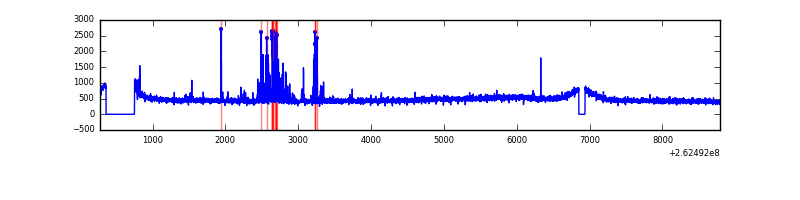 |
| D | 8511 | 8037 | 22 | 22 | 0.26% | 0.27% | 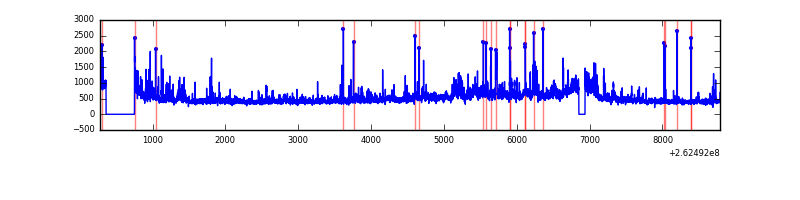 |
Top three noisy pixels from each quadrant. If the there are fewer than three noisy pixels in the level2.evt file, extra rows are filled as -1
| Pixel properties | Quadrant properties | ||||||
|---|---|---|---|---|---|---|---|
| Quadrant | DetID | PixID | Counts | Sigma | Mean | Median | Sigma |
| A | 1 | 162 | 20371 | 102.75 | 929 | 908 | 189.4 |
| A | 0 | 226 | 8097 | 37.95 | 929 | 908 | 189.4 |
| A | 12 | 194 | 7005 | 32.19 | 929 | 908 | 189.4 |
| B | 3 | 64 | 219596 | 1233.62 | 934 | 907 | 177.3 |
| B | 0 | 230 | 175203 | 983.2 | 934 | 907 | 177.3 |
| B | 4 | 173 | 57191 | 317.5 | 934 | 907 | 177.3 |
| C | 4 | 254 | 214250 | 998.28 | 924 | 925 | 213.7 |
| C | 3 | 233 | 130718 | 607.38 | 924 | 925 | 213.7 |
| C | 13 | 61 | 6681 | 26.94 | 924 | 925 | 213.7 |
| D | 13 | 122 | 421476 | 1954.18 | 906 | 881 | 215.2 |
| D | 1 | 52 | 276986 | 1282.85 | 906 | 881 | 215.2 |
| D | 12 | 110 | 60150 | 275.38 | 906 | 881 | 215.2 |
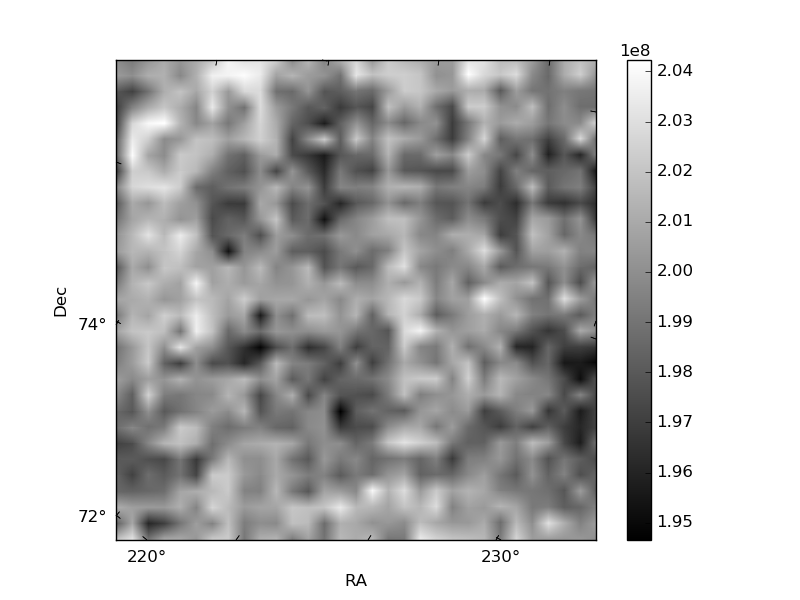
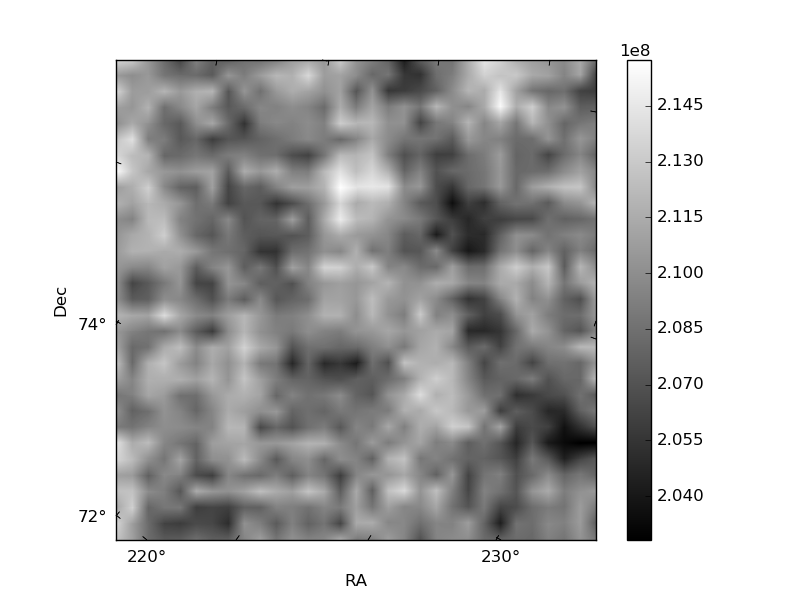
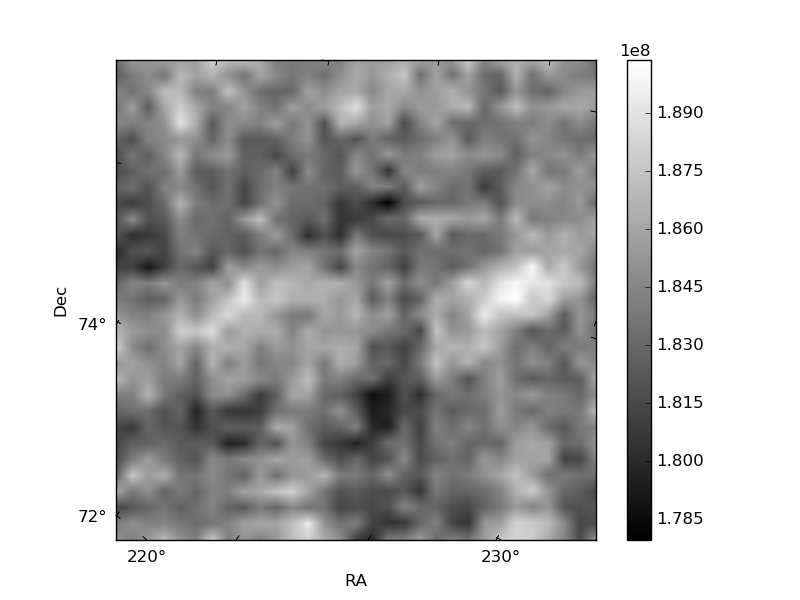
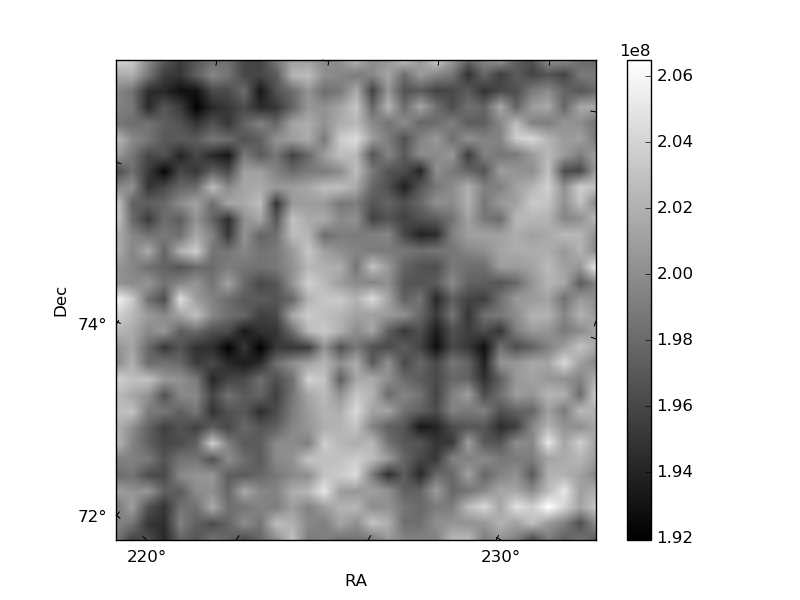
Histogram calculated using DETX and DETY for each event in the final _common_clean file
| Quadrant A | 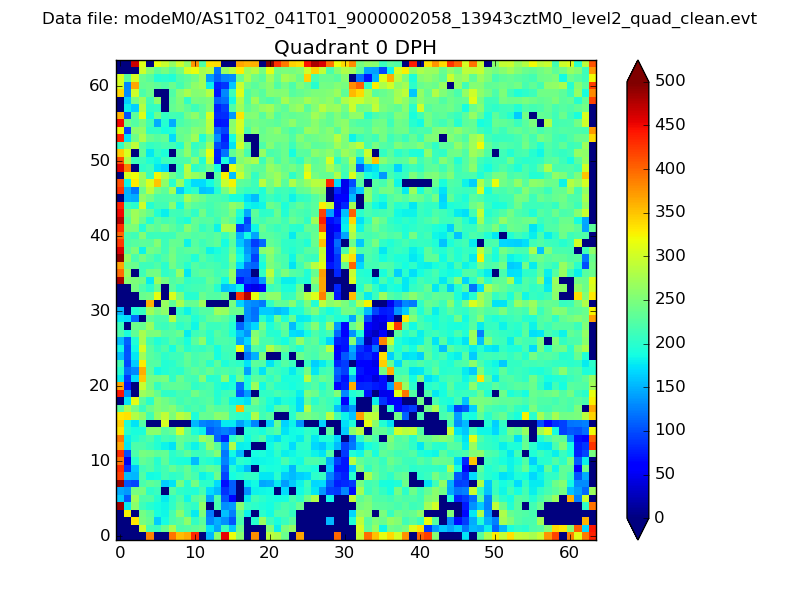 |
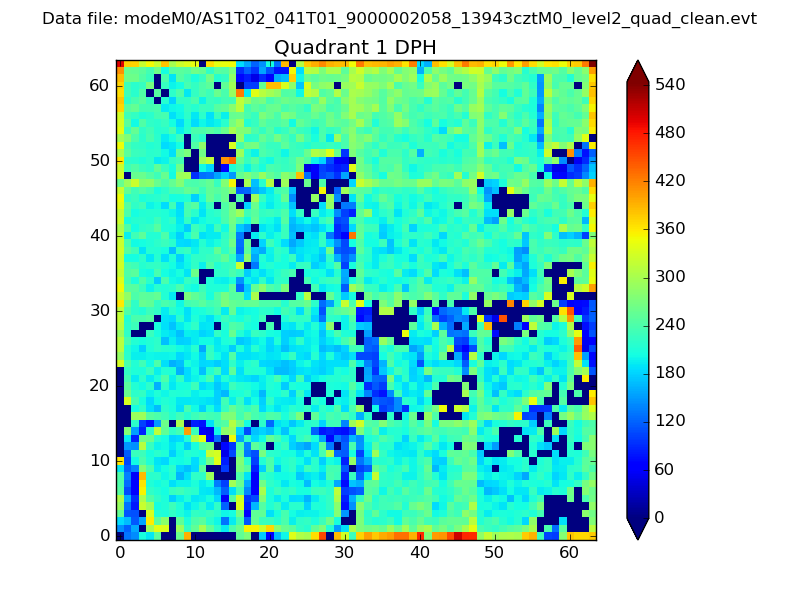 |
Quadrant B |
|---|---|---|---|
| Quadrant D | 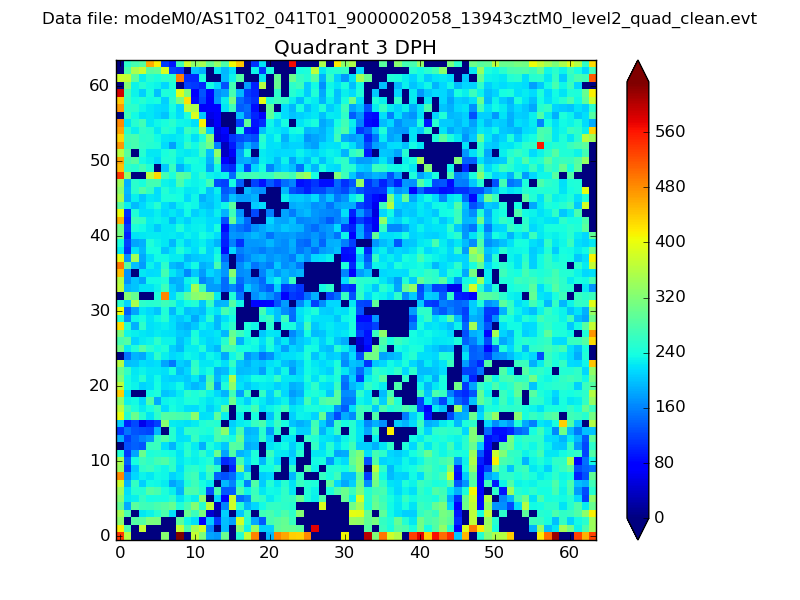 |
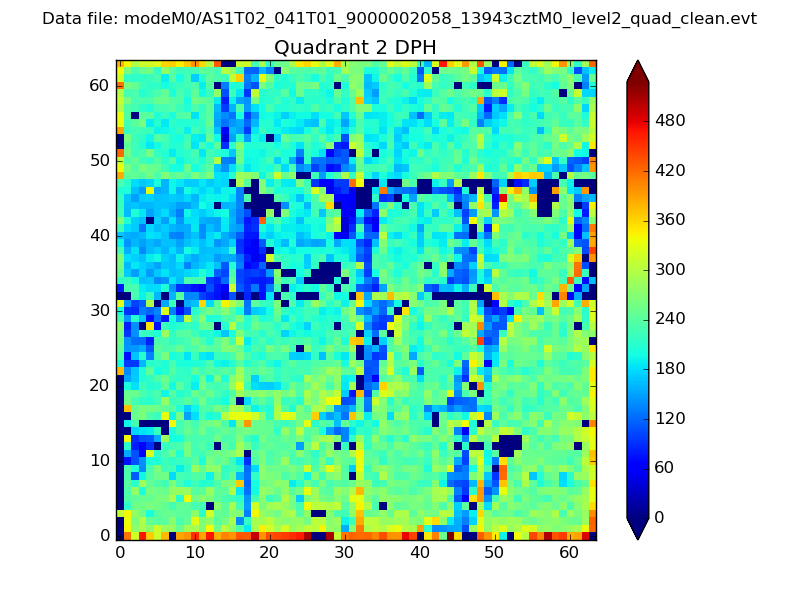 |
Quadrant C |
| Plot type | Count rate plots | Images |
|---|---|---|
| Comparison with Poisson distribution Blue bars denote a histogram of data divided into 1 sec bins. Red curve is a Poisson curve with rate = median count rate of data. |
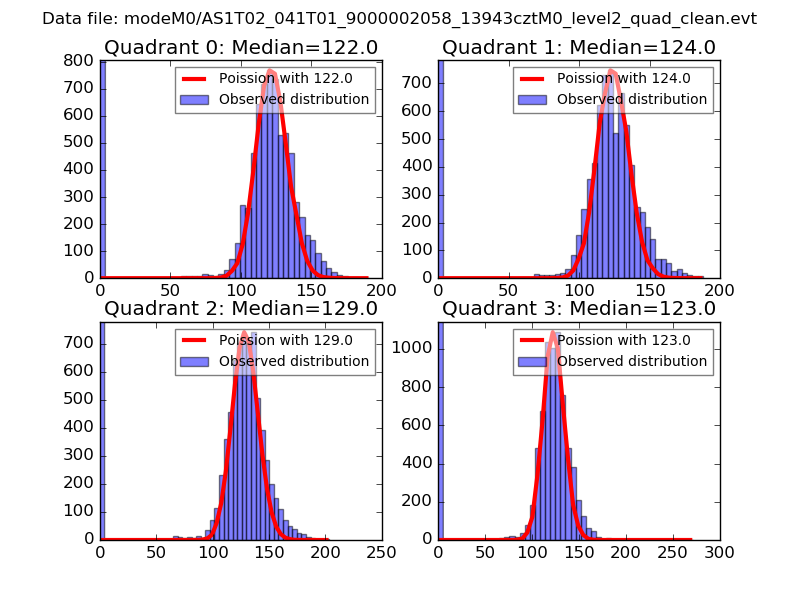 |
 |
| Quadrant-wise count rates Data is divided into 100 sec bins |
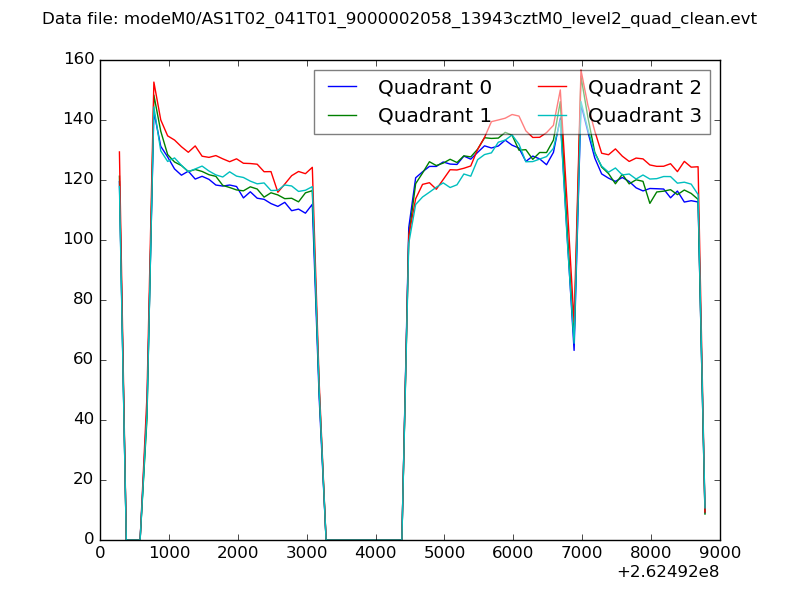 |
|
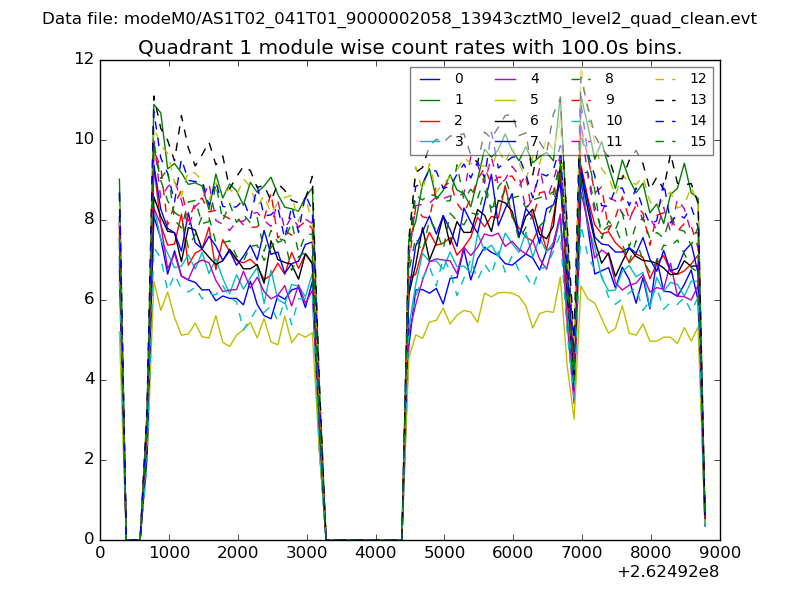
| Module-wise count rates for Quadrant A Data is divided into 100 sec bins |
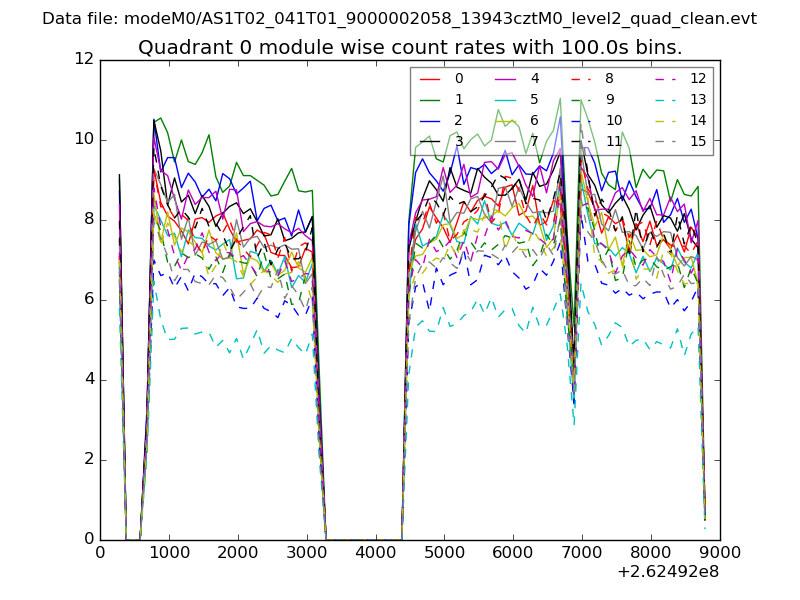 |
 |
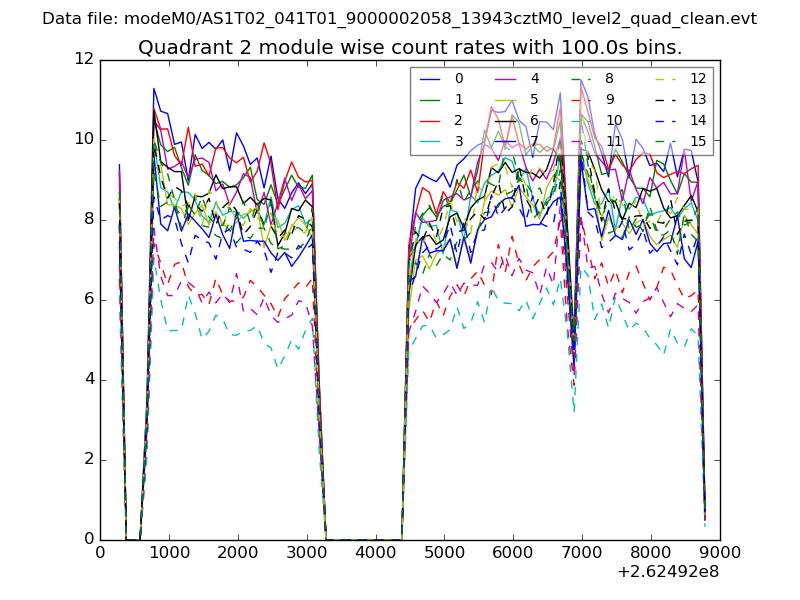
| Module-wise count rates for Quadrant B Data is divided into 100 sec bins |
 |
 |
| Module-wise count rates for Quadrant C Data is divided into 100 sec bins |
 |
 |
| Module-wise count rates for Quadrant D Data is divided into 100 sec bins |
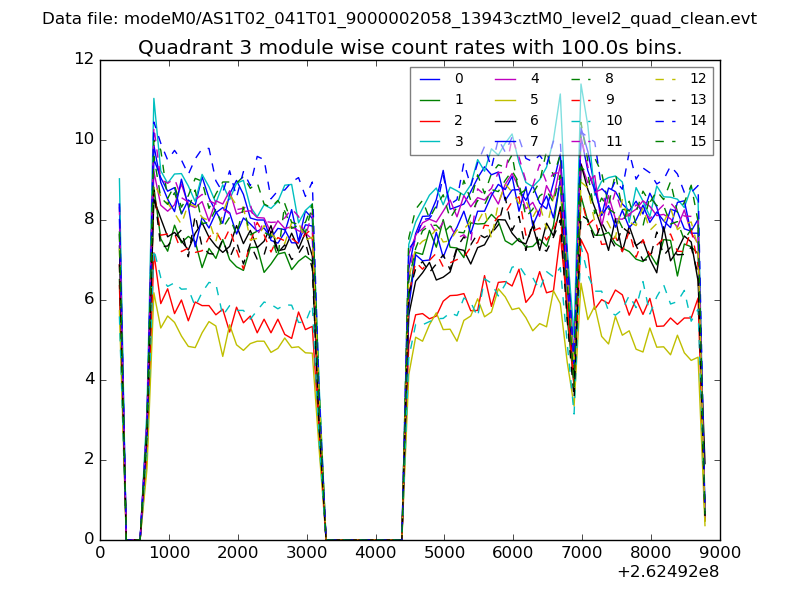 |
 |
| Parameter | Plot |
|---|---|
| CZT HV Monitor | 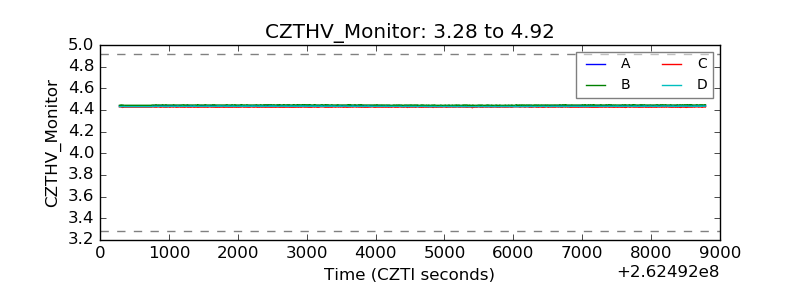 |
| D_VDD | 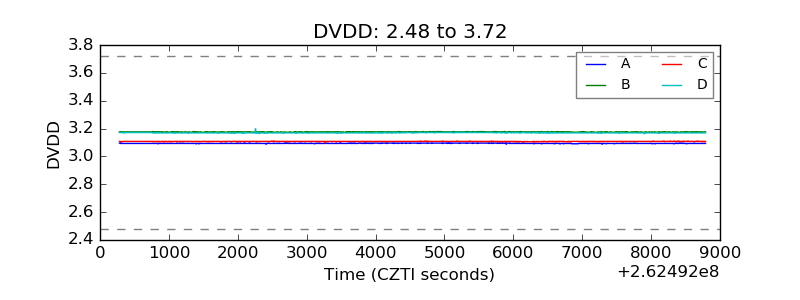 |
| Temperature 1 | 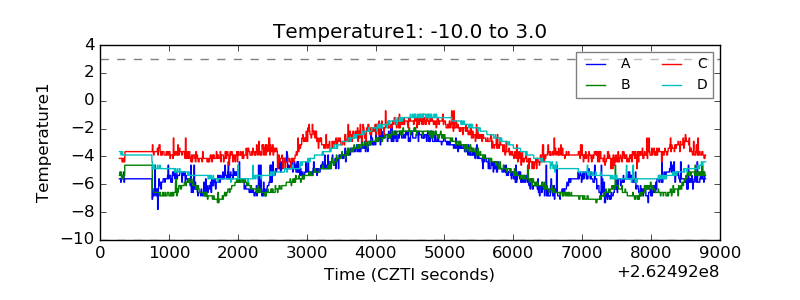 |
| Veto HV Monitor | 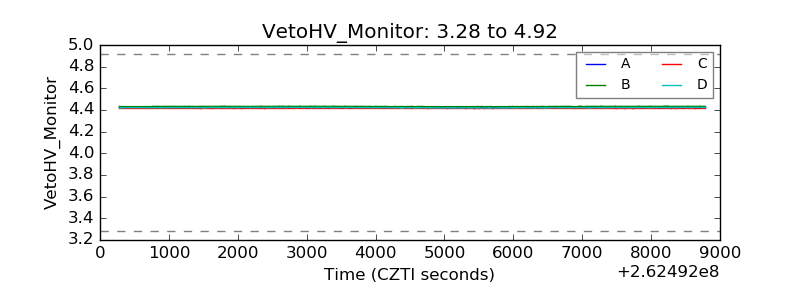 |
| Veto LLD | 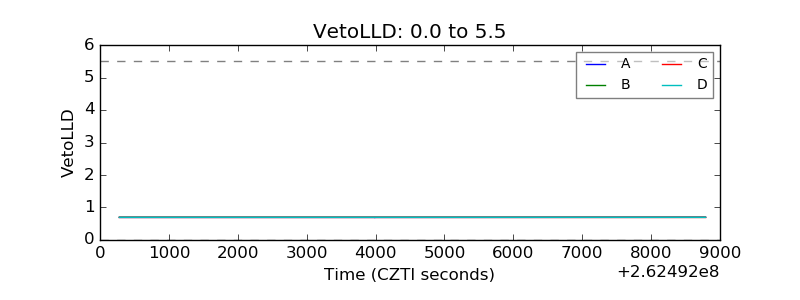 |
| Alpha Counter | 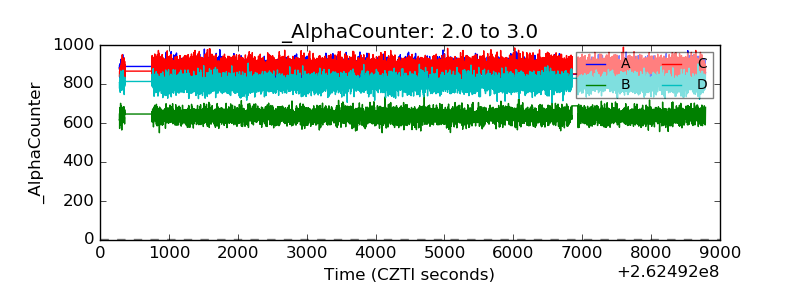 |
| _CPM_Rate | 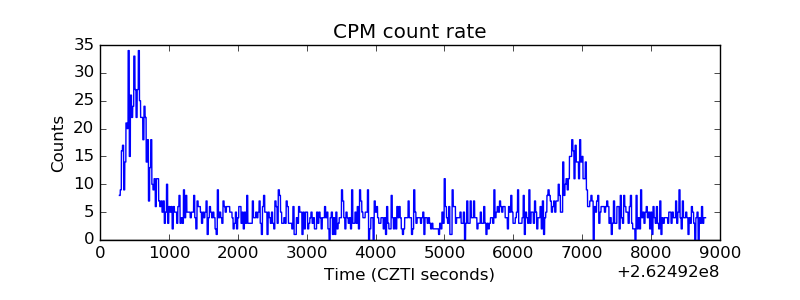 |
| CZT Counter |  |
| +2.5 Volts monitor |  |
| +5 Volts monitor | 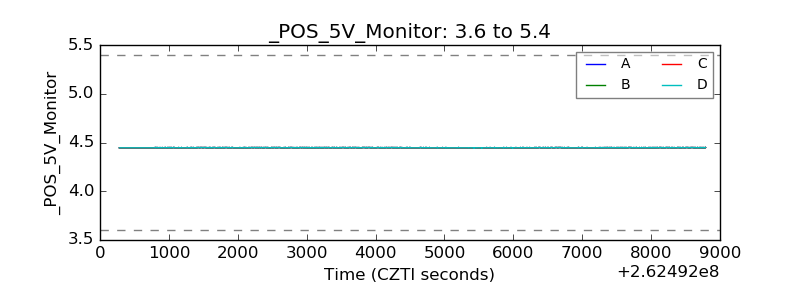 |
| _ROLL_ROT | 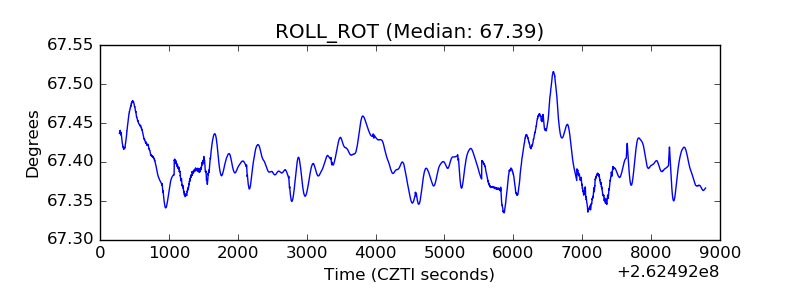 |
| _Roll_DEC |  |
| _Roll_RA |  |
| Veto Counter | 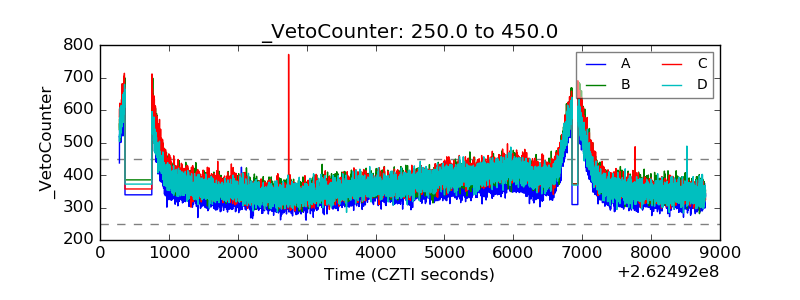 |