| Param | Original file | Final file |
|---|---|---|
| Filename | modeM0/AS1T02_041T01_9000002058_13944cztM0_level2.evt | modeM0/AS1T02_041T01_9000002058_13944cztM0_level2_quad_clean.evt |
| Size (bytes) | 488,263,680 | 108,118,080 |
| Size | 465.6 MB | 103.1 MB |
| Events in quadrant A | 3,091,299 | 685,673 |
| Events in quadrant B | 3,921,817 | 691,747 |
| Events in quadrant C | 3,135,713 | 724,051 |
| Events in quadrant D | 4,166,207 | 688,742 |
| Mode M0 | |||
|---|---|---|---|
| Quadrant | BADHDUFLAG | Total packets | Discarded packets |
| A | 0 | 14152 | 2 |
| B | 0 | 16323 | 1 |
| C | 0 | 14132 | 1 |
| D | 0 | 17360 | 1 |
| Mode M9 | |||
|---|---|---|---|
| Quadrant | BADHDUFLAG | Total packets | Discarded packets |
| A | 0 | 3 | 0 |
| B | 0 | 3 | 0 |
| C | 0 | 3 | 0 |
| D | 0 | 3 | 0 |
| Mode SS | |||
|---|---|---|---|
| Quadrant | BADHDUFLAG | Total packets | Discarded packets |
| A | 0 | 140 | 0 |
| B | 0 | 140 | 0 |
| C | 0 | 140 | 0 |
| D | 0 | 140 | 0 |
| Quadrant | Total seconds | Saturated seconds | Saturation percentage |
|---|---|---|---|
| A | 6955 | 107 | 1.538462% |
| B | 6955 | 199 | 2.861251% |
| C | 6955 | 41 | 0.589504% |
| D | 6955 | 91 | 1.308411% |
Noise dominated data is calculated using 1-second bins in cleaned event files. If a bin has >2000 counts, and if more than 50% of those come from <1% of pixels, then it is considered to be noise-dominated and hence unusable.
| Quadrant | # 1 sec bins | Bins with >0 counts | Bins with >2000 counts | High rate bins dominated by noise | Noise dominated (total time) | Noise dominated (detector-on time) | Marked lightcurve |
|---|---|---|---|---|---|---|---|
| A | 7216 | 6956 | 0 | 0 | 0.00% | 0.00% | 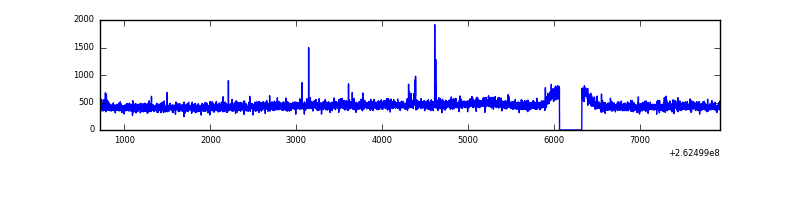 |
| B | 7215 | 6955 | 73 | 73 | 1.01% | 1.05% | 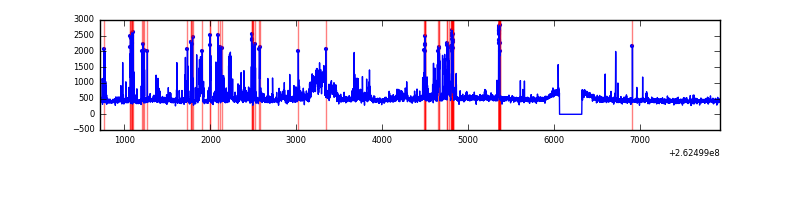 |
| C | 7215 | 6955 | 0 | 0 | 0.00% | 0.00% | 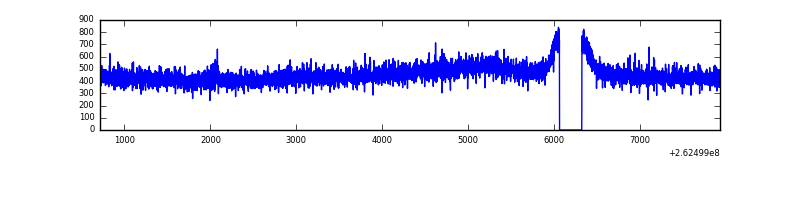 |
| D | 7215 | 6955 | 22 | 22 | 0.30% | 0.32% | 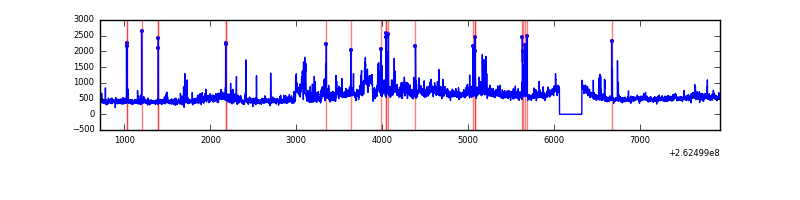 |
Top three noisy pixels from each quadrant. If the there are fewer than three noisy pixels in the level2.evt file, extra rows are filled as -1
| Pixel properties | Quadrant properties | ||||||
|---|---|---|---|---|---|---|---|
| Quadrant | DetID | PixID | Counts | Sigma | Mean | Median | Sigma |
| A | 1 | 162 | 21170 | 125.75 | 790 | 772 | 162.2 |
| A | 14 | 111 | 11059 | 63.42 | 790 | 772 | 162.2 |
| A | 1 | 178 | 6989 | 38.33 | 790 | 772 | 162.2 |
| B | 3 | 64 | 330977 | 2182.21 | 789 | 766 | 151.3 |
| B | 10 | 245 | 236609 | 1558.58 | 789 | 766 | 151.3 |
| B | 0 | 230 | 152223 | 1000.91 | 789 | 766 | 151.3 |
| C | 3 | 233 | 78398 | 428.31 | 782 | 785 | 181.2 |
| C | 13 | 61 | 5681 | 27.02 | 782 | 785 | 181.2 |
| C | 8 | 128 | 4644 | 21.3 | 782 | 785 | 181.2 |
| D | 13 | 122 | 631331 | 3420.61 | 770 | 749 | 184.3 |
| D | 12 | 110 | 217076 | 1173.47 | 770 | 749 | 184.3 |
| D | 1 | 52 | 150050 | 809.89 | 770 | 749 | 184.3 |
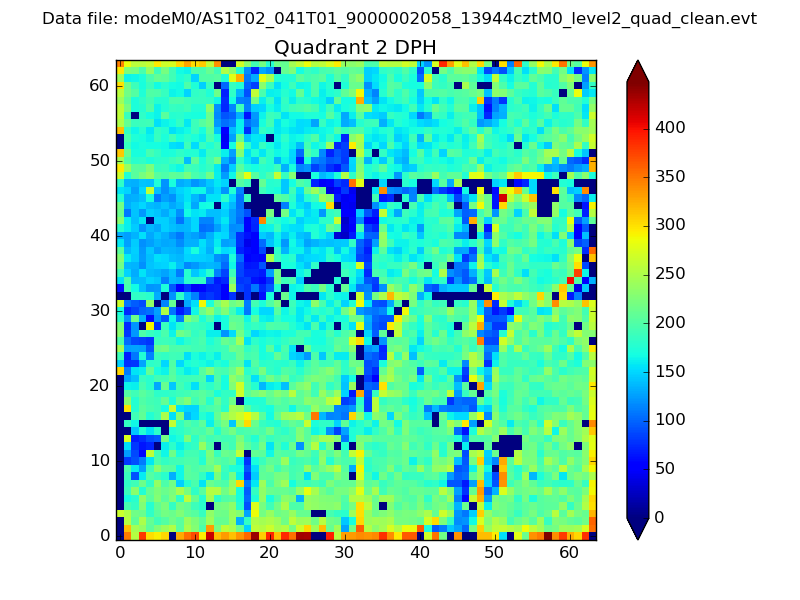
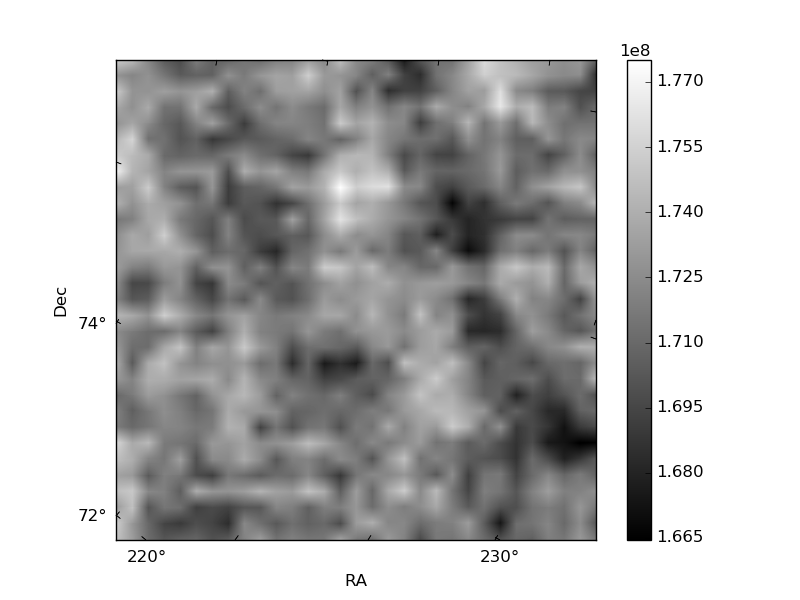
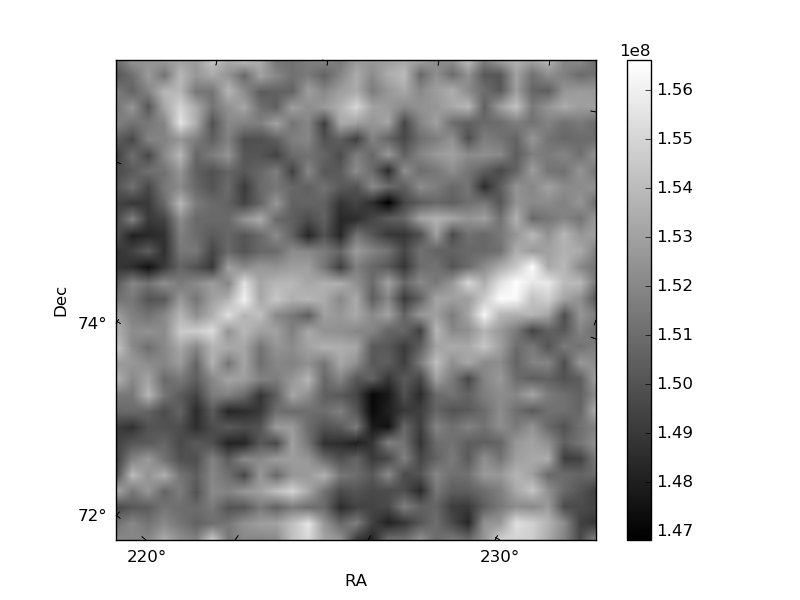
Histogram calculated using DETX and DETY for each event in the final _common_clean file
| Quadrant A | 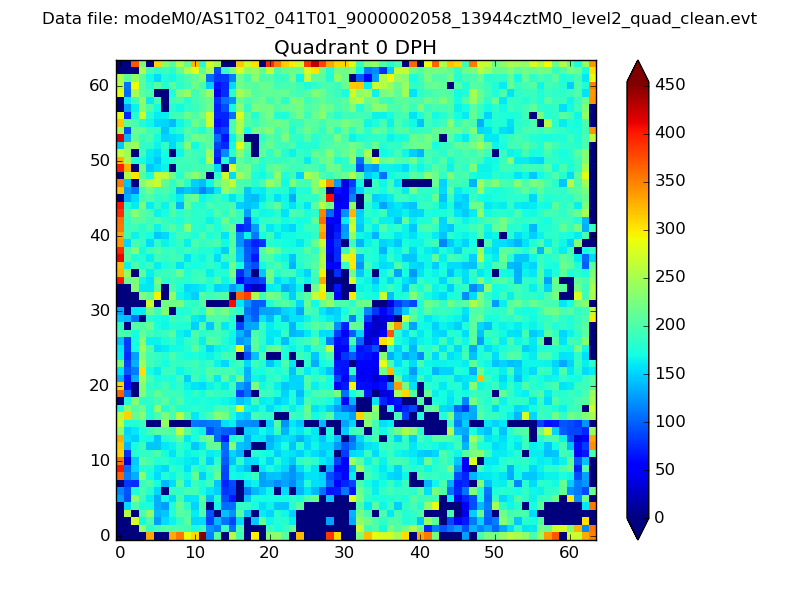 |
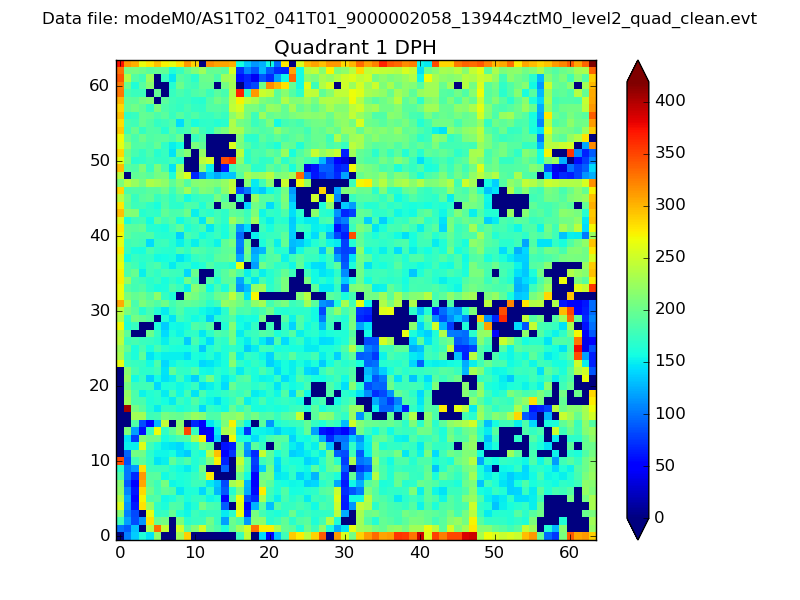 |
Quadrant B |
|---|---|---|---|
| Quadrant D | 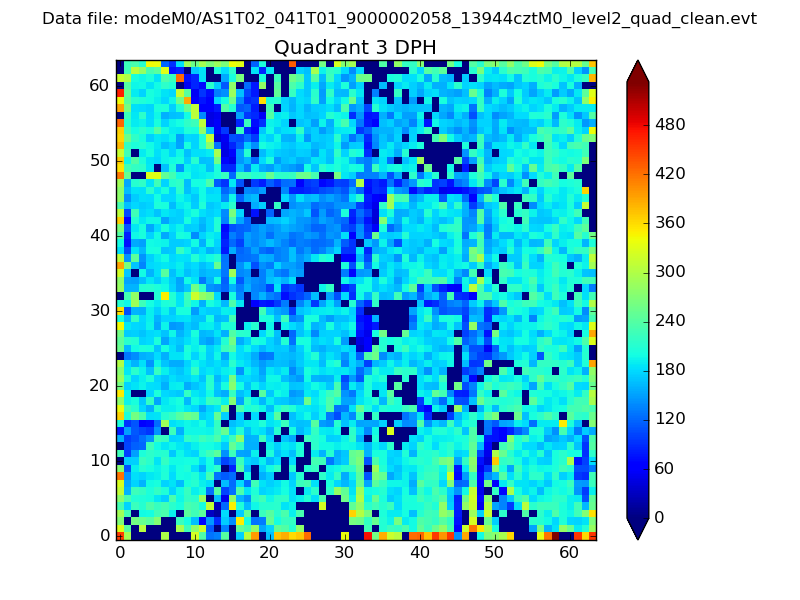 |
 |
Quadrant C |
| Plot type | Count rate plots | Images |
|---|---|---|
| Comparison with Poisson distribution Blue bars denote a histogram of data divided into 1 sec bins. Red curve is a Poisson curve with rate = median count rate of data. |
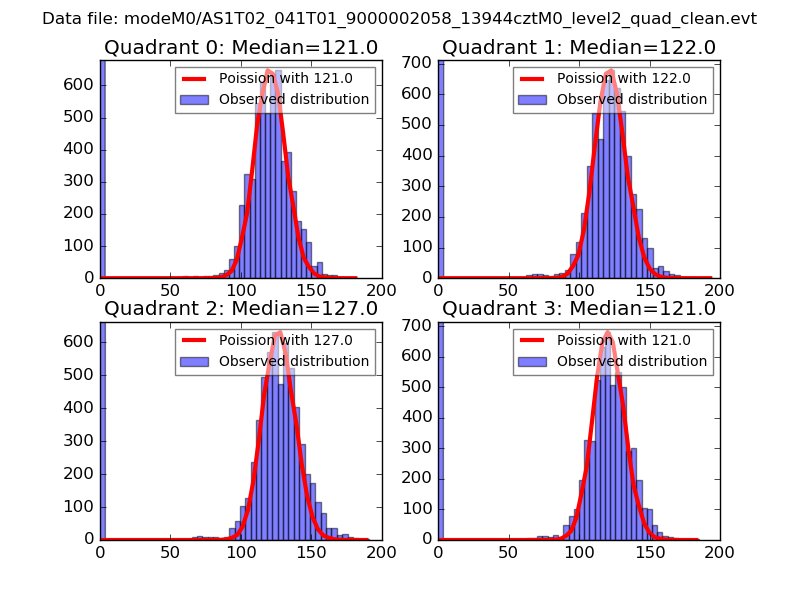 |
 |
| Quadrant-wise count rates Data is divided into 100 sec bins |
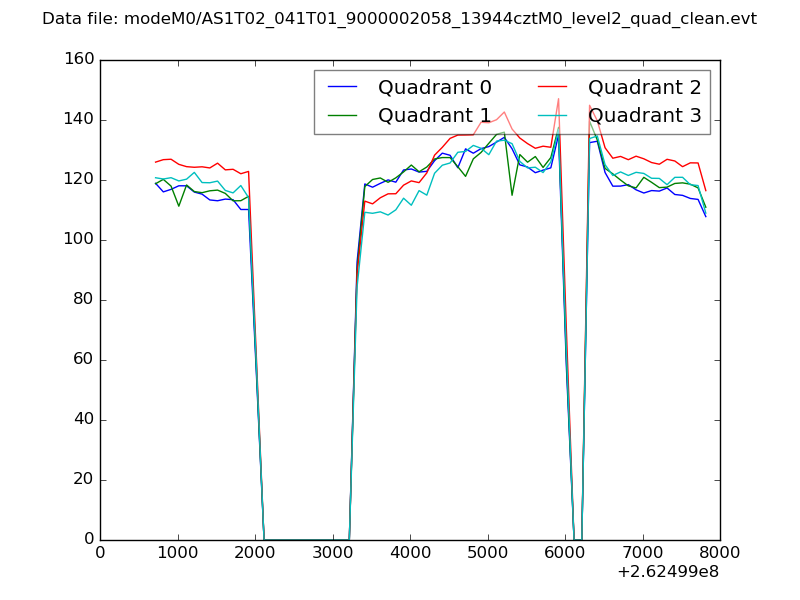 |
|
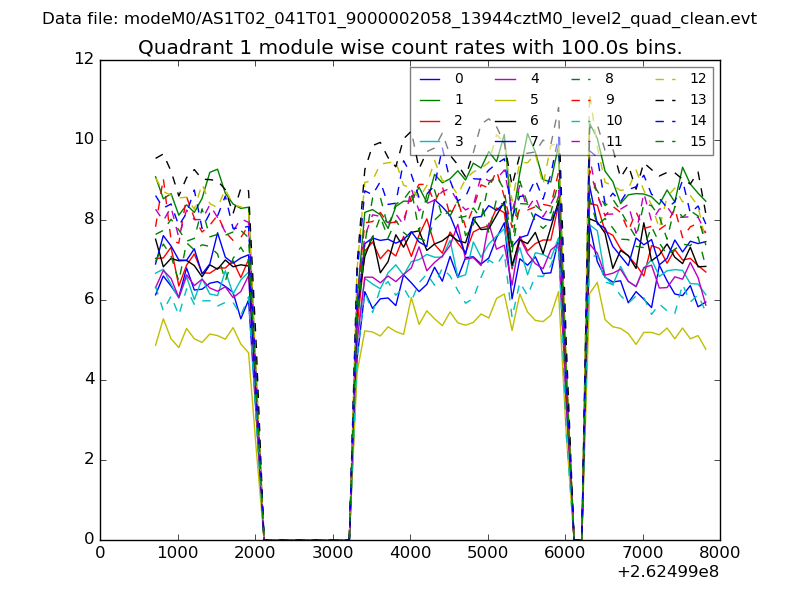
| Module-wise count rates for Quadrant A Data is divided into 100 sec bins |
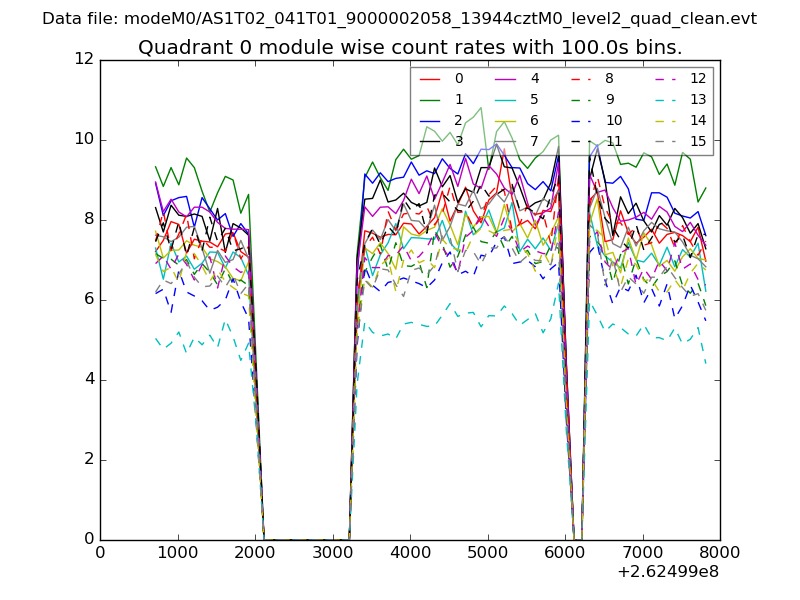 |
 |
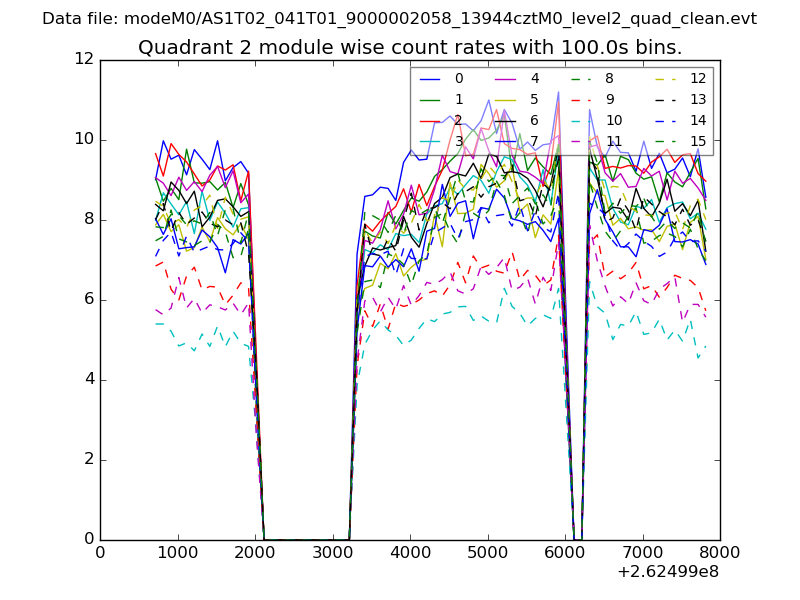
| Module-wise count rates for Quadrant B Data is divided into 100 sec bins |
 |
 |
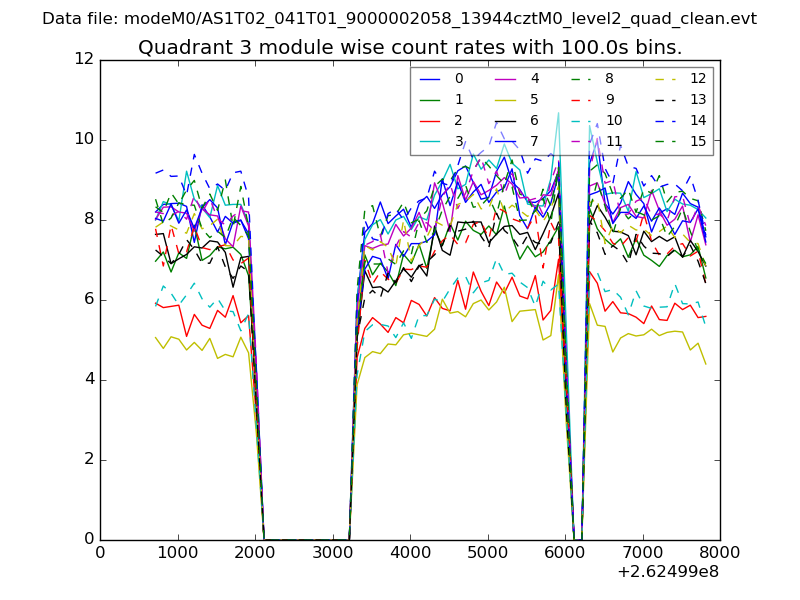
| Module-wise count rates for Quadrant C Data is divided into 100 sec bins |
 |
 |
| Module-wise count rates for Quadrant D Data is divided into 100 sec bins |
 |
 |
| Parameter | Plot |
|---|---|
| CZT HV Monitor |  |
| D_VDD | 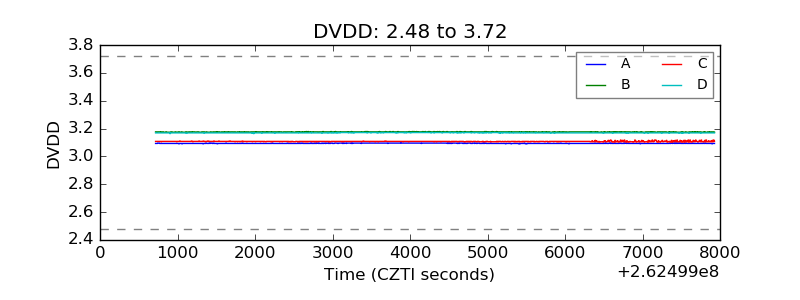 |
| Temperature 1 | 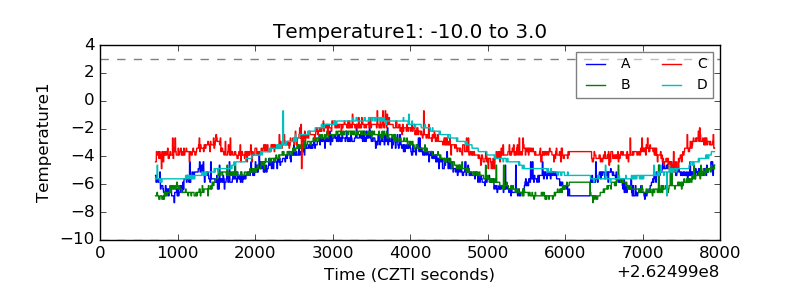 |
| Veto HV Monitor | 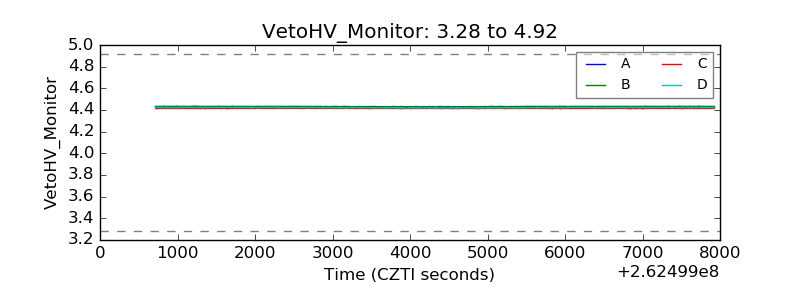 |
| Veto LLD | 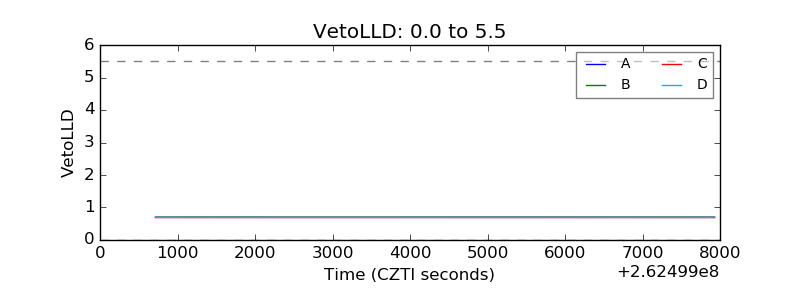 |
| Alpha Counter | 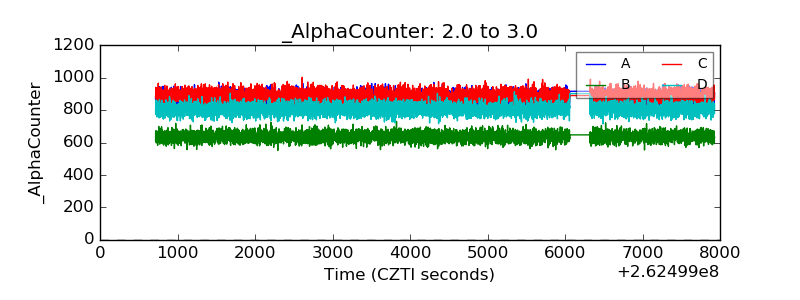 |
| _CPM_Rate | 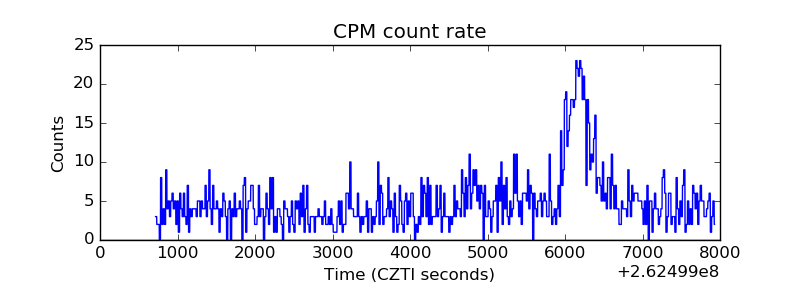 |
| CZT Counter | 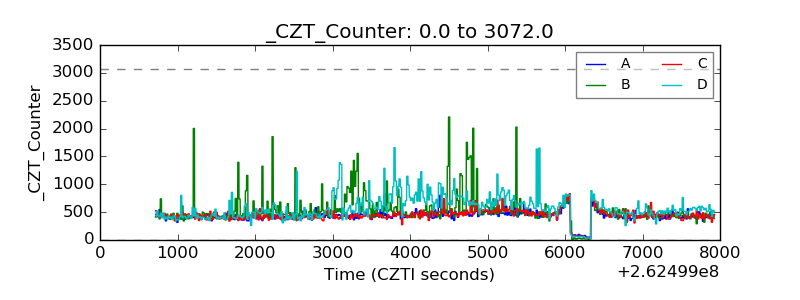 |
| +2.5 Volts monitor |  |
| +5 Volts monitor | 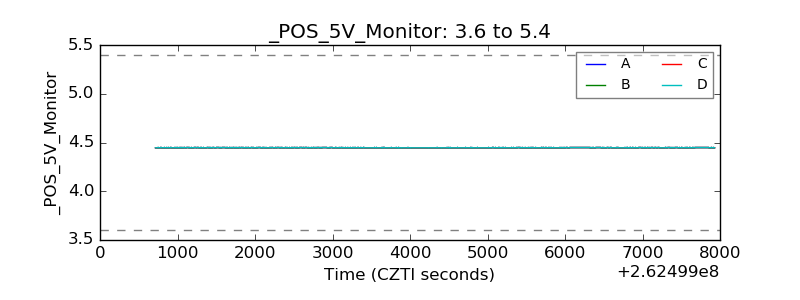 |
| _ROLL_ROT | 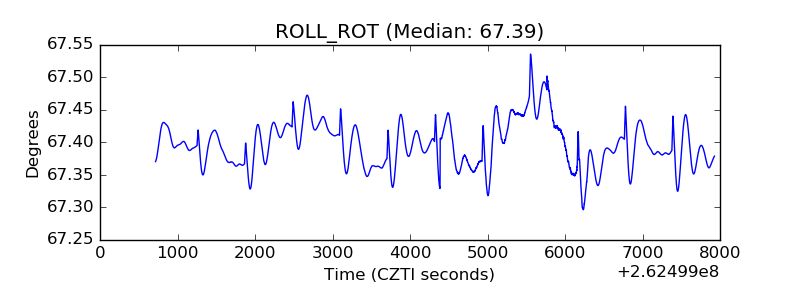 |
| _Roll_DEC | 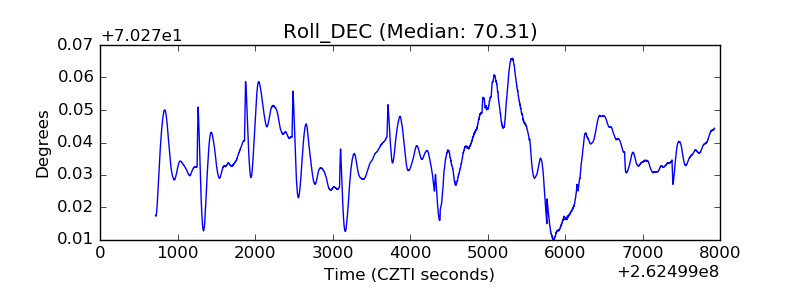 |
| _Roll_RA |  |
| Veto Counter | 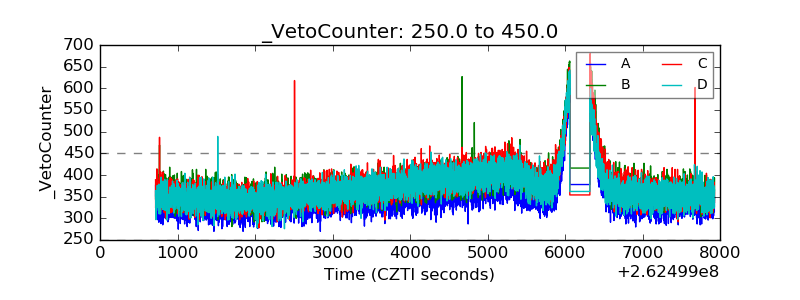 |