| Param | Original file | Final file |
|---|---|---|
| Filename | modeM0/AS1A04_026T04_9000002060cztM0_level2.fits | modeM0/AS1A04_026T04_9000002060cztM0_level2_quad_clean.evt |
| Size (bytes) | 212,040,000 | 257,270,400 |
| Size | 202.2 MB | 245.4 MB |
| Events in quadrant A | 1,276,930 | 1,623,875 |
| Events in quadrant B | 1,226,472 | 1,605,489 |
| Events in quadrant C | 1,264,032 | 1,574,395 |
| Events in quadrant D | 1,064,378 | 1,398,308 |
| Mode M9 | |||
|---|---|---|---|
| Quadrant | BADHDUFLAG | Total packets | Discarded packets |
| A | 0 | 36 | 0 |
| B | 0 | 36 | 0 |
| C | 0 | 36 | 0 |
| D | 0 | 36 | 0 |
| Mode SS | |||
|---|---|---|---|
| Quadrant | BADHDUFLAG | Total packets | Discarded packets |
| A | 0 | 472 | 0 |
| B | 0 | 472 | 0 |
| C | 0 | 472 | 0 |
| D | 0 | 472 | 0 |
| Mode M0 | |||
|---|---|---|---|
| Quadrant | BADHDUFLAG | Total packets | Discarded packets |
| A | 0 | 47852 | 0 |
| B | 0 | 51567 | 0 |
| C | 0 | 47756 | 0 |
| D | 0 | 74050 | 0 |
| Quadrant | Total seconds | Saturated seconds | Saturation percentage |
|---|---|---|---|
| A | 23089 | 219 | 0.948504% |
| B | 23089 | 318 | 1.377279% |
| C | 23089 | 171 | 0.740612% |
| D | 23089 | 1176 | 5.093334% |
Noise dominated data is calculated using 1-second bins in cleaned event files. If a bin has >2000 counts, and if more than 50% of those come from <1% of pixels, then it is considered to be noise-dominated and hence unusable.
| Quadrant | # 1 sec bins | Bins with >0 counts | Bins with >2000 counts | High rate bins dominated by noise | Noise dominated (total time) | Noise dominated (detector-on time) | Marked lightcurve |
|---|---|---|---|---|---|---|---|
| A | 26709 | 23087 | 0 | 0 | 0.00% | 0.00% | 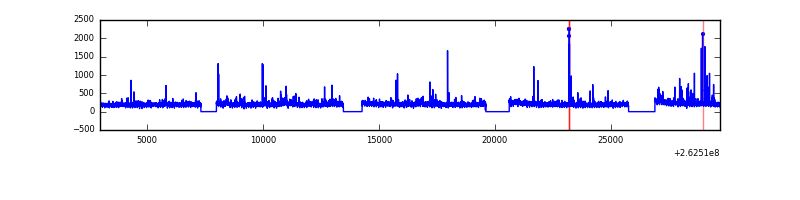 |
| B | 26708 | 23085 | 0 | 0 | 0.00% | 0.00% |  |
| C | 26708 | 23084 | 0 | 0 | 0.00% | 0.00% |  |
| D | 26709 | 23082 | 0 | 0 | 0.00% | 0.00% |  |
Top three noisy pixels from each quadrant. If the there are fewer than three noisy pixels in the level2.evt file, extra rows are filled as -1
| Pixel properties | Quadrant properties | ||||||
|---|---|---|---|---|---|---|---|
| Quadrant | DetID | PixID | Counts | Sigma | Mean | Median | Sigma |
| A | 0 | 29 | 1229 | 10.84 | 333 | 313 | 84.5 |
| A | 7 | 110 | 1065 | 8.9 | 333 | 313 | 84.5 |
| A | 0 | 30 | 943 | 7.46 | 333 | 313 | 84.5 |
| B | 2 | 9 | 1091 | 12.05 | 323 | 309 | 64.9 |
| B | 3 | 17 | 842 | 8.21 | 323 | 309 | 64.9 |
| B | 5 | 255 | 810 | 7.72 | 323 | 309 | 64.9 |
| C | 12 | 241 | 964 | 7.54 | 333 | 311 | 86.6 |
| C | 2 | 191 | 870 | 6.45 | 333 | 311 | 86.6 |
| C | 9 | 242 | 828 | 5.97 | 333 | 311 | 86.6 |
| D | 6 | 231 | 799 | 6.35 | 304 | 276 | 82.4 |
| D | 3 | 14 | 785 | 6.18 | 304 | 276 | 82.4 |
| D | 7 | 3 | 755 | 5.81 | 304 | 276 | 82.4 |
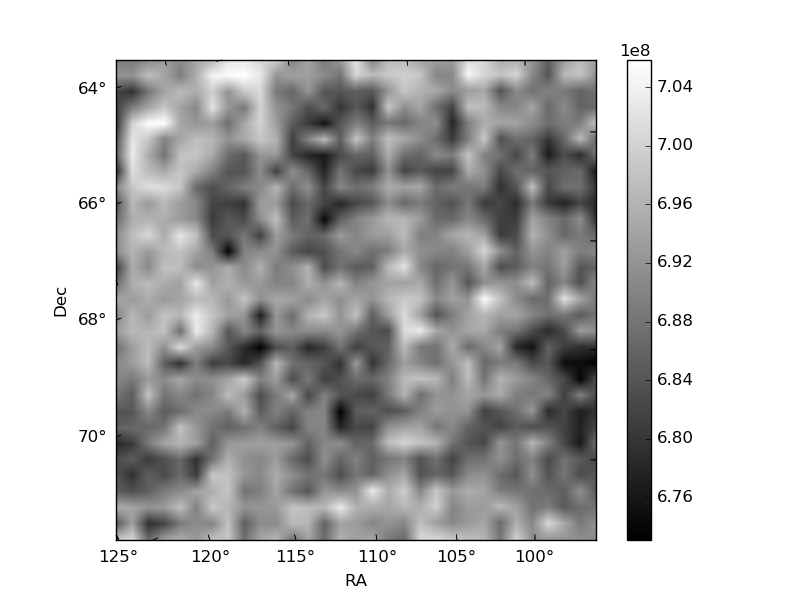
Histogram calculated using DETX and DETY for each event in the final _common_clean file
| Quadrant A | 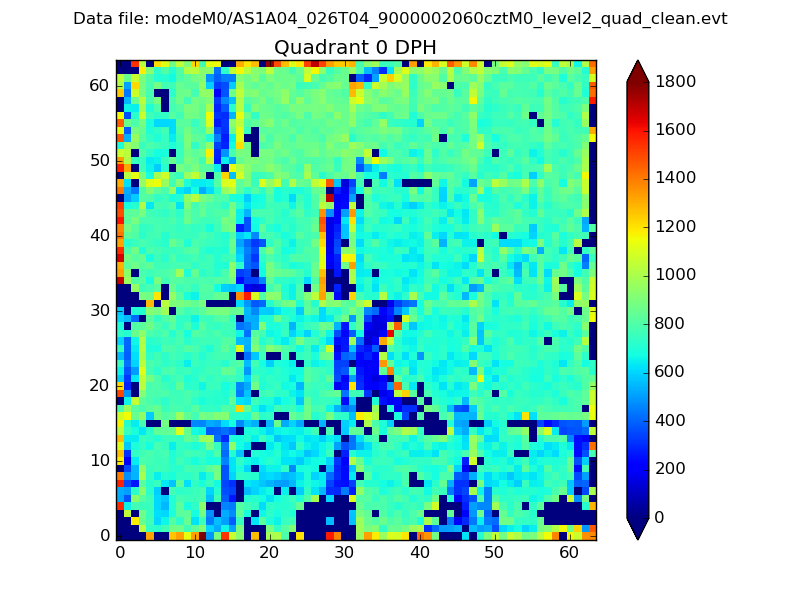 |
 |
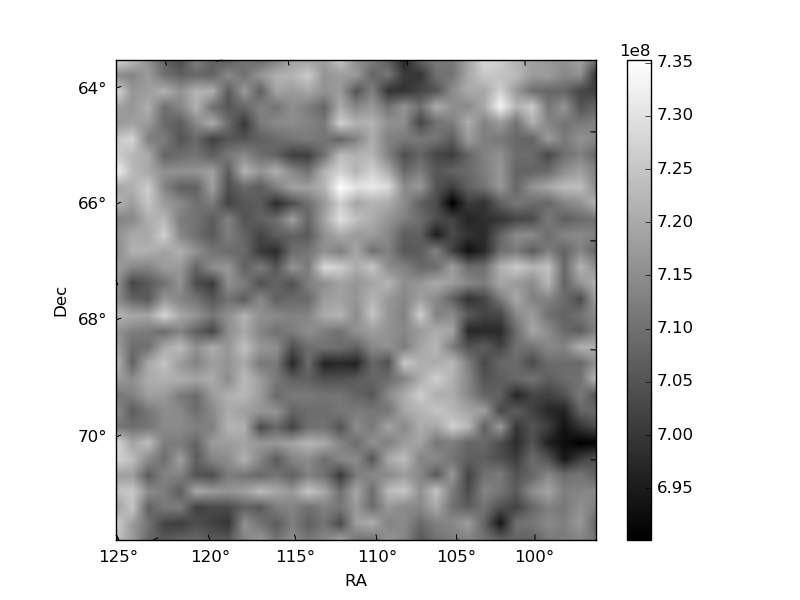
Quadrant B |
|---|---|---|---|
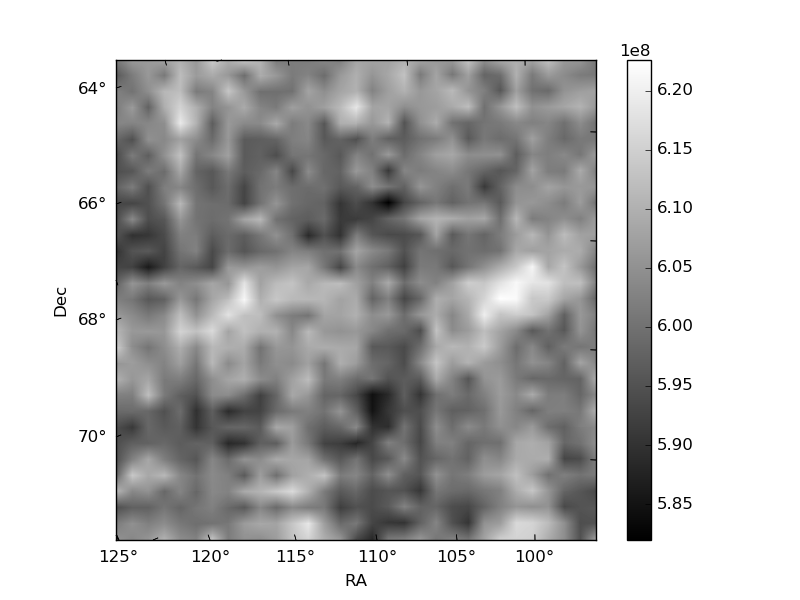
| Quadrant D | 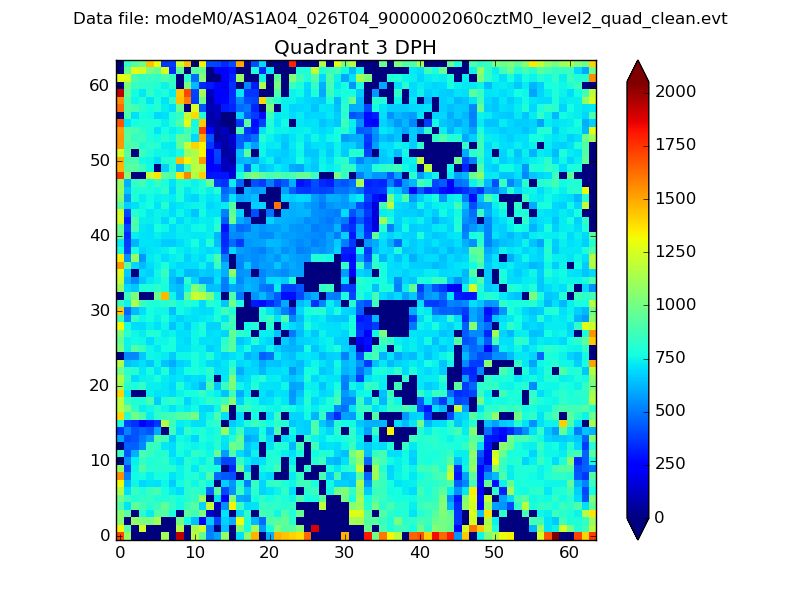 |
 |
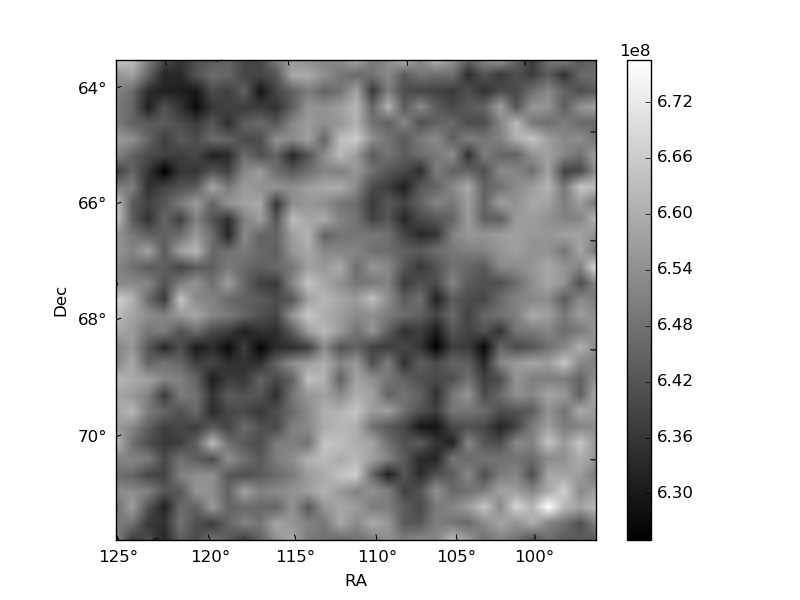
Quadrant C |
| Plot type | Count rate plots | Images |
|---|---|---|
| Comparison with Poisson distribution Blue bars denote a histogram of data divided into 1 sec bins. Red curve is a Poisson curve with rate = median count rate of data. |
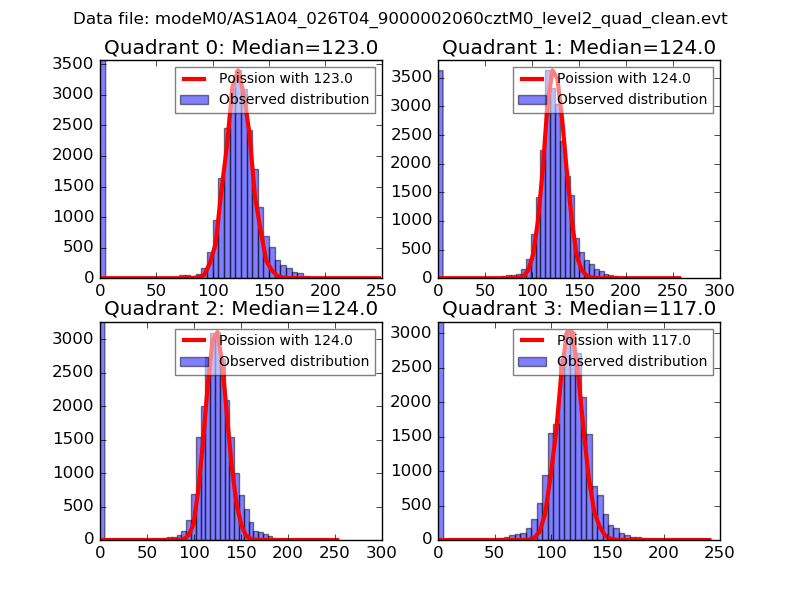 |
 |
| Quadrant-wise count rates Data is divided into 100 sec bins |
 |
|
| Module-wise count rates for Quadrant A Data is divided into 100 sec bins |
 |
 |
| Module-wise count rates for Quadrant B Data is divided into 100 sec bins |
 |
 |
| Module-wise count rates for Quadrant C Data is divided into 100 sec bins |
 |
 |
| Module-wise count rates for Quadrant D Data is divided into 100 sec bins |
 |
 |
| Parameter | Plot |
|---|---|
| CZT HV Monitor |  |
| D_VDD |  |
| Temperature 1 |  |
| Veto HV Monitor |  |
| Veto LLD | 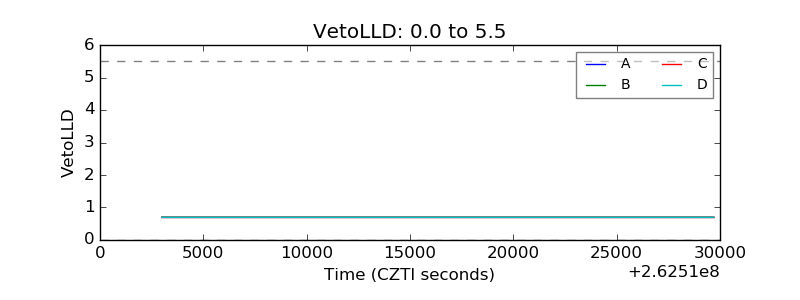 |
| Alpha Counter | 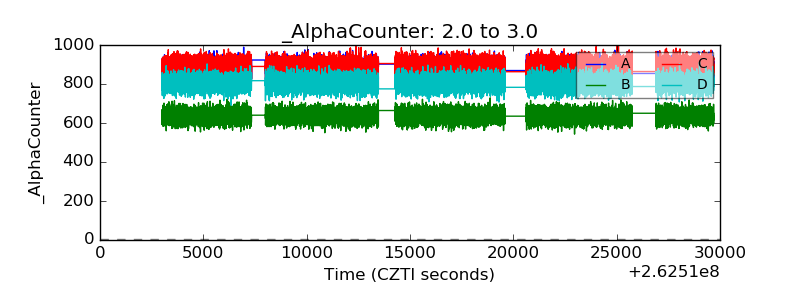 |
| _CPM_Rate | 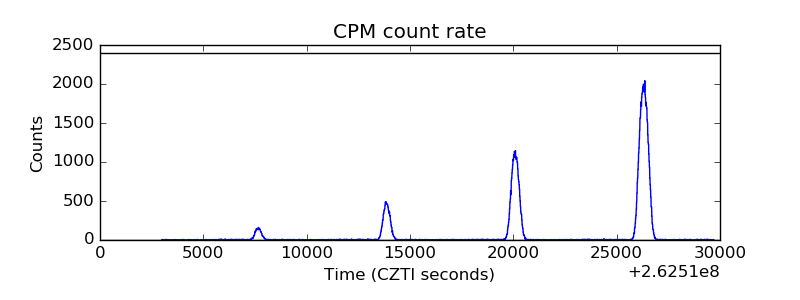 |
| CZT Counter | 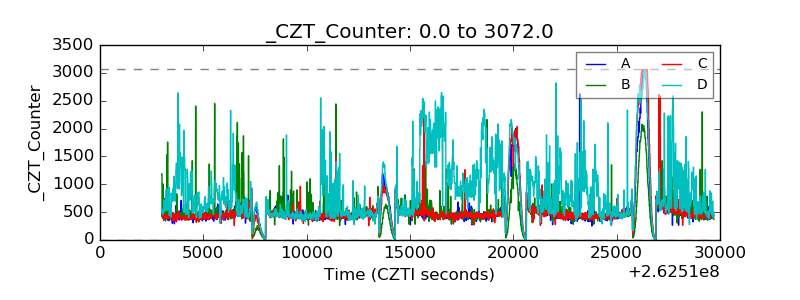 |
| +2.5 Volts monitor |  |
| +5 Volts monitor | 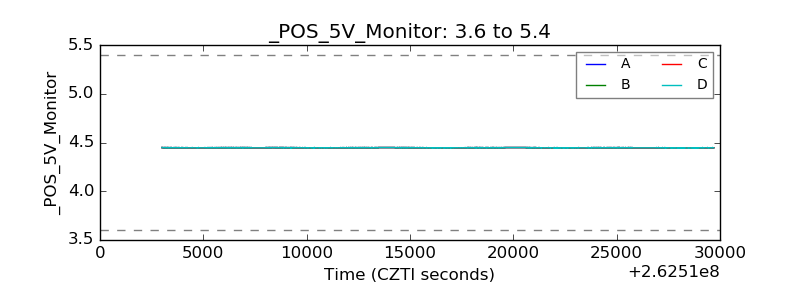 |
| _ROLL_ROT |  |
| _Roll_DEC |  |
| _Roll_RA |  |
| Veto Counter |  |