| Param | Original file | Final file |
|---|---|---|
| Filename | modeM0/AS1A04_026T04_9000002060_13947cztM0_level2.evt | modeM0/AS1A04_026T04_9000002060_13947cztM0_level2_quad_clean.evt |
| Size (bytes) | 661,325,760 | 164,491,200 |
| Size | 630.7 MB | 156.9 MB |
| Events in quadrant A | 4,173,197 | 1,099,882 |
| Events in quadrant B | 4,981,407 | 1,103,034 |
| Events in quadrant C | 4,058,180 | 1,097,256 |
| Events in quadrant D | 6,192,583 | 1,044,383 |
| Mode M9 | |||
|---|---|---|---|
| Quadrant | BADHDUFLAG | Total packets | Discarded packets |
| A | 0 | 7 | 0 |
| B | 0 | 7 | 0 |
| C | 0 | 7 | 0 |
| D | 0 | 7 | 0 |
| Mode SS | |||
|---|---|---|---|
| Quadrant | BADHDUFLAG | Total packets | Discarded packets |
| A | 0 | 186 | 0 |
| B | 0 | 186 | 0 |
| C | 0 | 186 | 0 |
| D | 0 | 186 | 0 |
| Mode M0 | |||
|---|---|---|---|
| Quadrant | BADHDUFLAG | Total packets | Discarded packets |
| A | 0 | 18766 | 2 |
| B | 0 | 21003 | 1 |
| C | 0 | 18589 | 1 |
| D | 0 | 24703 | 1 |
| Quadrant | Total seconds | Saturated seconds | Saturation percentage |
|---|---|---|---|
| A | 9195 | 48 | 0.522023% |
| B | 9195 | 163 | 1.772703% |
| C | 9195 | 14 | 0.152257% |
| D | 9195 | 137 | 1.489940% |
Noise dominated data is calculated using 1-second bins in cleaned event files. If a bin has >2000 counts, and if more than 50% of those come from <1% of pixels, then it is considered to be noise-dominated and hence unusable.
| Quadrant | # 1 sec bins | Bins with >0 counts | Bins with >2000 counts | High rate bins dominated by noise | Noise dominated (total time) | Noise dominated (detector-on time) | Marked lightcurve |
|---|---|---|---|---|---|---|---|
| A | 9866 | 9197 | 5 | 5 | 0.05% | 0.05% | 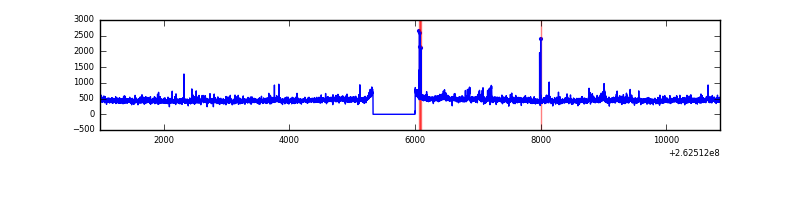 |
| B | 9866 | 9197 | 67 | 67 | 0.68% | 0.73% | 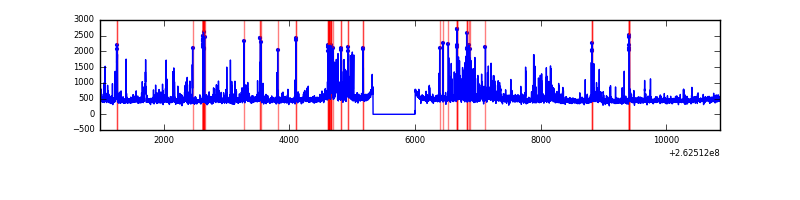 |
| C | 9866 | 9197 | 1 | 1 | 0.01% | 0.01% | 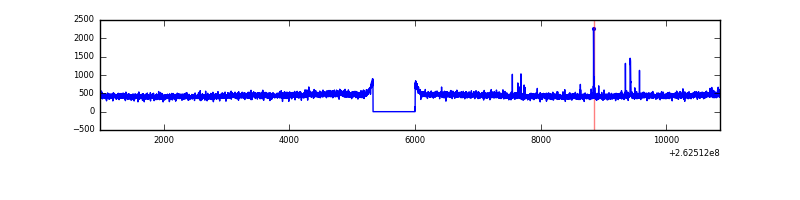 |
| D | 9866 | 9197 | 108 | 108 | 1.09% | 1.17% | 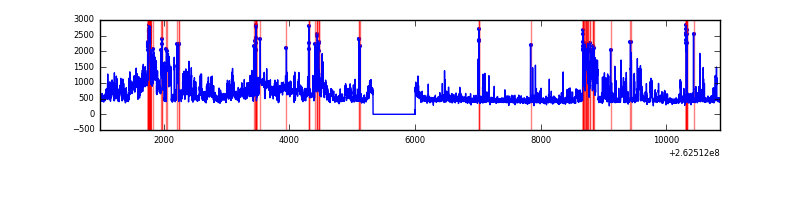 |
Top three noisy pixels from each quadrant. If the there are fewer than three noisy pixels in the level2.evt file, extra rows are filled as -1
| Pixel properties | Quadrant properties | ||||||
|---|---|---|---|---|---|---|---|
| Quadrant | DetID | PixID | Counts | Sigma | Mean | Median | Sigma |
| A | 8 | 15 | 100752 | 477.2 | 1031 | 1007 | 209.0 |
| A | 1 | 162 | 39602 | 184.64 | 1031 | 1007 | 209.0 |
| A | 14 | 111 | 25694 | 118.11 | 1031 | 1007 | 209.0 |
| B | 10 | 245 | 505293 | 2600.89 | 1028 | 1000 | 193.9 |
| B | 0 | 189 | 152878 | 783.31 | 1028 | 1000 | 193.9 |
| B | 3 | 64 | 79883 | 406.84 | 1028 | 1000 | 193.9 |
| C | 3 | 233 | 100003 | 428.01 | 1009 | 1013 | 231.3 |
| C | 0 | 207 | 16106 | 65.26 | 1009 | 1013 | 231.3 |
| C | 13 | 61 | 7258 | 27.0 | 1009 | 1013 | 231.3 |
| D | 12 | 110 | 1163828 | 4829.17 | 999 | 973 | 240.8 |
| D | 13 | 122 | 587110 | 2434.14 | 999 | 973 | 240.8 |
| D | 13 | 189 | 149077 | 615.05 | 999 | 973 | 240.8 |
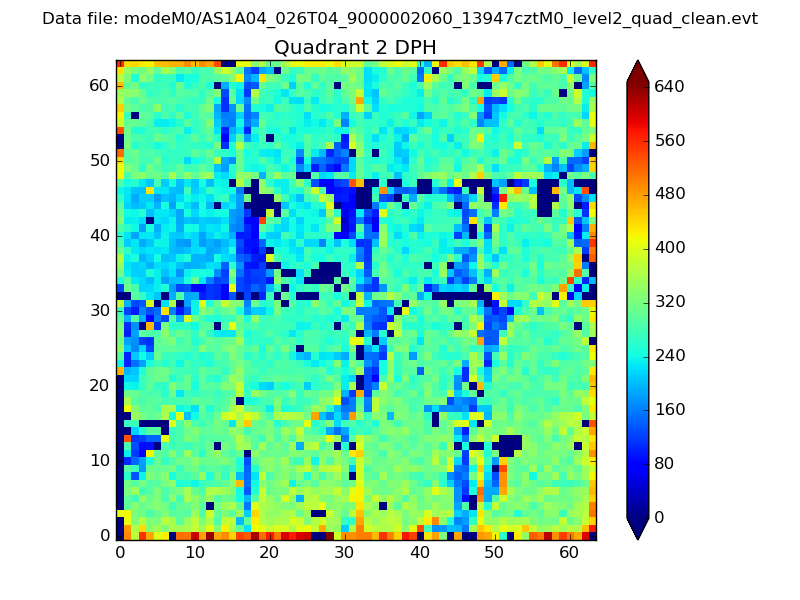
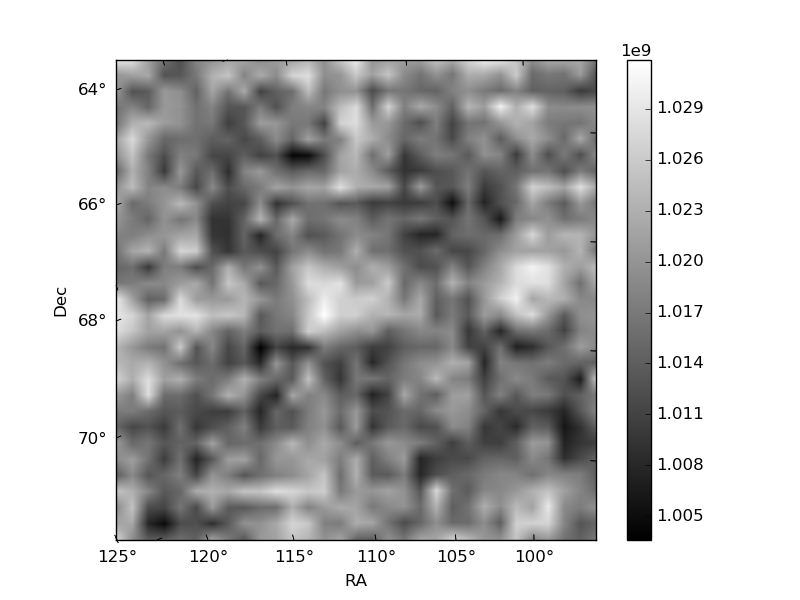
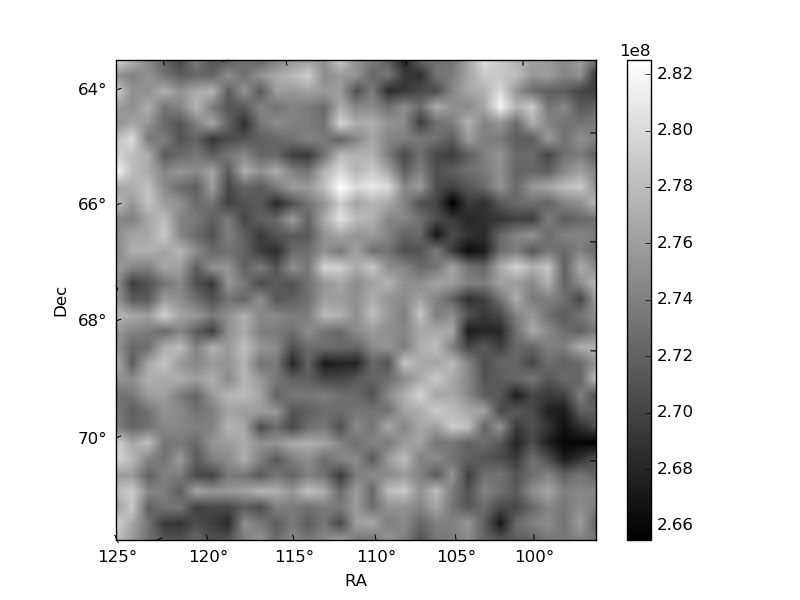
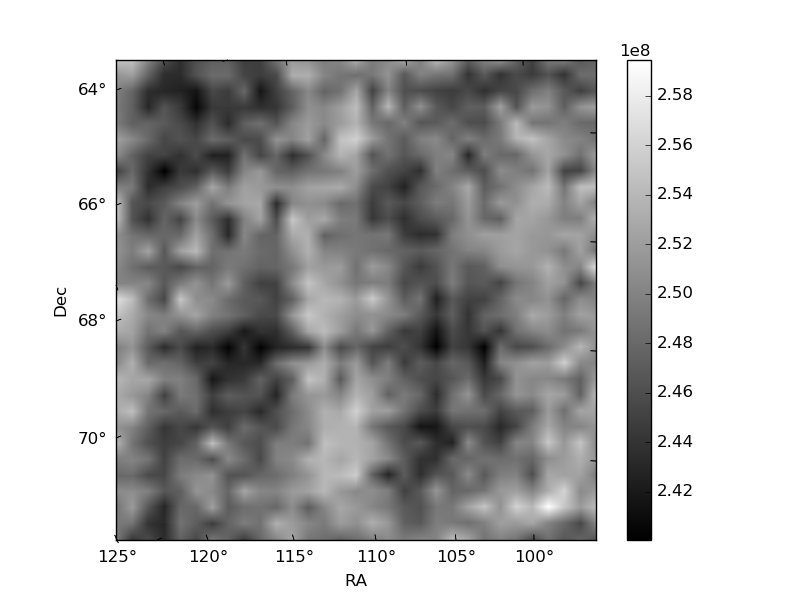
Histogram calculated using DETX and DETY for each event in the final _common_clean file
| Quadrant A | 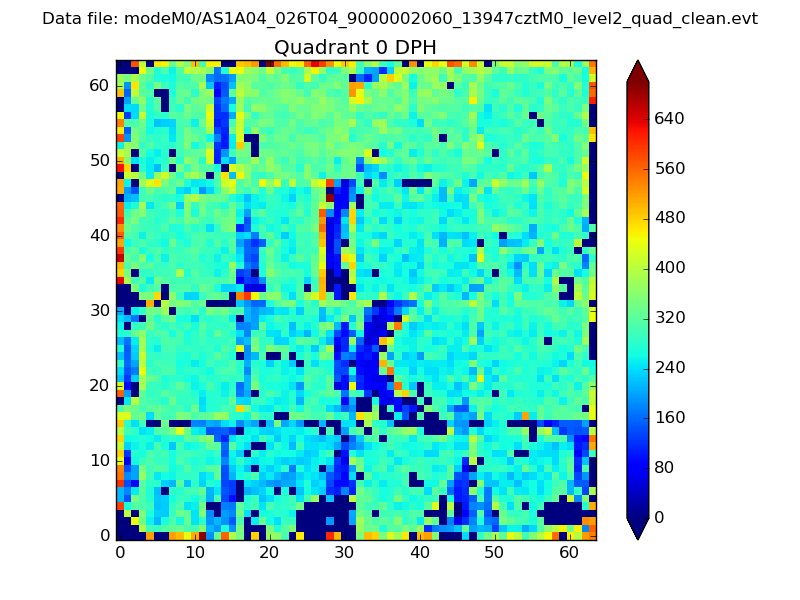 |
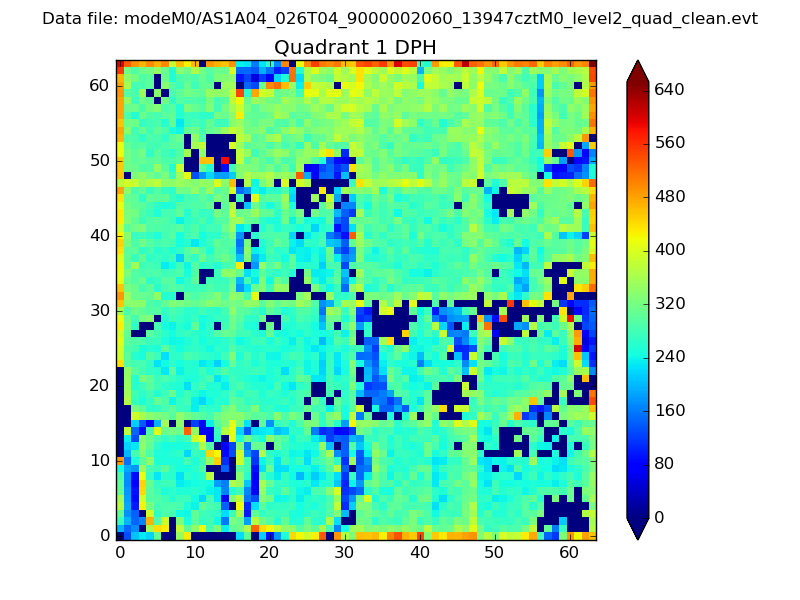 |
Quadrant B |
|---|---|---|---|
| Quadrant D | 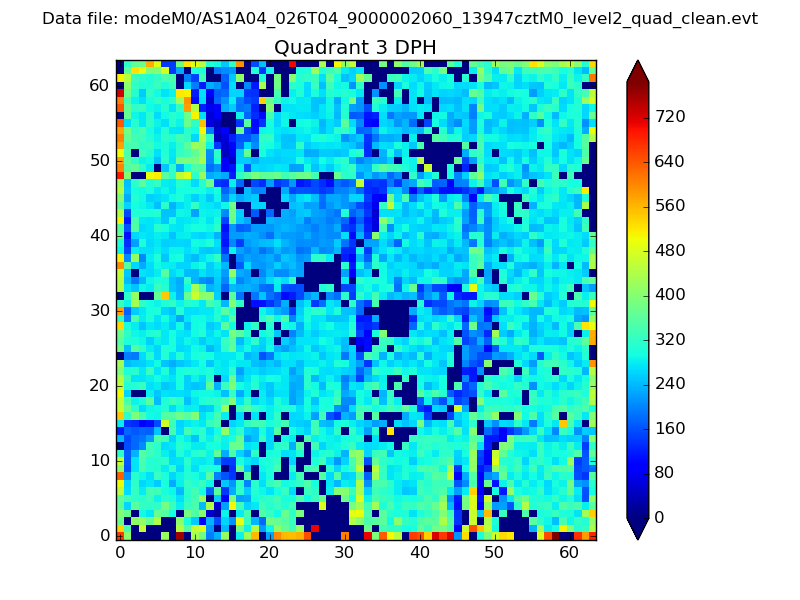 |
 |
Quadrant C |
| Plot type | Count rate plots | Images |
|---|---|---|
| Comparison with Poisson distribution Blue bars denote a histogram of data divided into 1 sec bins. Red curve is a Poisson curve with rate = median count rate of data. |
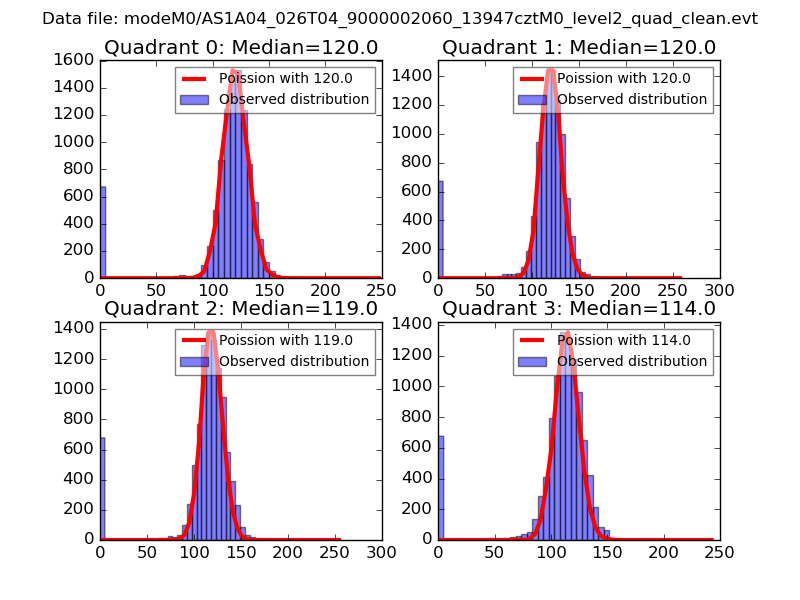 |
 |
| Quadrant-wise count rates Data is divided into 100 sec bins |
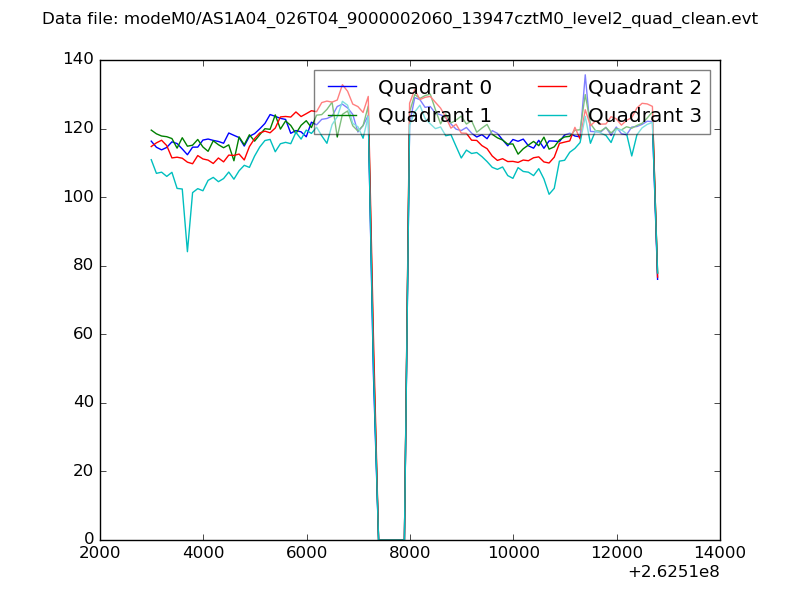 |
|
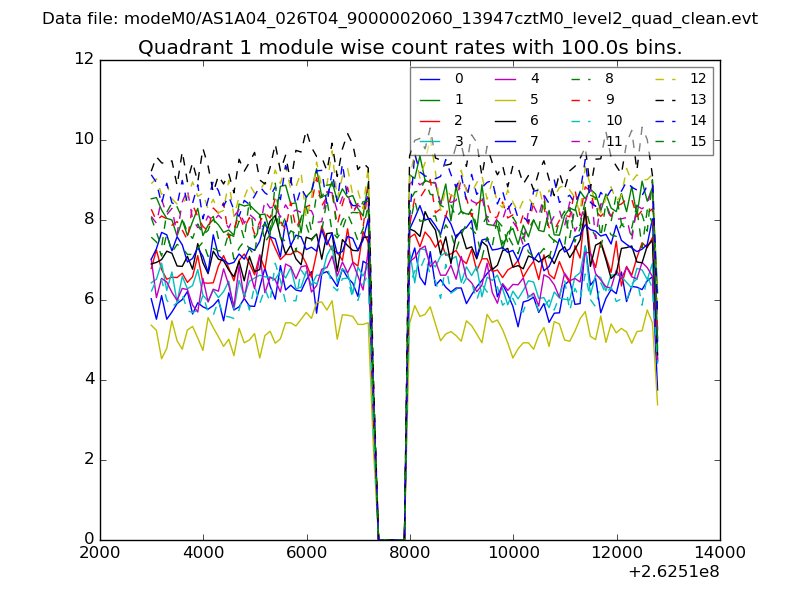
| Module-wise count rates for Quadrant A Data is divided into 100 sec bins |
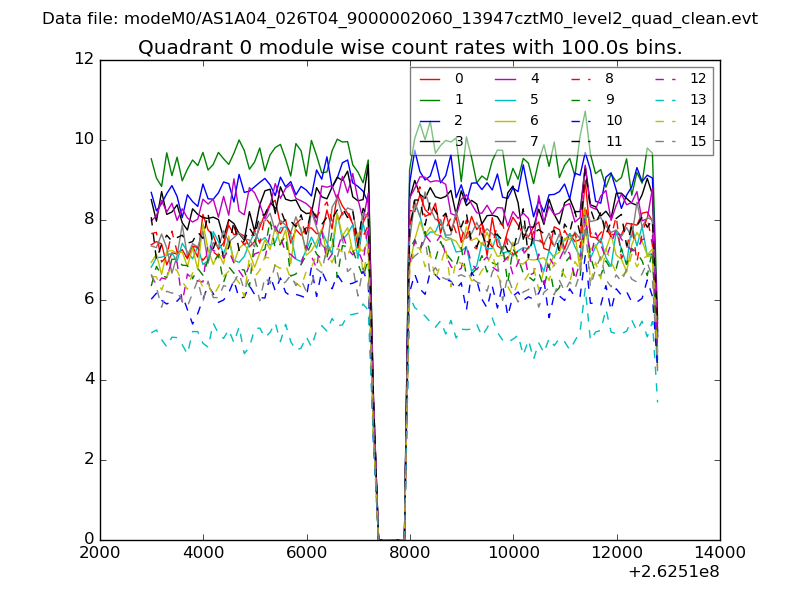 |
 |
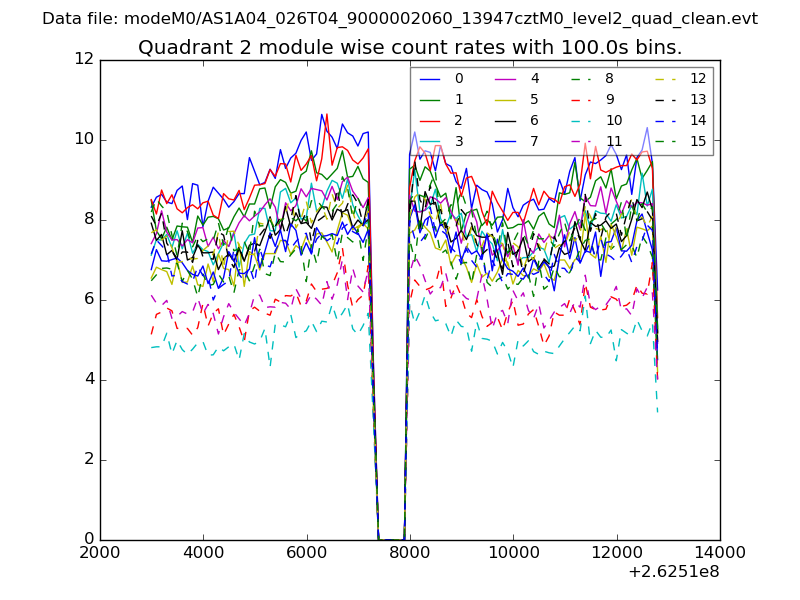
| Module-wise count rates for Quadrant B Data is divided into 100 sec bins |
 |
 |
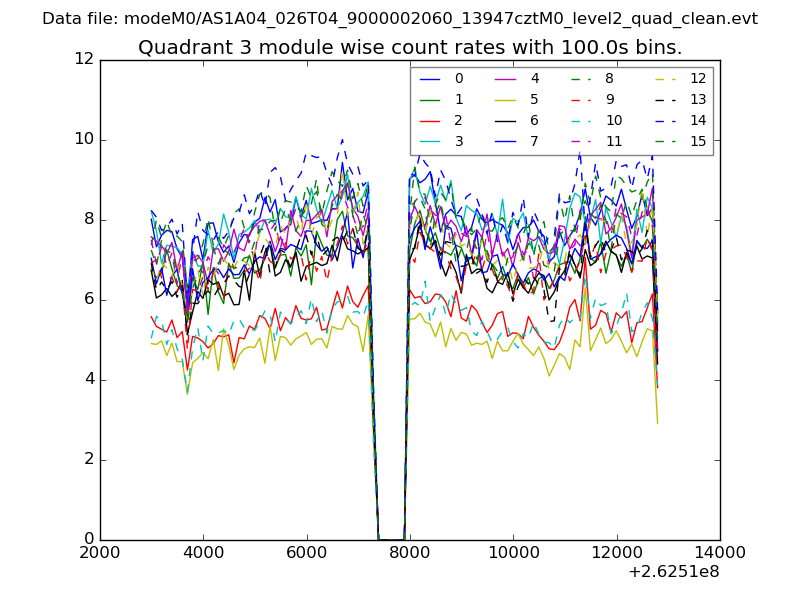
| Module-wise count rates for Quadrant C Data is divided into 100 sec bins |
 |
 |
| Module-wise count rates for Quadrant D Data is divided into 100 sec bins |
 |
 |
| Parameter | Plot |
|---|---|
| CZT HV Monitor | 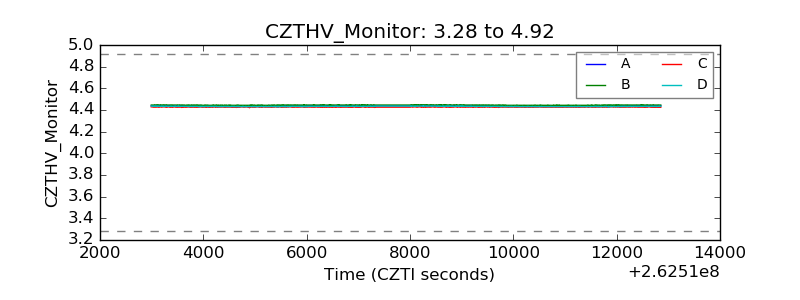 |
| D_VDD | 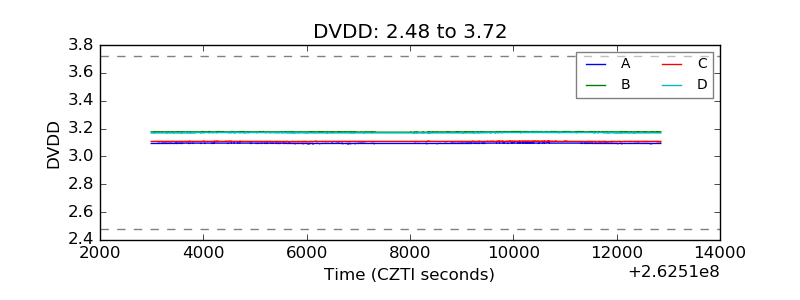 |
| Temperature 1 | 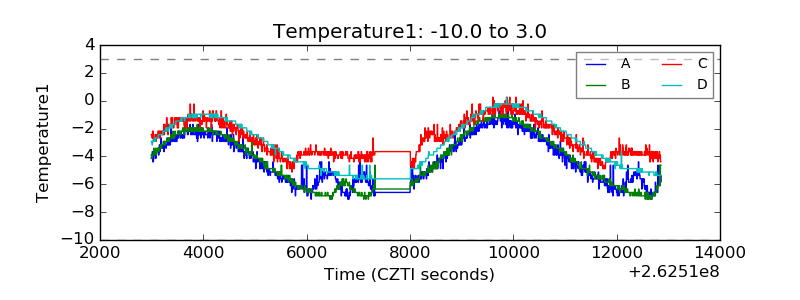 |
| Veto HV Monitor |  |
| Veto LLD | 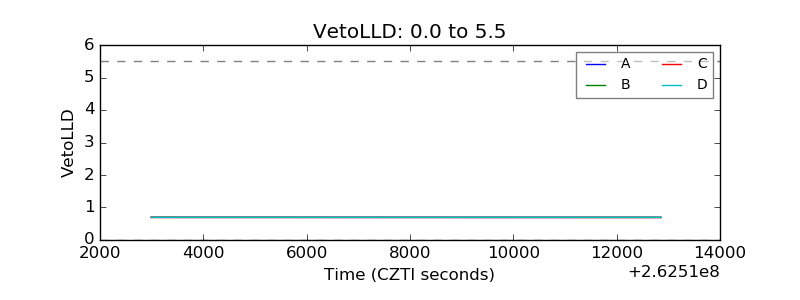 |
| Alpha Counter | 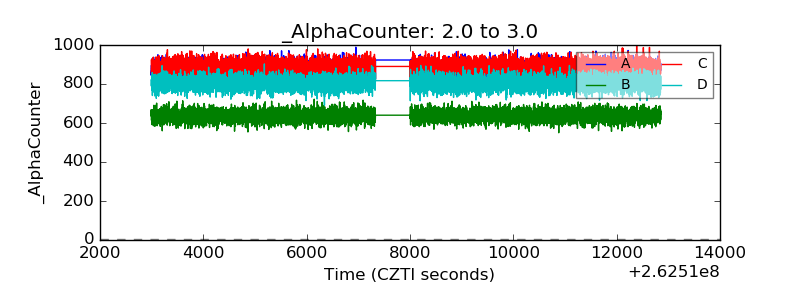 |
| _CPM_Rate | 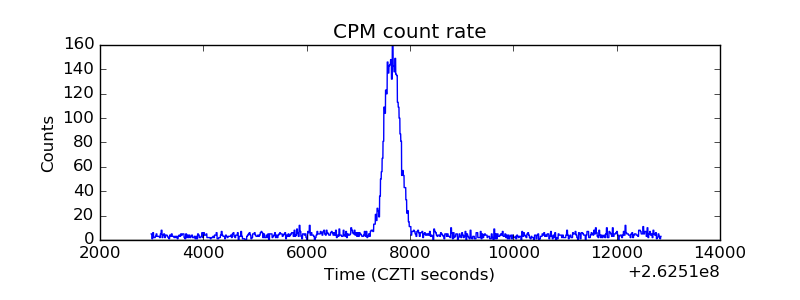 |
| CZT Counter | 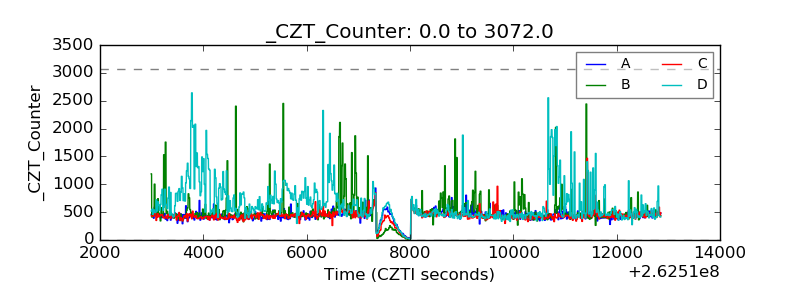 |
| +2.5 Volts monitor |  |
| +5 Volts monitor |  |
| _ROLL_ROT | 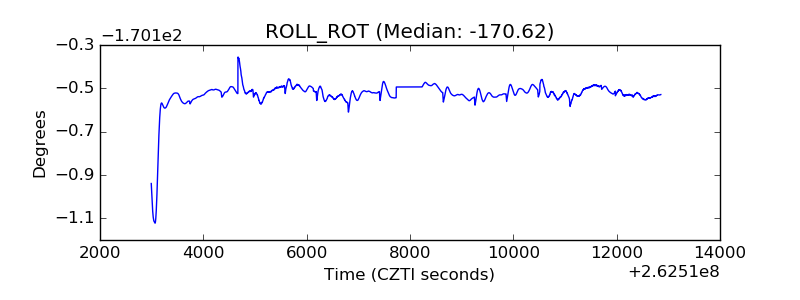 |
| _Roll_DEC | 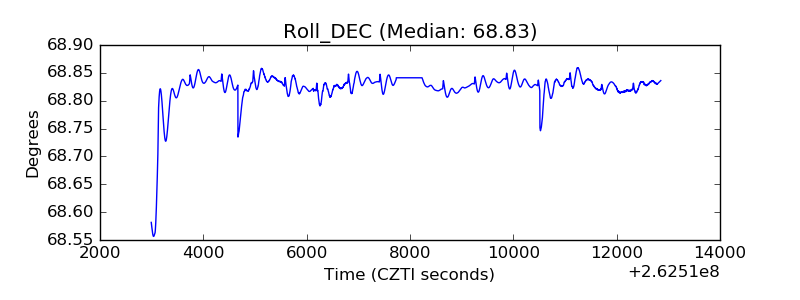 |
| _Roll_RA | 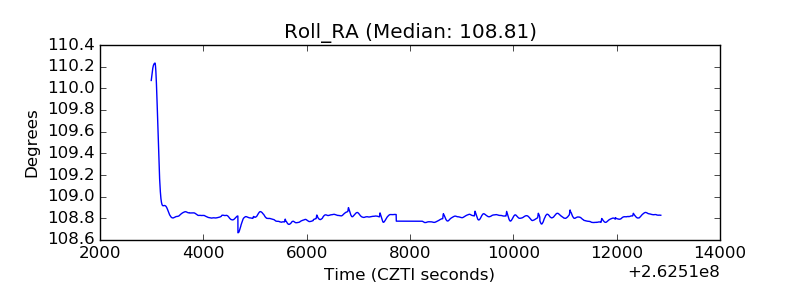 |
| Veto Counter | 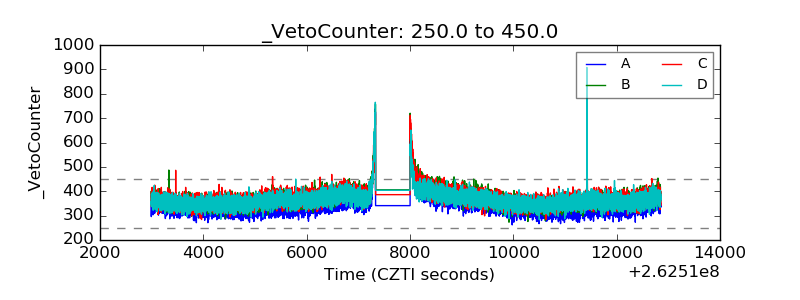 |